

 PDF
PDF ePub
ePub Citation
 Print
Print


Bronchial asthma is characterized by reversible airway obstruction, airway inflammation, and airway hyperresponsiveness to a wide variety of stimuli (1-2). Because postmortem examination cannot reflect their episodic and functional abnormality, the examination of morphologic abnormalities occurring in asthma cases is difficult. In addition, due to morbidity in patients who suffer asthmatic attacks, endoscopic or bronchographic studies have rarely been performed. The observation of airflow obstruction has, therefore, usually been achieved by indirect means such as the pulmonary function test, plethysmography, or measurements of total airway resistance or endotracheal pressure (3-9). These indirect methods are, however, insensitive to airway caliber changes (10) and reflect only global reaction, failing to provide information about differences in large and small airways. Recent studies have attempted to interpret the mechanics of airway narrowing in bronchial asthma by visualizing airway reactivity directly through induced bronchoconstriction (10-11). Direct visualization of the exact site and extent of airway narrowing in asthmatic patients permits study of the mechanisms involved in the condition, and its pathophysiology, as well as selection of the specific therapeutic agent which can offer relief at the specific narrowing site.
Thus, we performed this study in order to investigate the ability of thin-section and volumetric three-dimensional (3-D) computed tomography (CT) to depict airway reactivity to bronchoconstrictor and bronchodilator and to assess the effect of different airway size on the degree of reactivity.
MATERIALS AND METHODS
Selection of Animal
Initially we performed a pilot study with a Yorkshire pig model, but because thin-section CT showed that the bronchi of this animal were relatively thick-walled and small-calibered, and the response to airway stimulating agents was thus minimally visible, the model was rejected as unsuitable. Instead, we chose mongrel dogs. These animals have relatively thin-walled and large-calibered bronchi, and CT thus demonstrates airway reactivity; they are, in addition, relatively easy to handle.
Animal Preparation
Eight mongrel dogs weighting 10-12 Kg underwent fasting for 6 hours prior to anesthesia, and atropine (Daehan Atropine; Daehan Pharmaceutical, Seoul) was injected intramuscularly. The dogs were anesthetized by intramuscular injection of 0.2 ml/Kg of a mixture of 1ml of 2% xylazine hydrochloride (Rompun; Bayer Korea, Seoul, Korea) and 1ml of 10% ketamine hydrochloride (Ketara; Yuhan Yanghang, Seoul, Korea). Anesthesia was maintained by intravenous injection of 5-7 mg/Kg of thiopental sodium (Pentothal; Choong Wae Pharmacy, Seoul, Korea). Immediately after the induction of anesthesia, intubation was performed using a 7.5-mm inside-diameter endotracheal tube and a Bear-2 adult volume ventilator (Bear Medical Systems Corporation, Riverside, Cal.) provided ventilation at a rate of 20 breaths/ minute and a tidal volume of 300 ml. To minimize motion artifacts and achieve constant lung volumes during CT scanning, the animals were paralyzed by intravenous injection of 1 mg/ kg of succinylcholine chloride (Quelin; Abbott Laboratories, Chicago, Ill.) at functional residual capacity (11).
Study Design
Eight dogs underwent a total of nine examinations. In one animal, two examinations were performed at an interval of two weeks. It has been reported that intravenous methacholine induces constriction only in the airways, whereas aerosolized methacholine causes constriction both in the airways and in the parenchyma (12-13), and to induce bronchoconstriction, intravenous bolus injection of 0.1 mg/kg methacholine chloride (Provocholine; Roche, U.S.A.) was therefore performed. To induce bronchodilation, 2 ml of 1% salbutamol (Ventolin; GlaxoWellcome) was inhaled for 1 minute through a nebulizer connected to the ventilator.
In our study, the procedure adopted by Amirav et al. (14) and Kee et al. (15) was modified in such a way that initially, each dog underwent control thin-section CT, and after subsequent methacholine injection, the second series of CT scans was immediately obtained. After a 5-min delay, CT scanning was repeated, and each dog then received ventolin through a nebulizer. Five minutes later, the final series of scans was obtained. In order to demonstrate the relationship between morphologic airway reactivity and physiologic parameters, peak airway pressure (PAP) was measured through a pressure gauge connected to the ventilator immediately before CT scanning.
CT Examination
During the early period when spiral CT was not available, a CT/T 9800 Quick scanner (General Electric Medical System, Milwaukee, Wis.) was used for the first five examinations. The number of slices was five to seven, each 3 cm below the tracheal carina and just above the diaphragm with an interval of 3-mm. Scanning parameters were 1.5-mm collimation, 1.5-mm interslice gap, 140 kVp, 170 mA and 1.5-sec scan time. For the last four examinations, spiral CT scans covering the entire thorax were obtained with a Somatom Plus-S scanner (Siemens Medical Systems, Erlangen, Germany). The parameters were a 3-mm collimation, 1-to-1 pitch, 1-sec scan time, 120 kVp, 165 mA, and a reconstruction interval of 2 mm.
Measurement of Cross-Sectional Area
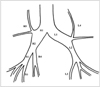
For the measurement of cross-sectional area (CSA), we used the region-of-interest (ROI) stat program, built into the GE 9800 Quick scanner, by drawing a circle around selected bronchial lumen. Measurements were taken at four sites: both diaphragmatic bronchi and the lower portion of these bronchi that could be unambiguously identified at the same anatomic level under all experimental conditions (Fig. 1). The image data obtained from the Somatom Plus-S were transferred to an Allegro medical imaging workstation (ISG Technologies Inc., Canada), and using a seeded volume of interest (VOI) technique, CSAs were calculated (16). Measurements were obtained at ten sites: the main, apical, diaphragmatic, and lower portion of diaphragmatic bronchi at both sides, the right diaphragmatic bronchus after the azygos, and the azygos bronchus (Fig. 1). When the operator set both upper and lower thresholds and defined a seed point in the selected bronchial lumen, an isodense area was automatically filled and the corresponding CSA was calculated. If a portion of the VOI leaked into an area that we did not wish to include, the portion could be cut off by drawing a line at the point of leakage. Window width/ level were fixed at 1350 HU/ -450 HU, which were considered suitable for airway observation (10-11). We selected longitudinal airways, which were round. To compensate for errors due to slight differences in location at the selected bronchial site, CSA was measured two to five times at each site, depending on the length and direction of each bronchus, and averaged.
Volumetry
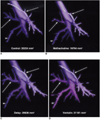
In four examinations in which spiral CT was performed, 3-D reconstruction by means of the shaded surface-display technique was performed, using the data transferred to the Allegro medical imaging workstation. The volume data included from round tracheal lumen to the smallest bronchial lumen. Using the seeded VOI technique, as explained above, proximal airway volume (PAV) was automatically calculated.
Data Analysis
The mean CSA at each bronchial site represents the average of measured CSAs of nine examinations. Percentage changes occurring in mean CSA, PAV, and PAP during the methacholine challenge and delayed state were represented as percentages of the control state, while those occurring during the ventolin challenge state were expressed as percentages of the delayed state, which provided a baseline value.
Using Wilcoxon's signed rank test, changes in mean CSAs, suggesting airway reactivity, and in PAV and PAP after the administration of drugs, were statistically analyzed. By means of linear regression analysis, we correlated degree of airway activity, expressed as the percentage change induced by methacholine, with airway size, expressed as CSA during the control state. A p-value less than 0.05 was considered statistically significant.
RESULTS
Changes in Mean CSAs and PAV after the Administration of Drugs
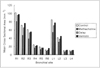
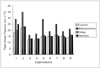
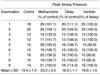
CT images revealed that the mean CSAs at multiple bronchial sites of the bronchi on changed after the injection of methacholine and the inhalation of ventolin (Table 1, Fig. 2). During the control state, the mean CSAs of selected bronchi, as shown by CT, ranged from 9.6 to 101.8 (median; 32.9 ) mm2. Immediately after the injection of methacholine, mean CSAs of the bronchi at all sites significantly decreased (change, 70.2±6.2% (mean±standard deviation); p = 0.002 ). During the 5-min delayed state, CSAs were close, but still significantly different, to those observed during the control state (change, 92.3±6.5%; p = 0.009). Five minutes after the inhalation of ventolin, mean CSAs significantly increased compared to those seen during the delayed state (change, 113.1±11.4%; p = 0.002) (Fig. 3). Three-dimensional reconstruction images obtained in four dogs showed that the median value of PAV decreased from 19270 mm3 during control state to 15801 mm3 immediately after the injection of methacholine (change, 83.0±3.0%). During the 5-minute delay, the median value of PAV increased to 18497 mm3 (change, 92.4±6.5%), and five minutes after the inhalation of ventolin increased to 21084 mm3 (change, 113.1±8.6%) (Fig. 4). During no sequence were the changes in PAV statistically significant, however.
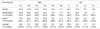
PAP also changed after the injection of methacholine and the inhalation of ventolin (Table 2, Fig. 5). Its level increased significantly from 15.4±1.0 cm H2O during the control state to 23.3±2.2 cm H2O immediately after the injection of methacholine (change, 149.8±21.1%; p = 0.003). During the 5-minute delay, PAP decreased to 16.3±1.1 cm H2O (change, 105.9±5.2%), a significantly different level from that seen during the control state (p = 0.03). Five minutes after the inhalation of ventolin, PAP rather increased to 16.6±1.5 cm H2O (change, 100.7±4.4%), but this change was not statistically significant (p = 0.9).
Correlation between Degree of Airway Reactivity and Airway Size
Although the absolute difference in CSAs induced by methacholine challenge was much greater in large airways than in small ones (p = 0.0001), the degree of airway reactivity, expressed as percentage change of in CSAs, did not correlate with airway size during the control state [β(regression coefficient) = 0.01; p = 0.71].
DISCUSSION
In this study, we were able to demonstrate by means of CT the extent to which bronchial reactivity was induced by both bronchoconstrictor and bronchodilator. CSA decreased significantly after the administration of methacholine, but a scan obtained five minutes later showed insufficient normalization. The use of ventolin led to significantly increased CSA of the airways.
Methacholine induced a significant increase in PAP, but again, the normalization observed after five minutes was insufficient. The changes in PAP induced by ventolin were not statistically significant, and we can speculate that after the five-minute delay, the methacholine effect had not completely disappeared. Methacholine has both a rapid onset (< 2 mins) and a relatively long duration of action (at least 30 mins), and at the time of ventolin inhalation, both the bronchodilator effect of ventolin itself and a possible decrease in the effect of methacholine could have induced airway dilatation. After the inhalation of ventolin, PAP did not significantly decrease despite the significant bronchodilation visible on CT, including that seen in a dog which showed an unexplainable increase in PAP (Table 2, examination 1). The effect of ventolin on the remaining dogs was that airway pressure either decreased or remained the same (Table 2). We believe that this discrepancy between the changes occurring in CSA and in PAP was due to the nonuniform deposition of aerosolized particles and discordance between morphology and physiology. These particles, which are predominantly deposited in large airways, act only on those parts of the airway in which they are deposited (17). Furthermore, since it is influenced much more severely by changes in small airways (18), PAP might not significantly decrease, even though sufficient bronchodilation of large airways was achieved by the amount of ventolin we used. We believe, in addition, that the changes in airway areas revealed by CT, rather than changes in airway pressure, more sensitively reveal the bronchodilation induced by ventolin.
This study of the relationship between degree of airway reactivity and airway size was a trial for investigating local response at each bronchial level. Drazen and Schneider (19) demonstrated a substantial decrease in the density of cholinergic receptors between trachea and lung parenchymal strips in the guinea pig. Nadel et al. (20) and Shioya et al. (21), on the other hand, observed that maximum constriction in airways, expressed as percentage change in diameter, occurred in smaller bronchi. We observed that the percentage decrease in cross-sectional areas did not correlate with airway size, though absolute differences in area
were larger in larger bronchi. We speculate that the averaging of heterogeneous response in individual dogs led to a statistically insignificant result. In bronchi at the same level, individual dogs in our study demonstrated bronchoconstriction ranging widely from 40 to 80% of the control value. Herold et al. (11) believed that heterogeneity among dogs represented variation in individual responsiveness to bronchoconstrictor challenge.
Physiologic studies to assess bronchial reactivity to stimuli provide information regarding overall response of the airway, but not on local response at each bronchial level, and morphologic as well as physiologic analysis may be valuable in assessing the degree of airway reactivity or the site of action of therapeutic agents. Since the trial using tantalum bronchography in the study by Nadel et al. (20) of the effect of vagal stimulation on airways, several reports have described the physiologic imaging of airways affected by bronchoconstrictor. Benson et al. (22) directly visualized airway response to vagal stimulation and inhaled histamine by using tantalum bronchography in their experiment involving dogs. They were able to directly visualize changes in airway caliber, an approach which was more comprehensive than tests of forced expiration or measurements of total airway resistance.
In contrast to tantalum bronchography, which itself can provoke bronchoconstriction (11), CT can demonstrate changes in the diameter of the central airways without additional stimulation of the bronchi, and human studies involving normal and asthmatic patients are thus possible safely. High-resolution CT (HRCT) can demonstrate bronchioles with a diameter of 2 mm or more, or with a wall thickness of more than 0.1 mm (23). The clinical application of HRCT to airway diseases has been limited to static studies for the evaluation of fine structural abnormalities occurring in bronchiectasis, bronchiolitis, bronchial tumors, bronchial stenosis and congenital anomalies of the airways (24). The use of HRCT as a tool with which to assess dynamic response of the lung to various stimuli has recently been introduced and actively investigated. Using a dog model, Brown et al. (10) and Herold et al. (11) reported the HRCT findings of the airways after the administration of bronchoconstrictor, demonstrating decreased CSA of the bronchi after the inhalation of histamine.
Bronchoconstriction has been induced by the inhalation of methacholine or histamine, and in normal subjects, it has been suggested that the predominant site for bronchoconstriction by methacholine is the large airways, while histamine constricts the small airways around the alveolar ducts and alveoli in normal subjects via its direct action (4). We used methacholine in this study because of its preferential constricting effect on the large airways, visible with thin-section CT. Although it has been suggested that the respiratory tract is most reactive to nebulized methacholine (25), we administered the drug intravenously because the sites and rates of deposition of aerosolized particles are determined by the particle size of aerosols, and the frequency and tidal volume of respiration. Due to its commercial availability, we used ventolin (salbutamol) as (2-agonist acting on both the central and peripheral airways in subjects with asthma (6), and most commonly inhaled.
Volumetric acquisition by means of spiral CT and 3-D volume rendering of the proximal airway, performed in four dogs in our study, showed results similar to those obtained by axial CT imaging. Because it reflects not only transverse but also longitudinal changes, the measurement of airway volume using volumetric CT data might be more accurate in the evaluation of airways than measurement involving axial images. According to a phantom study performed to determine the accuracy of the method by which the length, diameter, and branch angles of pulmonary trees are measured using CT data, the results showed good correlation with actual values (26).
In conclusion, thin-section CT and volumetric spiral CT with 3-D reconstruction can clearly demonstrate airway reactivity to bronchostimulator. In our limited study, the degree of such reactivity revealed by thin-section CT did not correlate with airway size. CT scanning can therefore be used in the evaluation of pathophysiologic response of the airways.
 XML Download