

 PDF
PDF ePub
ePub Citation
 Print
Print


Even in cases involving a severe degree of spinal stenosis, routine MR imaging of the spine cannot represent the motion of cerebrospinal fluid (CSF). Effacement of the spinal canal due to spinal stenosis alters CSF hydrodynamics, and for the direct evaluation of these, it is thus important to understand the pathophysiology of cervical spinal stenosis as well as existing morphologic studies.
Since the introduction of radionuclide scanning (1, 2) and X-ray contrast cisternography and cineventriculography (3, 4), efforts to understand CSF flow have continuously increased. The understanding is still incomplete, however, and is hampered by the fact that lumbar puncture of the closed system of the CSF spaces may disturb physiological movements. Moreover, in earlier investigations, the replacement of incompressible CSF by highly compressed air, or oily myelographic contrast medium with one of a high specific gravity, or both was unavoidable (3-5).
The MR signal has long been known to be sensitive to motion, and nowadays, MR imaging is the only technique that can be used to noninvasively image the pulsatile flow of CSF. With MR imaging, normal and pathological CSF movements can be visualized and quantified noninvasively (6-8), and the mapping of flow patterns can be achieved under a variety of pathological conditions. When the local magnetization of a material is altered, the material maintains that alteration when it moves (within the limits of the relaxation time). Although there are other ways of detecting and measuring flow, such as time of flight (TOF) or phase-contrast (PC) mapping, these are limited to the detection of multicompartmental simultaneous changes in CSF in the spinal canal. On the TOF map, enhancement is limited to flow either entering the field of view, or that which is very high velocity, and is less sensitive to the slow velocity at which CSF flows through the spinal canal. PC mapping is more sensitive to signal losses caused by turbulence, and in order to select an optimum velocity encoding technique (VENC), it is necessary to estimate the maximum flow velocity. The spatial modulation of magnetization (SPAMM) technique has been adopted to study heart wall motion, blood flow and CSF (9-11). The stripes of SPAMM, dark band produced by a tagging pulse, can be displaced wherever there is a flow movement, even with the very slow flow found in the spinal canal.
In spinal stenosis, because the pattern and velocity of CSF flow can be altered due to a reduction in the CSF space, even without complete blockage of the spinal canal, as related by MR imaging, it is important to confirm the patent flow of CSF through the subarachnoid space. However, most previous studies using SPAMM have been conducted for the purpose of cardiac evaluation, and studies of CSF hydrodynamics are rare. To our knowledge, application of this technique to cervical spinal stenosis has not been reported. In this study, we optimized the ECG-triggered SPAMM technique and evaluated the hydrodynamic changes occurring in the CSF in cervical spinal stenosis.
MATERIALS AND METHODS
We examined 44 patients with stenosis of the cervical spine, 26 were male and 18 were female (mean age, 49 years; range, 20-87 years). The causative pathologies are detailed in Table 1. To investigate the normal pattern of CSF dynamics in the cervical spine, ten healthy volunteers, all male (mean age, 26 years ; range, 20-57 years), were included.
The degree of stenosis in the cervical spinal canal was rated as low-, intermediate-, or high-grade. Low-grade stenosis is defined as occurring where there is no evidence of effacement of the CSF space, and CSF signal intensity between the dural sac and the spinal cord is seen on T2-weighted images. Stenosis is defined as intermediate-grade where there is effacement of the dural sac on the spinal cord, but with no evidence of compressive myelopathy demomstrated by T2-weighted imaging. High-grade stenosis involves effacement of the dural sac on the spinal cord, together with evidence of compressive myelopathy revealed by T2-weighted imaging.
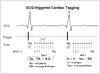
The study involved the use of a 1.5-T whole-body imaging system (Siemens Medical Systems, Erlangen, Germany) with a CP-spine-array coil. The basic principle of tagging sequences is illustrated in Fig. 1. To produce a grid or stripe pattern in the object, a tagging RF pulse was applied immediately after the trigger pulse, and this pattern was followed by a series of fast gradient-echo sequences. The number of gradient echo measurements was adjusted according to the number of phases, as is the case with a standard cine-type technique. Without any additional saturation pulses, the time between the application of the tagging RF pulse and the first gradient echo was as short as 2 msec. The application of subsequent gradient echoes was defined by the pulse repetition time (TR), as shown in Fig. 1. ECG-triggered multi-phase images were acquired using the following parameters: TR/TE/TD/flip angle, 42 msec/7.2 msec/0-630 msec/20°; matrix, 128×256; slice thickness, 6 mm; FOV, 250 mm; saturation thickness, 10 mm (stripe thickness was expressed as 2 mm). Sixteen phase-images at the same slice between every R-R wave of the ECG, as well as sagittal and coronal SPAMM images, were obtained. This sagittal image was compared with the pathologic status of a spin-echo T2-weighted sagittal image, and the coronal SPAMM image was used to observe CSF flow through the lateral canal in the dural sac.
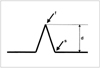
In the SPAMM stripe, a continuous straight band represents no flow movement, while wave displacement or discontinuity of the band indicates flow movement. In the theory, therefore, low-grade stenosis should show wave displacement or discontinuity, whereas intermediate- and high-grade stenosis should show a continuous straight band. In all stenosis patients and normal volunteers, CSF velocity was measured during each diastolic and systolic phase in the upper cervical subarachnoid space anteriorly to the C1-2 level, and in low-grade stenosis patients and volunteers, anteriorly to the C4-5 level. The reason for selecting the C4-5 level for evaluation of CSF velocity was that physiologic stenosis is observed in this segment where the thickest cervical cord is present. CSF velocity is given by distance over time (time for the tag to move). Using the statistics package in the hardware, the extent of bolus displacement was measured manually on the monitor with a magnifying view, and from the trailing edge of the stationary tag to the trailing edge of the flow tag (Fig. 2). Thus, CSF velocity with consecutive gradient-echo readouts was given by distance of bolus tag divided by TR, which in this study was 42 msec.
Three radiologists classified the degree of cervical spinal stenosis seen on routine spinal MR imaging as one of three grades, and blindly evaluated the stripe patterns of SPAMM. The statistical significance of differences in interobserver reliability was analyzed using the Cronbach coefficient alpha test; 0.7 or higher Cronbach coefficient alpha is adequate. The confidence level between stripe patterns of SPAMM and grades of cervical spinal stenosis was checked by a confidence interval of 95%. Using the paired t test, differences in CSF velocity determined using the SPAMM technique were found to be significant for p < .05.
RESULTS
Patterns of SPAMM stripes
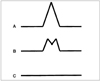
In healthy volunteers and patients, three patterns of SPAMM stripes were demonstrated (Fig. 3).
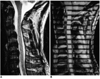
In all healthy volunteers, SPAMM stripes through normal CSF spaces in the cervical spine showed harmonious parabolic wave displacement corresponding to the CSF flow direction (Fig. 4). No healthy volunteers showed flow separation on SPAMM images.
With regard to pathologic status, the classification of grades of stenosis and stripe patterns performed blindly by three radiologists is summarized in Table 2. Interobserver reliability regarding classification of grades of stenosis was high (Cronbach coefficient alpha, .996).
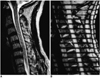
In low-grade stenosis (n = 23) (Fig. 5), interobserver reliability for displaced or discontinuous stripes in the stenotic segment was high (Cronbach coefficient alpha, .992) and the confidence level between stripe patterns of SPAMM and grades of spinal stenosis was also high ( > 95% confidence interval). Twelve cases showed wave separation, with double shape during the systolic phase.
In intermediate-grade stenosis (n = 11) (Fig. 6), interobserver reliability with regard to the continuous straight band seen in the stenotic segment was high (Cronbach coefficient alpha, .842), but the confidence level was intermediate ( < 95% confidence interval ).
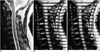
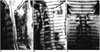
In high-grade stenosis (n = 11) (Fig. 7), interobserver reliability with regarding the continuous straight band in the stenotic segment was perfect (Cronbach coefficient alpha 1.0) and the confidence level was also high ( > 95% of confidence interval). In five cases of severe focally herniated cervical disc, accentuation of the SPAMM stripe throu-gh the lateral canal was revealed by coronal SPAMM images.
CSF velocity changes
In healthy volunteers, mean CSF velocities during the diastolic and systolic phases in the anterior subarachnoid space at the C1-2 level were 0.80±0.03 (2SD) and 1.33±0.03 (2SD) cm/sec, respectively (Table 3). At the C4-5 level, mean CSF velocities during the diastolic and systolic phases were 0.78±0.03 (2SD) and 1.85±0.03 (2SD) cm/sec, respectively. During the systolic phase, CSF velocity at the C4-5 level was significantly higher than at the C1-2 level (p < .05).
In the low-grade stenosis, the mean diastolic and systolic CSF velocities in the anterior subarachnoid space at the C1-2 level were 0.67±0.04 (2SD) and 1.34±0.02 (2SD) cm/sec, respectively. At stenotic C4-5 level in low-grade stenosis, mean diastolic and systolic CSF velocities were 0.68±0.04 (2SD) and 1.65±0.05 (2SD) cm/sec, respectively. During the systolic phase, CSF velocity at the C4-5 level was significantly higher than at the C1-2 level (p< .05) but the velocity at this level was significantly lower than in healthy volunteers (p < .05).
In intermediate-grade cases, mean CSF velocities during the diastolic and systolic phases in the anterior subarachnoid space at the C1-2 level were 0.64±0.06 (2SD) and 1.19±0.06 (2SD) cm/sec, respectively. Peak systolic velocity was lower than in healthy volunteers, but the difference was not statistically significant (p > .05).
In high-grade stenosis, mean CSF velocities during the diastolic and systolic phases in the anterior subarachnoid space at the C1-2 level were 0.49±0.03 (2SD) and 1.06±0.11 (2SD) cm/sec, respectively. As compared with healthy volunteers, velocities during both the diastolic and systolic phases were significantly lower (p < .05).
DISCUSSION
Since Du Boulay's investigations (3, 4), it has been known for certain that oscillating CSF pulsation is a response to the transient increase in intracranial blood volume occurring during the cardiac cycle. Arterial inflow showed an early systolic peak about 100 msec after the R wave of the ECG, while venous outflow was almost continuous with only a subtle diastolic flow increase in the internal jugular vein (12). This leads to a transitory systolic increase in blood volume inside the indistensible skull, which must be compensated for by displacement of CSF. It was found that a delay of about 100-200 msec occurred between the arterial pulse wave and the downward flow of CSF in the cervical spinal canal and the cerebral aqueduct (12), and our results showed that there was a delay of about 210 msec between the initial R wave and the downward flow of CSF in the cervical spinal canal. Thus, a downward flow tag was visualized during the fifth phase, when TR was 42 msec.
The oscillatory motion of CSF in the spinal canal has been studied by various means. In the literature, CSF velocity in the cervical spine is reported to range from 0.8 to 3.1 cm/sec (11, 13). The velocity decreases as the CSF descends the spinal axis and changes to 0-2.8 cm/sec in the lumbar area (5, 14). In our experience, maximal velocity in the cervical area of healthy volunteers occurs at the C4-5 level, and this is probably due to the fact that the spinal cord is at its thickest and the subarachnoid space at its narrowest at this level (15). Similarly, the pathologic narrowing of CSF space can cause jet-like CSF propulsion. In the lumbar area, because the spinal cord extended only to the L2 level, leaving a large CSF space, velocity decreased.
For spinal canal compromise and associated flow attenuation or arrest, a variable scale of MR signal reduction was anticipated (16). According to the author's classification of cervical spinal stenosis, low-grade stenosis showed greater velocity at the maximal stenotic segment than at the C1-2 level, as described in another study (16), and it therefore appears that partial canal patency allowed jet-like CSF propulsion. Our results also showed that low-grade stenosis at the C4-5 level involved a jet-like propulsion flow, which can be also be present in healthy volunteers. These increasing velocities at stenotic C4-5 level were not statistically different from those found in healthy volunteers. One previous study suggested that low-grade stenosis merely reflected local flow turbulence and was of little diagnostic value for predicting degrees of stenosis (16). Our results showed that in about half of all low-grade stenosis cases showed wave separation occurred during the systolic phase through the anterior CSF space, suggesting a jet-like flow. If there is sufficient space for flow tags in the posterior CSF space, the phenomenon of flow separation can also be seen, as in this study. Intermediate- and high-grade stenosis, on the other hand, did not demonstrate this phenomenon. Flow separation is, therefore, of some diagnostic value for predicting degrees of stenosis, and helps provide an understanding of the hydrodynamic changes undergone by CSF in spinal stenosis.
Intermediate-grade stenosis, defined as involving effacement of the dural sac on the spinal cord, did not reveal 95% confidence for hydrodynamic change of SPAMM stripes. In spite of the effacement between the dural sac and the cord revealed by 1.5-T MRI, the displaced or discontinuous stripes seen in many cases of intermediate-grade stenosis were, therefore, due to the wide range of a dynamic flow, doubtful. One hypothesis is that there was overinterpretation of low-grade stenosis as intermediate-grade. Factors that may cause incorrect grading of stenosis include the truncation artifact (Gibbs phenomenon), chemical shift, movement by the patient, and CSF pulsation artifact (17). On SPAMM, even partial canal patency, which might not be easily depicted on T2-weighted images, allows CSF propulsion to be expressed as subtle displacement or discontinuity of the stripe.
High-grade stenosis attenuated CSF velocity sufficiently for it to become nearly stagnant. In some of our high-grade stenosis cases, lateral canal accentuation of CSF was observed, a finding which may reflect compensatory CSF propulsion through the lateral pathway of CSF between the lateral border of the cord and the dura. Because the transverse diameter of the spinal cord is greater than the anteroposterior diameter (15), the lateral canal of the CSF space would normaly be a minor pathway of CSF flow. To our knowledge, no previous report has described findings relating to CSF flow through the lateral canal. We attempted to detect CSF flow through this canal using coronal SPAMM images, and were able to observe accentuated wave displacement through the canal in some high-grade stenosis cases, but not in healthy volunteers or in cases of low- or intermediate-grade stenosis. In cases of high-grade stenosis involving complete blockage of the anterior and posterior subarachnoid space, the lateral canal may be a major pathway. Coronal SPAMM imaging may, therefore, be helpful for differentiating high-grade stenosis from lower grades.
In our study, there is some discrepancy between grades of stenosis and stripe patterns. Four cases of low-grade stenosis showed a continuous straight band, a discrepancy which might have resulted from overlapping of the dark signals of SPAMM stripes with the posterior marginal osteophytes of vertebral bodies, which showed dark signals in one or two segments. Two cases of high-grade stenosis showed stripe displacement, mimicking the existence of CSF flow, and this might have been influenced by the adjacent flow effect. Possible causes of these errors are the partial volume effect, induced by the selection of 6-mm slice thickness, and the posterolateral directional pathology of spinal stenosis.
In this study, low-grade stenosis showed considerable changes in CSF hydrodynamics; these included increased jet-like stream velocity through the canal and flow separation in approximately half of all cases, reflecting oscillation of jet-stream unrelated to flow turbulence. High-grade spinal stenosis with continuous straight bands could be interpreted as involving complete CSF blockage, while intermediate-grade, with wave discontinuity or displacement, may show minimal CSF canal patency. A continuous straight band indicates severe stenosis, which is a sign of direct attachment between CSF and dura, and hence, a definite sign indicating the need for decompressive surgery such as laminectomy.
In conclusion, clinical application of the SPAMM technique for the evaluation of cervical spinal stenosis was susccesful. The technique is effective for the evaluation of CSF hydrodynamic changes occurring in cervical spinal stenosis.


 XML Download