INTRODUCTION
METHODS
Cell culture
Solutions and drugs
Electrophysiology
Statistical analysis
RESULTS
Concentration-response relationships for blocking of hERG currents by acepromazine
 | Fig. 1Concentration-dependent inhibition of hERG currents by acepromazine.(A) hERG currents were elicited by a 4-sec depolarizing pulse to +20 mV from a holding potential of –80 mV and repolarization to –50 mV for 6 sec to measure the peak tail currents in the absence and presence of acepromazine. The dotted line marks zero current. (B) Normalized hERG tail currents (Itail) to the control were plotted as a function of acepromazine concentration. The experimental data were fitted with a Hill equation. Data were expressed as the means±S.E.M.
|
Voltage-dependent inhibition of hERG currents by acepromazine
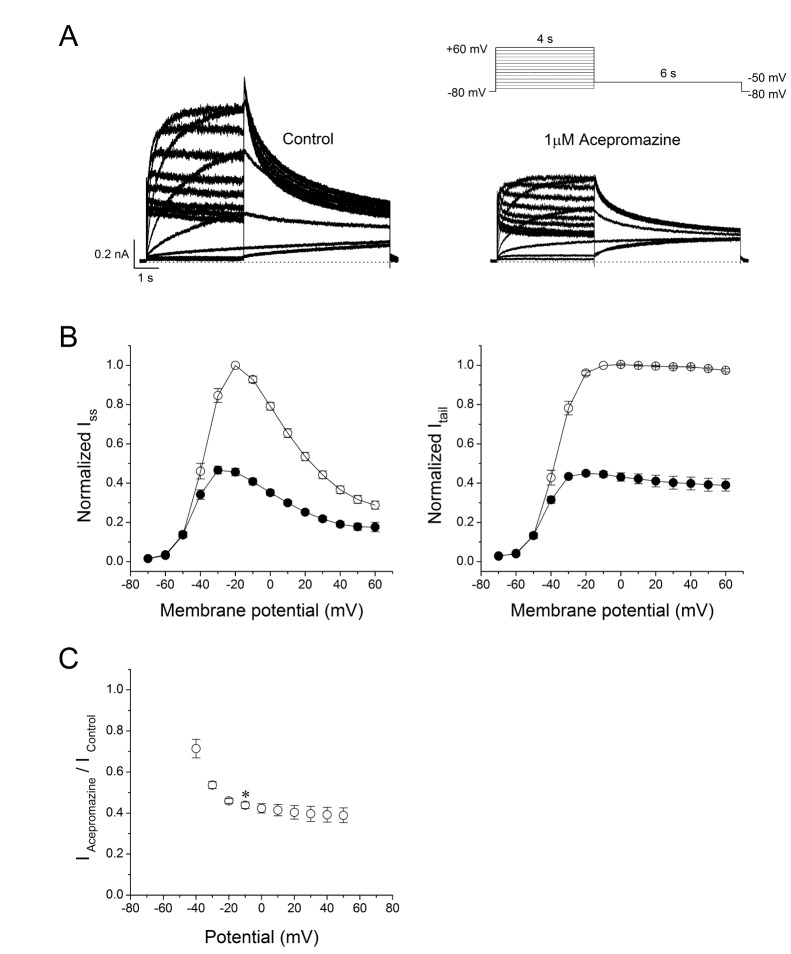
 | Fig. 2Effect of acepromazine on current-voltage (I -V) relationships.(A) Whole-cell hERG currents were evoked by depolarizing pulses from –70 mV to +60 mV for 4 sec in steps of 10 mV every 15 sec from a holding potential of –80 mV and repolarization to –50 mV for 6 sec in the absence and presence of acepromazine (1 µM). (B) The I -V relationships of the steady-state (Iss) and peak tail (Itail) currents of the hERG channels under the control conditions (○) and after the application of acepromazine (●). The Iss and Itail at each voltage in the presence of acepromazine were normalized to those in the absence of acepromazine. Itail data were fitted to a Boltzmann function. (C) The voltage-dependent block of the Itail by acepromazine was expressed as a relative current (IAcepromazine/IControl). *Significant difference from data obtained at –10 mV when compared to –40 mV (p<0.01). Data are expressed as the means±S.E.M.
|
Interaction of acepromazine with both open and inactivated state of hERG channels
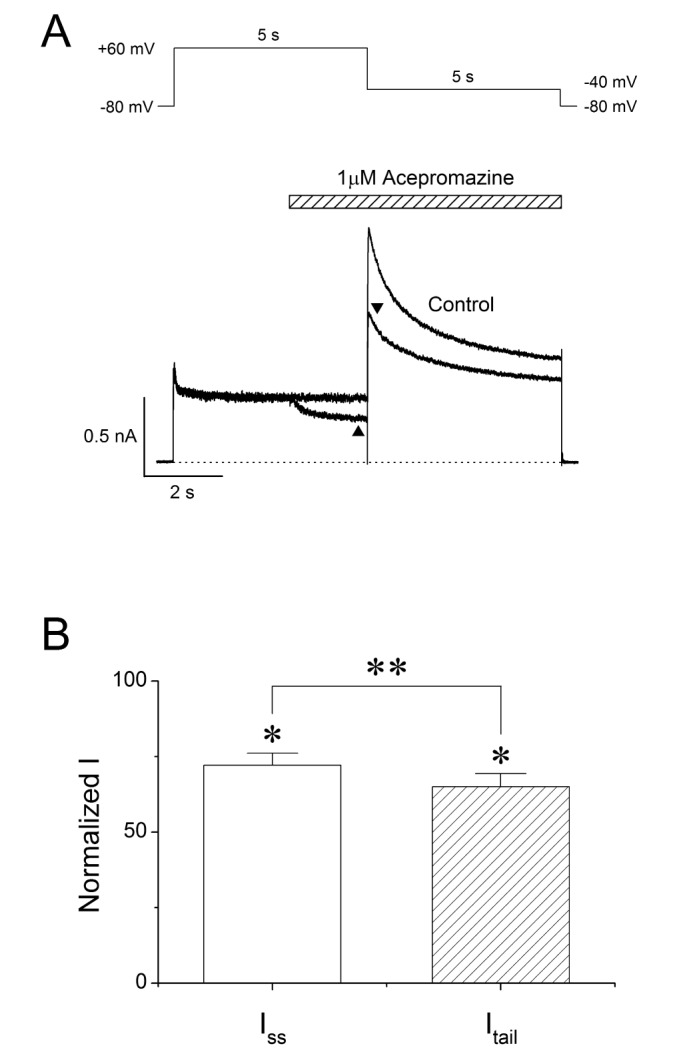
 | Fig. 3Interaction of acepromazine with inactivated and open state of hERG channels. (A) The hERG currents were elicited by 5-sec depolarizing pulse to +60 mV from a holding potential of –80 mV, followed by a repolarizing pulse to –40 mV for 5 sec to induce peak tail currents. Acepromazine (1 µM) was rapidly applied during the depolarizing pulse and continued to the repolarizing pulse as indicated by the hatched bar. The currents were measured at the end of depolarization pulse (▲, Iss) and at the time of peak tail currents (▼, Itail), during the drug application. The dotted line marks zero current. (B) Averaged data showed that the inhibition of Iss and Itail by acepromazine. *p<0.001 when compared to control. **p<0.001 when compared between Iss and Itail. Data are expressed as the means±S.E.M.
|
Open channel block of the hERG currents by acepromazine
 | Fig. 4Concentration-dependent effect of acepromazine on open state hERG channels.(A) The hERG currents were elicited by a 1-sec depolarizing pulse to +60 mV from a holding potential of –80 mV, followed by a repolarizing pulse to –40 mV for 10 sec to evoke peak tail currents. 1 sec after the start of repolarizing pulse, acepromazine was rapidly applied for 5 sec and then removed during the repolarizing pulse by fast drug application system. The bar indicates the time for the application of acepromazine. (B) Graph showed a concentration-response relationship for an open channel block of the hERG current by acepromazine. The normalized currents at the end of the drug application (▲) were plotted for the concentrations of acepromazine. The data were fitted using a Hill equation. Data were expressed as the means±S.E.M.
|
Effect of acepromazine on steady-state inactivation of hERG channels
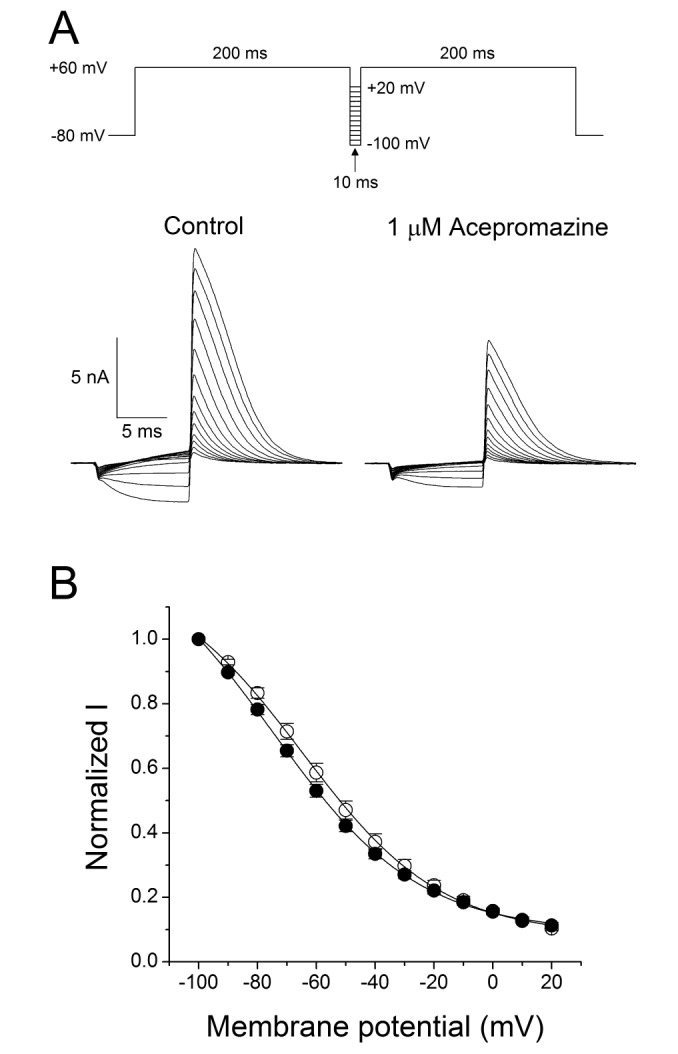
 | Fig. 5Effect of acepromazine on steady-state inactivation of hERG channels.(A) Representative current traces showed the steady-state inactivation under the control conditions and in the presence of 1 µM acepromazine, which were evoked by a double-pulse protocol with steps of inter-stimulus repolarizing pulses. After the first 200-msec depolarizing pulse of +60 mV inducing hERG channel inactivation, 10 msec inter-stimulus step pulses from –100 to +20 mV, with a 10 mV increment were applied, followed by a second depolarizing pulse of +60 mV. (B) Normalized steady-state inactivation curves under control conditions (○) and in the presence of 1 µM acepromazine (●). Solid lines represent fitting with Boltzmann function. Data are expressed as means±S.E.M.
|


 PDF
PDF ePub
ePub Citation
 Print
Print


 XML Download