

 PDF
PDF ePub
ePub Citation
 Print
Print


INTRODUCTION
Naphthoquinones constitute one of the largest and diverse groups of plant secondary metabolites with a broad range of properties. Plumbagin is a naphthoquinone metabolite, 5-hydroxy-2-methyl-1,4-naphthoquinone, found in the plants, Plumbagenaeace, Droseraceae, and Ebenceae families. Plumbagin is generally extracted from the roots of Plumbago species which has been ascribed with medicinal properties in the traditional medicines including the Indian Ayurvedic text. As can be found in a comprehensive review [1], recent scientific studies of plumbagin have demonstrated long list of biological activities; antioxidant, anti-inflammatory, anticancer and antibacterial effects. The potential targets include wide ranges of biological molecules for cell signaling mechanisms; NFkB, Bcl-2, Akt, topoisomerase, STAT-3, NFAT, and MMPs. In vascular diseases, it was reported that plumbagin shows beneficial effects on pulmonary arterial hypertension via STAT-3 inhibition [2].
In contrast to the large number of studies on the anti-cancer and anti-bacterial actions, only a few studies have investigated the pharmacological effects of plumbagin on the contractility of cardiovascular system. According to a previous study of plumbagin showing inhibitory effect on NADPH oxidase 4 (NOX4) [3], a role of NOX4 in the hypoxic pulmonary arterial vasoconstriction (HPV) was suggested based on the inhibition of HPV by plumbagin [4]. In coronary arteries, acetylcholine-induced relaxation was inhibited by plumbagin where NOX4 inhibition was also suggested as a mechanism [5]. In our previous study of skeletal muscle artery, phenylephrine (PhE)-induced partial contraction of deep femoral artery (DFA) perfusing lower limb skeletal muscles, was markedly augmented by plumbagin [6]. In this study, the procontractile mechanism of plumbagin was suggested to involve NOX4 as has been proposed as a target of plumbing in the previous studies [34]. However, considering the wide variety of biological actions of plumbagin, one should be cautious to conclude the pharmacological mechanisms in vessels simply from the previous studies.
In terms of size and mass, skeletal muscle and intestine are the two largest organs in our body. Therefore, changes of skeletal arterial tone would significantly affect systemic blood pressure and perfusion of other organs. In this respect, it would be also important to investigate the effects of plumbagin on the contractility of systemic arteries, specifically under the tonic influence from physiological vasoactive agonists such as alpha-adrenergic neurotransmitter. On these backgrounds, here we conduct dual-wire monograph studies to compare the isometric contractile responses of DFA, mesenteric arteries (MA) and renal arteries (RA) to plumbagin. Also, the plausible signaling mechanisms affected by plumbagin was further investigated in DFA by using pharmacological inhibitors.
Go to : 
METHODS
Experiment animals
Aged matched (8–9 weeks old, 230-260 g) male Sprague-Dawley rats were used for all studies and all experiments were approved by the Institutional Animal Care and Use Committee (IACUC) of Seoul National University (IACUC approval No. SNU-160127-1-2). All animal procedures were performed according to national laws and guidelines. Rats were anesthetized with an injection of pentobarbital sodium (60-100 mg/kg, i.p.). Proximal hind limbs, lungs, and kidneys were dissected in normal Tyrode's (NT) solution for the isolation of deep femoral arteries (DFAs), mesenteric arteries (MAs) and renal arteries (RAs). The NT solution contained 140 mM NaCl, 5.4 mM KCl, 0.33 mM NaH2PO4, 10 mM HEPES, 10 mM Glucose, 1.8 mM CaCl2 and 1 mM MgCl2 and was of pH 7.4 adjusted with NaOH.
Isometric tension measurement
A segment of arteries was mounted on 25 µm tungsten wires in 4 channels multi wire myograph system (620M; DMT, Aarhus, Denmark). For stabilizing arteries, physiological salt solution (PSS) was equilibrated with gas mixture (21% O2, 5% CO2, N2 balance) and maintained at 37℃. The PSS contained 118 mM NaCl, 4 mM KCl, 24 mM NaHCO3, 1 mM MgSO4, 0.44 mM NaH2PO4, 5.6 mM glucose and 1.8 mM CaCl2. Before the experiment, 0.7 g of resting tone was applied, and arteries were stabilized for 15 min in PSS with bubbling. For the normalization of agonist-induced contractile responses, 80 mM KCl-PSS induced contraction (80K contraction) was confirmed in each vessel. To confirm the presence or absence of endothelium, each artery was treated 10 µM acetylcholine (ACh) in the presence of 10 µM phenylephrine (PhE).
Drugs and chemicals
GFX, Go6976 and Go6983 were purchased from Tocris Bioscience (Bristol, UK). All other drugs and chemicals used in this study were obtained from Sigma-Aldrich (St. Louis, MO, USA). Phenylephrine, Acetylcholine, catalase and Y27632 were dissolved in water. DMSO solvent was used in all other drugs included plumbagin. Stock solutions of drugs dissolved in DMSO in the bath never exceeded 0.01%.
Statistical methods
Data are presented as original recordings and normalized to the 80 mM potassium contraction (% 80K). Bar graphs of mean values±SE with number of tested arteries indicated as n. Paired or unpaired Student's t-test was used for statistical analysis.
Go to :
RESULTS
Biphasic augmentation of vasoconstriction by plumbagin
In each vessel, 80 mM KCl-induced tonic contraction (80Kcontraction) was confirmed for the normalization of contractile responses. Cumulative application of plumbagin alone from 0.1 to 10 µM did not change the basal tone of DFA (Fig. 1A, n=5). Pretreatment with 1 µM PhE induced partial contraction (20-30% of 80K-contraction), and additional application of 5 µM plumbagin dramatically increased the tone to levels significantly higher than 80K-contraction (Fig. 1B). The relative strong augmentation of the agonist-induced partial tone by plumbagin (ΔTplum) in DFA was similarly observed when the endothelium was denuded (Fig. 1C). Our previous study shows that 10 µM PhE induces full contraction in the concentration-responses of DFA [6]. Interestingly, even the 10 µM PhE-induced full contraction was further enhanced by plumbagin (Fig. 1D). It was notable that 30K and 80K-contraction was also increased by plumbagin (Fig. 1E, F). The ΔTplum in DFA were reversible by washout. Summary of the above results are normalized to the 80K-contraction measured in shown as bar graphs (Fig. 1G).
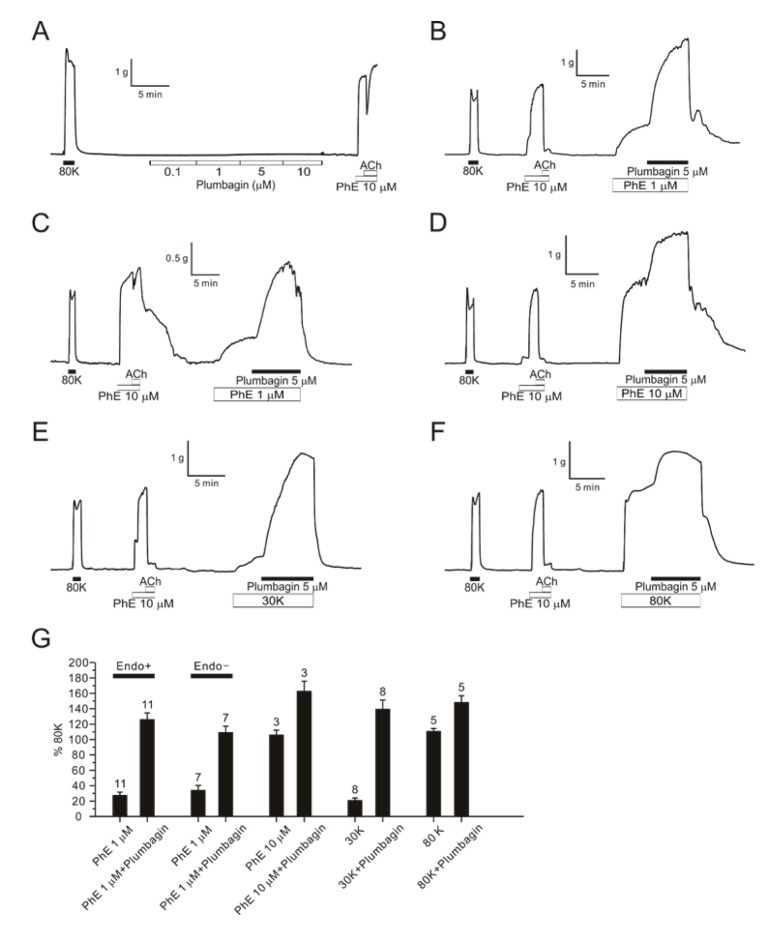 | Fig. 1Augmentation of DFA contractions by PhE and high K+-induced depolarization.An original trace of plumbagin dose response (0.1–10 µM) showing no effect without pretone in DFA (A, n=5). A representative trace of 5 µM plumbagin effect with 1 µM PhE pretone in endothelium intact DFA (B, n=11) and in denuded endothelium DFA (C, n=7). A raw trace of 5 µM plumbagin response in DFA with 10 µM PhE (D, n=3). Representative traces of 5 µM plumbagin in endo-intact DFAs pre-contracted with 30 mM potassium (E, n=8) and 80 mM potassium solution instead of PhE (F, n=5). The summarization of 5 µM plumbagin effect in endo-intact or denuded DFAs with various pretone conditions (G). Numbers of tested vessels are indicated above each bar graph.
|
Then we tested the concentration-dependent effects of plumbagin on DFA contractility. In the presence of 1 µM PhE, different concentrations of plumbagin (0.1, 0.5, 1, 5, 10, 50 µM) were applied for 10-12 min. ΔTplum was observed from 0.1 µM and reached a maximal level at 1 µM (Fig. 2A). From above 5 µM, however, the ΔTplum was not maintained. With 10 or 50 µM plumbagin, the steady-state tone of DFA became lower than the pretone level induced by 1 µM PhE alone (Fig. 2B). The concentration-dependent peak and steady-state levels of ΔTplum normalized to the 80Kcontraction are summarized (Fig. 2C).
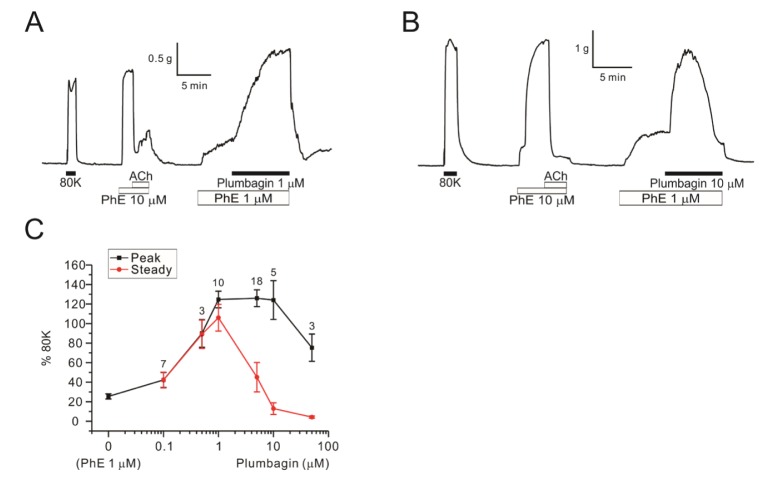 | Fig. 2Concentration-dependent dual effects of plumbagin on PhE-contraction in DFAs.Raw traces of 1 µM plumbagin (A, n=10) and 10 µM plumbagin (B, n=5) in DFAs. Plumbagin concentration response curves (0.1–50 µM) (C). The peak of contraction is indicated black line and steady state value of plumbagin treatment is indicated red line. Numbers of tested vessels are indicated above each symbol of peak response.
|
We also examined the effects of plumbagin on MA and RA. In the rat MA, treatment with plumbagin up to 10 µM alone had no effect on the basal tone (Fig. 3A, n=5). Under the pretreatment with 1 µM PhE, an addition of 1 µM plumbagin induced a transient contraction followed by sustained relaxation down to the basal level (Fig. 3B). The relatively fast transient contraction and subsequent relaxation of MA was consistently observed from 0.1 µM plumbagin (Fig. 3C).
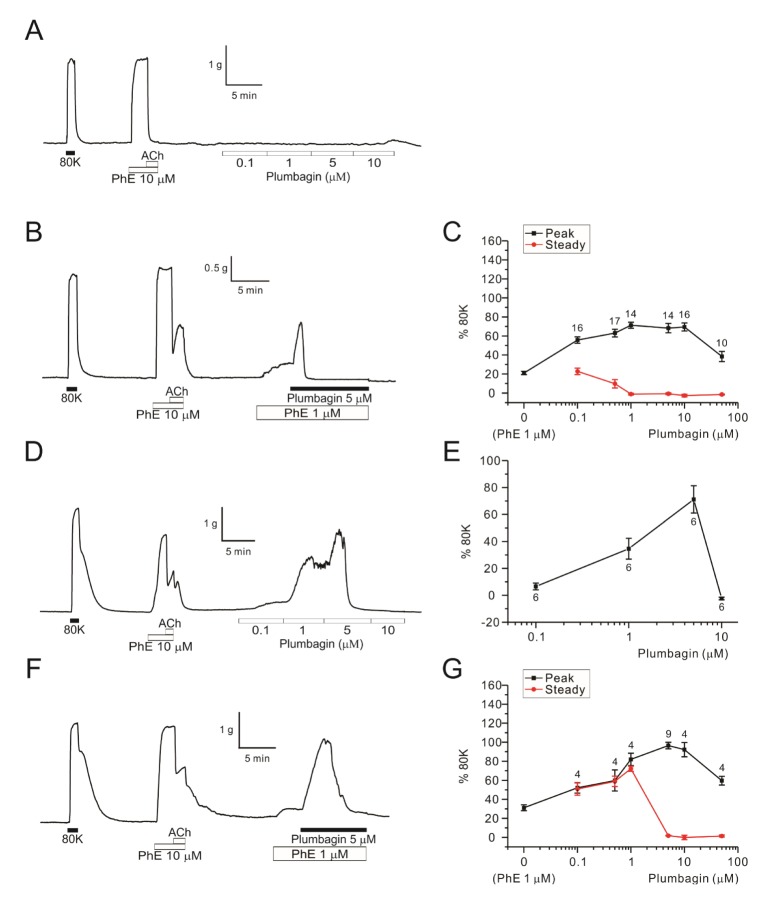 | Fig. 3Concentration-dependent dual effects of plumbagin on MAs and RAs.A raw trace of plumbagin dose response (0.1–10 µM) without PhE-pretone in endothelium-intact MA (A, n=5). A representative data of 5 µM plumbagin effect on MA pretreated with 1 µM PhE (B, n=14). Plumbagin concentration response curves (0.1–50 µM) in the MAs pretreated with 1 µM PhE (C). Peak of plumbagin contraction is indicated black and steady state of plumbagin response is indicated red. Numbers of tested vessels are indicated above each symbol of peak response (C). A representative trace of plumbagin dose response (0.1–10 µM) without PhE-pretone in endo-intact RA (D, n=6). The dose response curve of plumbagin without pretone in RAs (E). A representative data of 5 µM plumbagin with pre-contracted with 1 µM PhE-pretone in endothelium-intact RA (F, n=9). Plumbagin concentration response curves (0.1–50 µM) in RAs pretreated with 1 µM PhE (G). Each point represents mean of separate experiments and n numbers are indicated in the graphs, respectively.
|
In RA, plumbagin alone induced concentration-dependent dual effects on the basal tone; (1) tonic contraction at 0.1 and 1 µM, (2) transient contraction followed by sustained full relaxation at 5 µM (Fig. 3D, E). Similar, but enhanced bi-phasic responses to plumbagin were observed in RA under the pretreatment with 1 µM PhE (Fig. 3F, G). In both MA and RA, the peak ΔTplum were not larger than the 80K-contraction (Fig. 3C, G).
Mechanisms associated with the pro-contractile effects of plumbagin
Since DFA showed relatively consistent and large ΔTplum, we investigated the mechanism of the ΔTplum in the skeletal arteries. To test the hypothesis that a putative NOX4 inhibition is involved with the ΔTplum [6], we applied VAS2870 and GKT137831, recently introduced potent NOX inhibitors [78]. However, the PhE-contraction of DFA was not augmented by the tested NOX inhibitors (Fig. 4A, B). In the presence of VAS2870 or GKT137831, the application of plumbagin still induced large contraction in DFA (Fig. 4A, B). We also confirmed that pretreatment with ROS scavenger (Tiron, 1 mM) or with membrane permeable catalase (PEG-catalase, 353 U/ml) do not affect ΔTplum in DFA. It was notable that the steady-state ΔTplum in the presence of Tiron or PEG catalase was lower than the ΔTplum (Fig. 4C, D).
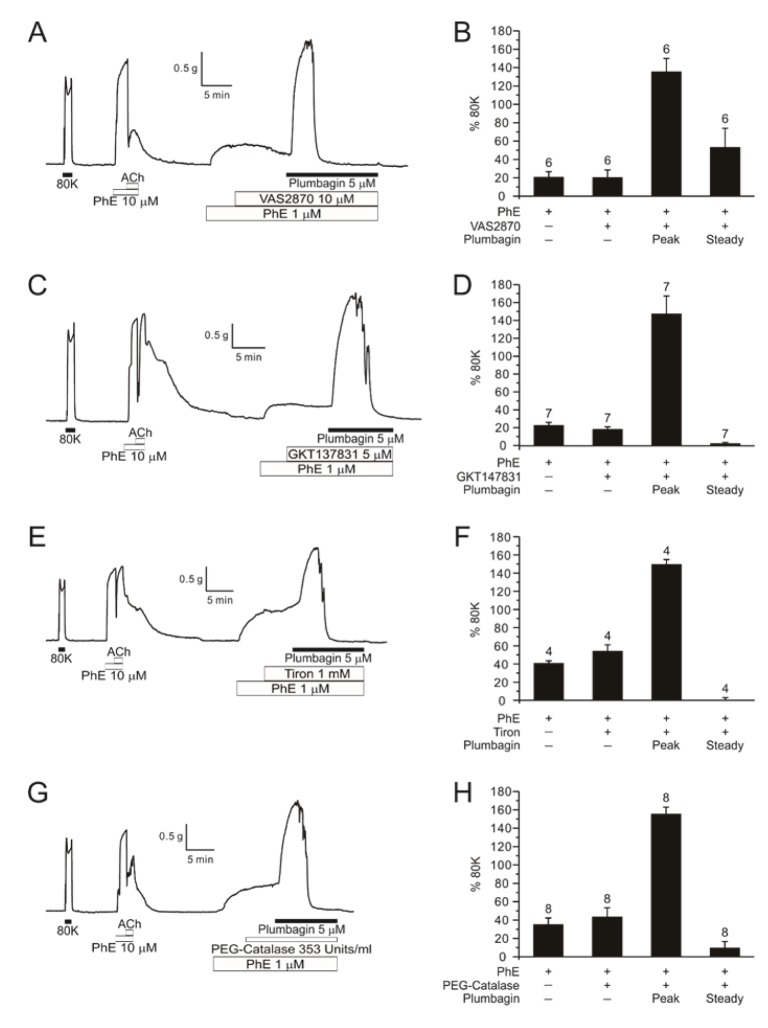 | Fig. 4Effects of NOX inhibitors and ROS scavengers on plumbagin-contraction in PhE-treated DFA.A representative trace of 5 µM plumbagin after pre-treatment of 10 µM VAS2870 (NOX inhibitor) in DFA (A, n=6). A bar graph of normalized PhE, VAS2870, plumbagin and steady state (B). Values represent mean±SE and numbers of tested vessel are indicated above each bar. A representative data of 5 µM plumbagin after pre-treatment of 5 µM GKT137831 (NOX4 inhibitor) in DFA (C, n=7). Summarization of GKT137831 effect (D). Raw traces of 1 mM Tiron (n=4) and 353 Units/ml PEG-catalase (ROS scavengers) effect (n=8) before treatment of 5 µM plumbagin (E, G). Summary of the effects of ROS scavengers on the plumbagin-induced augmentation of PhE-pretone (F, H).
|
L-type voltage-operated Ca2+ channels (VOCCL) are crucial for the Ca2+ influx and excitation-contraction coupling of smooth muscle cells. Consistently, the pretone induced by 1 µM PhE was almost completely abolished by nifedipine, a representative inhibitor of VOCCL. Interestingly, even in the presence of nifedipine, plumbagin induced significant tonic contraction of DFA when pretreated with PhE (Fig. 5A, B). The nifedipine-resistant contraction by plumbagin suggested a Ca2+-sensitizing effect Rho A-dependent kinase (ROK) is an important regulator of contractility, facilitating the myofilament sensitivity to cytoplasmic Ca2+ ([Ca2+]c). Y27632, a representative ROK inhibitor, did not affect ΔTplum (Fig. 5C, D).
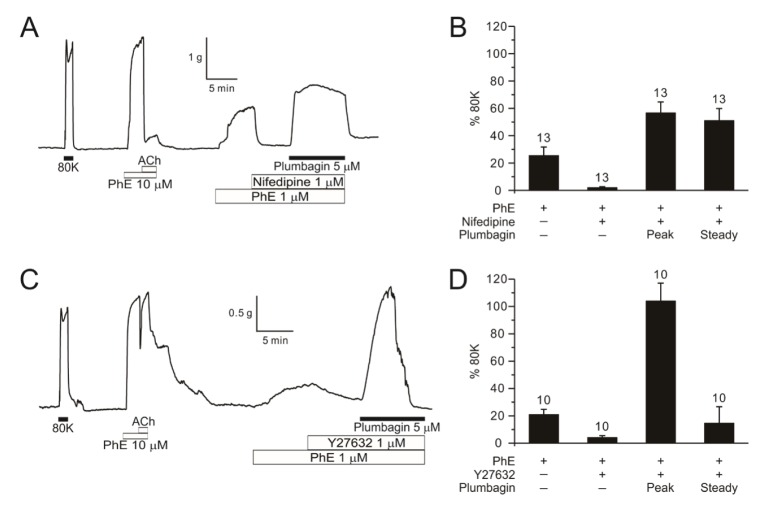 | Fig. 5Effects of calcium channel blocker and ROK inhibitor on plumbagin-contraction in PhE-treated DFA.A representative data of 1 µM nifedipine (calcium channel blocker) effect (n=13) before 5 µM plumbagin (A) and 1 µM Y27632 (Rho kinase inhibitor) effect (n=10) before 5 µM plumbagin in DFA (C). Summary shown as a bar graph (B, D).
|
Protein kinase C (PKC) also increases the [Ca2+]c-sensitivity of smooth muscle via CPI-17 phosphorylation that is a potent inhibitor of myosin phosphatase [9]. A treatment with PKC inhibitor GF109203X (GFX) decreased the peak level of ΔTplum at 1 µM, and largely suppressed at 10 µM (Fig. 6A–C). However, Go6976 (10 and 100 nM) and Go6983 (0.1 and 1 µM) pretreatment did not inhibit ΔTplum (Fig. 6D–G).
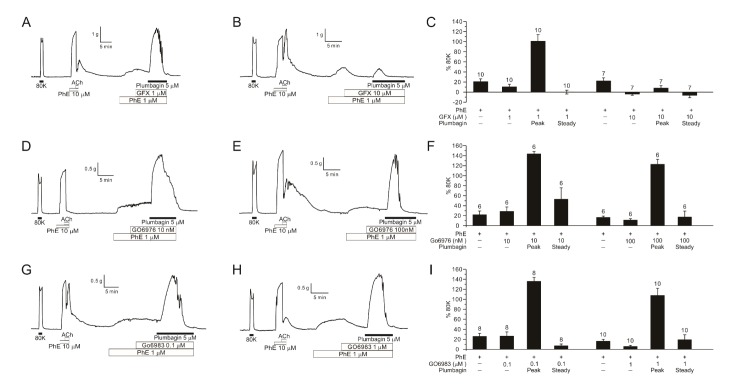 | Fig. 6Effects of PKC inhibitors on plumbagin-contraction in PhE-treated DFA.Representative traces of 1 µM (A, n=10) and 10 µM GFX (B, n=7) pre-treatment in DFAs, showing marked suppression of plumbagin-induced contraction by 10 µM GFX. Bar graphs of normalized contraction values assorted by the concentration of GFX (C). Representative traces of 10 nM (D, n=6) and 100 nM Go6976 (E, n=6) effects on plumbagin-induced contraction in PhE-treated DFA. Bar graphs of normalized contraction values assorted by the concentration of Go6976 (F). Representative traces of 0.1 µM (G, n=8) and 1 µM (H, n=10) Go6983 effects on plumbagin-induced contraction in PhE-treated DFA. Bar graphs of normalized contraction values assorted by the concentration of Go6983 (I). In the bar graphs, numbers of tested vessels are indicated above each bar.
|
Go to :
DISCUSSION
The major finding of this study is that relatively low concentrations of plumbagin (0.1–5 µM) effectively augment the partial contractions induced by vasoactive agonists in various systemic arteries. It was notable that plumbagin alone had no significant effect on the basal tone of DFA and MA (Fig. 1 and 3). Although a previous study by Smith et al (2015) suggested attenuation of endothelium-dependent relaxation (EDR) by plumbagin, the removal of functional endothelium did not affect the ΔTplum of DFA, suggesting a direct effect on smooth muscle (Fig. 1).
Among the tested vessel types, RA showed biphasic contractile responses to plumbagin alone (Fig. 3). At present, we do not have experimental clue to explain the differential responses between RA and the other arteries. We cautiously assume that RA might be under intrinsic stimulation by paracrine vasoactive substances such as perivascular nerve endings. Further investigation is requested to understand the difference between arterial types.
High levels of [K+]e is often used to induce chemical depolarization and arterial contraction as shown in Fig. 1E and F. Because the high K+-induced contraction of DFA was still augmented by plumbagin, we could rule out the inhibition of K+ channels as the pro-contractile mechanism of plumbagin. Furthermore, the pharmacological inhibition of L-type voltage-operated Ca2+ channels could not abolish the ΔTplum of DFA. Because the ΔTplum was observed in the presence of nifedipine, Ca2+ sensitization process was strongly proposed as an underlying mechanism. The pharmacological inhibitor (GFX) effects suggest that the procontractile effect (ΔTplum) appears to be, at least partly, mediated by PKC pathway.
Perplexingly, no previous study showed a direct activation of PKC by plumbagin. On the contrary, an inhibition of PKCε along with other multiple mechanisms has been suggested in the anticancer effects of plumbagin on prostate carcinoma cells [101112]. In this respect, our present study might suggest a new biological target of plumbagin, i.e. activation of PKC in vascular smooth muscle. Another plausible explanation might be that plumbagin indirectly facilitate the partial activation of the PKC stimulated by the vasoactive agonists.
Nevertheless, it has to be mentioned that the GFX inhibition of ΔTplum was not resembled by the other PKC inhibitors, Go6976 and Go6983 (Fig. 6D–I). Because the pharmacological sensitivity is different between the various PKC isoforms [1314], the results might imply a predominant role of a certain isoforms in ΔTplum. Otherwise the inconsistent responses to the pharmacological agents might suggest unknown off-target effects of GFX. Although the importance of PKC in the vascular physiology and pathophysiology is well recognized [1415], further investigation is still required to elucidate the target site and mechanism of ΔTplum.
Another interesting response to plumbagin was the relaxation of tested arteries at relatively higher concentration ranges. Among the tested arteries, the relaxation was more prominent in MA (Fig. 3B, C). The biphasic responses indicate multiple targets of plumbagin in the contractile mechanisms of the tested systemic arteries. Underlying mechanisms of the steady-state relaxation by plumbagin requires separate investigation.
Interestingly, a previous study with guinea-pig heart has demonstrated dual effects of plumbagin on the contractility of atria; initial inotropic effects followed by a contracture. In this study, the inhibition of SERCA, Ca2+-uptake mechanism of ER, was suggested as the major pharmacological mechanism [16]. Although we have not investigated such mechanisms yet, a partial inhibition of SERCA might also have augmented the contractile responses due to the accumulation of Ca2+ in the cytosol.
In conclusion, the present study newly demonstrates the potent augmentation of contractile responses to vasoactive agonists including PhE by plumbagin in systemic arteries. Also, paradoxical relaxation effects are induced with higher concentrations of plumbagin, which are more prominent MA. Since plumbagin and other naphthoquinones are drawing attention as the potential candidates of various diseases including cancer and infection, the present results may imply a critical consideration in terms of the systemic side effects on cardiovascular functions. Further toxicological implication and careful interpretation are requested in the experimental results obtained with plumbagin.
Go to :
 XML Download