

 PDF
PDF ePub
ePub Citation
 Print
Print


INTRODUCTION
Glioblastoma multiforme (GBM) is the most common primary intracranial tumor in adults [12]. Because patients with GBM have a poor prognosis with a 5-year survival rate of 5% under optimal treatments, GBM is considered to be the most malignant glial tumor [3]. Common features of GBM include invasion into surrounding normal brain tissues, accelerated proliferation, the presence of necrosis, and high degree of infiltration of diverse immune cells, including microglia, microphages, and lymphocytes [45]. These remarkable features are believed to generate a GBM-specific tumor microenvironment (TME), which plays a crucial role in tumor progression, immune escape, local invasion, and metastasis of GBM [678].
The tumor and its surrounding microenvironment are closely related and interact constantly [9]. During the stages of tumor progression, a hypoxic TME or pro-oxidant-enriched TME is formed; these TMEs have both beneficial and harmful effects on tumor cells and their niche. The TME is characterized by low levels of glucose and amino acids, acidosis, and hypoxia [1011]. A large tumor mass often produces a hypoxic TME, which is an important and common denominator of the complex metabolic changes and differentiation of cancer cells, leading to increased metastasis, invasion of cancer cells, and patient mortality [12]. A high degree of infiltration of diverse immune and inflammatory cells into tumor tissues contributes to the development of a pro-oxidant enriched TME. Reactive oxygen species (ROS) are known to mediate cancer cell invasion and metastasis by inducing Met overexpression, Matrix metalloproteinases (MMPs) secretion, and invadopodia formation [13]. Invasion of cancer cells into adjacent normal brain tissues and infiltration of immune cells into tumor tissues, which are important key features of GBM, are believed to be caused by interactions between the TME and cancer cells [45].
Chemokines are important mediators of the TME that regulate invasion and metastasis of cancer cells and infiltrated immune cells in diverse malignant tumors [1415]. Chemokines are a large group of small chemotactic proteins that guide cell migration, control cells of the immune system, and promote angiogenesis. Chemokines are classified into 4 highly conserved groups (C, CC, CXC, and CX3C) based on the position of the first two cysteines adjacent to the amino terminus [16]. Among them, IL-8 acts as an important modulator of melanoma growth by enhancing cancer cell proliferation [17]. In GBM, IL-8 has been implicated in glioma angiogenesis and increased malignancy [18]. IP-10 (CXCL10) stimulation increases ERK1/2 activation, which contributes to the proliferation of GBM cells [19]. Induction of IL-6 is known to enhance proliferation and migration of GBM cells, by activating STAT3 [20].
In the present study, we investigated whether chemokine expression in GBM cells is affected by differential conditions of the TME, such as hypoxic and pro-oxidant-enriched micro-environments. Since the availability of glucose and acidity of the TME are known to modify the metabolic behavior of cancer cells, we also examined the effect of different concentrations of glucose on chemokine expression in either hypoxic or oxidant-enriched microenvironments.
Go to : 
METHODS
Cells
Human astroglioma CRT-MG, U251-MG, and HMO6 human microglial cells were maintained in Dulbecco's modified essential medium (DMEM, WelGENE Inc., Daegu, Korea) with 10% fetal bovine serum (Gibco, Grand Island, NY 14072, USA), 1% penicillin-streptomycin in a humidified 5% CO2 incubator at 37℃.
Enzyme-linked immunosorbent assay (ELISA)
Chemokine levels were measured in the culture supernatants of CRT-MG, U251-MG, and HMO6 in 60-mm culture plates at a final concentration of 9×10⁵ per well. After stabilization, cells were treated with either hydrogen peroxide (H2O2) or cobalt chloride (CoCl2) for 24 h. For low and high glucose conditions, cells were cultured in low glucose DMEM (1,000 mg/L glucose), and high glucose DMEM (4,500 mg/L glucose), respectively. After treatment for 24 h, supernatants were collected, and IL-6, IL-8/CXCL8, and IP-10/CXCL10 concentrations were determined using a sandwich ELISA method with human IL-6 (BioLegend, San Diego, CA, USA), IL-8 (BioLegend), and IP-10 BD OptEIA™ (BD Biosciences, Franklin Lakes, NJ, USA) according to the manufacturer's instructions. The concentration of chemokines in each sample was determined by referencing a standard curve generated using known amounts of IL-6, IL-8, and IP-10.
RNA isolation and RT-PCR
Total cellular RNA was isolated using RNA extract kit (Easy-Blue™, Intron, Gyeonggido, Korea) according to the manufacturer's protocol. cDNA was synthesized from 5 µg of total RNA with reverse transcription and PCR was performed using 1~9 µl cDNA with a thermal cycler (Bio-Rad Laboratories, Hercules, CA, USA). The primer sequences were as follows: GAPDH (glyceraldehyde-3-phosphate-dehydrogenase), forward 5′-GGAGCCAAAAGGGTCATCAT-3′, reverse 5′-GTGATGGCATGGACTGTGGT-3′; IL-6, forward 5′-ATGAACTCCTTCTCCACAAGC-3′, reverse 5′-GTTTTCTGCCAGTGCCTCTTTG-3′; IL-8, forward 5′-CTCCAAACCTTTCCACCCC-3′, reverse 5′-GATTCTTGGATACCACAGAGAATG-3′; IP-10, forward 5′-GTACCTCTCTCTAGAACCGTACG-3′, reverse 5′-GAGATCTTTTAGACCTTTCC-3′.
Co-culture assays of tumor cell with microglia
For indirect co-culture system, 8.0 µm-pore polycarbonate membrane transwell inserts (Corning Inc., Corning, NY, USA) were used. CRT-MG and U251-MG cells were plated on placed on the plastic surface of 24 well-plates (1×10⁵ cells/well), then the HMO6 microglia cells were seeded onto the 8.0 mm microporous membranes of the Transwell insert (5×10⁴ cells/well). On the following day, cells were treated with either H2O2 or CoCl2 for 24 h. For low and high glucose conditions, cells were cultured in low glucose DMEM (1,000 mg/L glucose), and high glucose DMEM (4,500 mg/L glucose), respectively.
Human phosphokinase array
Cells were treated with or without H2O2 for 24 h in either high- or low-glucose medium, and then lysed with array lysis buffer. The protein concentration was quantified using the BCA assay. Cell lysates were applied to the phosphoprotein array following the manufacturer's instructions (Proteome Profiler™ Human Phosphokinase Array kit, R&D Systems). Blocking buffer was incubated with each membrane for 1 h on a rocking platform shaker. Cell lysates were diluted in array buffer and incubated overnight at 4℃. The array was incubated in each reconstituted detection antibody cocktail for 2 h at RT, and then was diluted streptavidin-HRP for 30 min, followed by application of chemiluminescent reagent. Chemiluminescent signals were quantified with the use of the luminescent image analyzer (LAS 3000 imaging system; Fujifilm Corporation, Tokyo, Japan). The phosphokinase activity was measured by the changed spot intensity divided by reference spot intensity, using Image J software (version 1.6.0, U.S. National Institutes of Health).
Statistical analysis
The mean±standard deviation is shown in the bar graphs for the independent experiments, and statistical significance was analyzed by using ANOVA and the Student's t-test with the SPSS software version 23.0 (SPSS Inc., Chicago, IL, USA). A value of p<0.05 was regarded as statistically significant.
Go to :
RESULTS
Effect of CoCl2 on the expression of chemokines in astrocytes and microglia
We initially examined the effect of CoCl2, a mimetic of hypoxia, on the expression of chemokines, such as IL-6, IL-8 (CXCL8), and IP-10 (CXCL10), in the CRT-MG and U251-MG astroglioma cell lines and HMO6 microglia cell line. Cells were either treated with CoCl2 (0.1~1 mM) or not treated for 24 h, and then supernatants and cells were collected and analyzed via ELISA and RT-PCR, respectively. Treatment with CoCl2 (0.5 and 1 mM) resulted in a significant increase in the expression levels of IL-6 and IL-8 in CRT-MG and U251-MG astroglioma cells (Figs. 1A, 1B, 1D, and 1E). The level of IP-10 in CRT-MG increased significantly with 0.5 and 1 mM CoCl2 treatment (Fig. 1C). However, when treated with 1 mM of CoCl2, the level of IP-10 was slightly reduced compared to that in the 0.5 mM CoCl2-treated group. Increased IP-10 expression in U251-MG was found only in the presence of 1 mM of CoCl2 (Fig. 1F). To determine whether CoCl2-induced chemokine expression is a common occurrence in different types of brain glial cells, we performed similar experiments with the HMO6 human microglial cell line. In the presence of 0.1~0.25 mM of CoCl2, the levels of IL-6 and IL-8 in HMO6 increased, while 1 mM CoCl2 treatment significantly reduced expression levels of IL-6 and IL-8 (Figs. 1G and 1H). In contrast to astroglioma cells, the IP-10 expression level was decreased by CoCl2 treatment in a dose-dependent manner in HMO6 (Fig. 1I). To examine the mRNA expression level of CRT-MG, U251-MG and HMO6 cells treated with or without 0.5 mM CoCl2, RT-PCR for IL-6, IL-8 and IP-10 was performed. As shown in the inset to Figs. 1A-1H, CoCl2 induced IL-6/IL-8 chemokine expression in all cell lines.
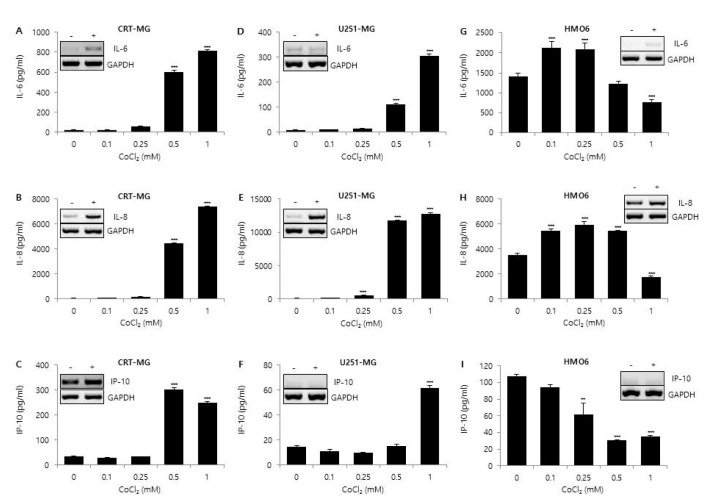 | Fig. 1Effect of CoCl2 on IL-6, IL-8, and IP-10 expression.CRT-MG and U251-MG astroglioma cell lines and HMO6 microglia cells were either treated with the indicated concentrations of CoCl2 or not treated for 24 h. After incubation, supernatants were collected, and the protein levels of chemokines from the culture supernatants were analyzed via ELISA for IL-6 (A, D, G), IL-8 (B, E, H), and IP-10 (C, F, I). Absorbance was measured at 450 nm. (Inset) RT-PCR of CRT-MG, U251-MG and HMO6 cells treated with or without 0.5 mM CoCl2. Data shown are representative of at least three independent experiments. *p<0.05, **p<0.01, ***p<0.001 vs. untreated control.
|
Effect of H2O2 on the expression of chemokines in astrocytes and microglia
To test whether H2O2 has an effect on chemokine expression in glial cells, CRT-MG and U251-MG human astroglioma cells and HMO6 human microglial cells were treated with H2O2 for 24 h. Subsequently, the levels of IL-6, IL-8, and IP-10 were examined via ELISA. H2O2 treatment induced a dose-dependent increase in the expression levels of IL-6, IL-8, and IP-10 up to a concentration of 0.5 mM in CRT-MG and U251-MG cells (Figs. 2A-2F). In microglia HMO6 cells, the expression levels of IL-6 and IL-8 increased in the presence of 0.1~0.25 mM of H2O2 compared with the control (Figs. 2G and 2H). There was a tendency toward a decrease with 0.5 mM of H2O2 compared with 0.1~0.25 mM of H2O2 (Figs. 2G, 2H, and 2I). To examine the mRNA expression level of CRT-MG, U251-MG and HMO6 cells treated with or without 0.5 mM H2O2, RT-PCR was performed. As shown in the inset to Figs. 2A, 2B and 2D, 2E, H2O2 significantly induced IL-6/IL-8 chemokine expression in astroglioma cells, similar to data obtained from ELISA. These results indicate that the stimulation of astroglioma cells by either H2O2 or CoCl2 results in the increase of chemokine release in a dose-dependent manner, whereas high concentrations of H2O2 or CoCl2 reduce chemokine expression in HMO6 microglial cells.
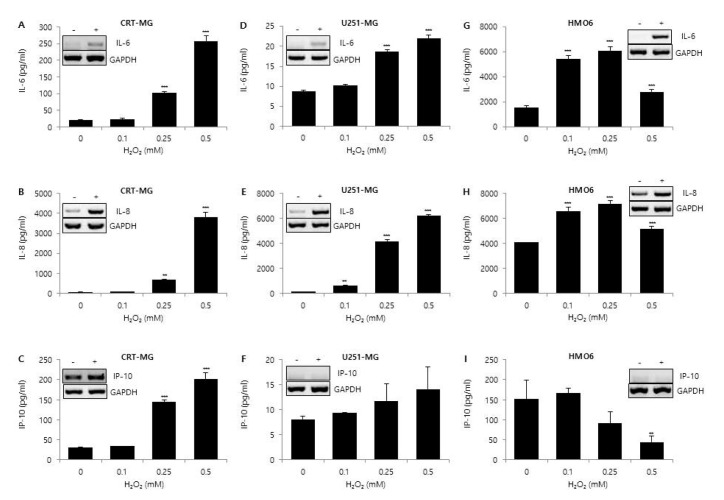 | Fig. 2Effect of H2O2 on IL-6, IL-8, and IP-10 expression.CRT-MG, U251 MG, and HMO6 cells were either treated with the indicated concentrations of H2O2 or not treated for 24 h. After incubation, supernatants were collected, and the protein levels of chemokines from the culture supernatants were analyzed via ELISA for IL-6 (A, D, G), IL-8 (B, E, H), and IP-10 (C, F, I). Absorbance was measured at 450 nm. (Inset) RT-PCR of CRT-MG, U251-MG and HMO6 cells treated with or without 0.5 mM H2O2. Data shown are representative of at least three independent experiments. *p<0.05, **p<0.01, ***p<0.001 vs. untreated control.
|
Effect of low glucose on chemokine expression of CoCl2-treated CRT-MG
High glucose is known to affect the expression pattern of chemokines and cytokines, leading to inflammation and leukocyte activation [21]. To test the effect of glucose concentration on CoCl2-induced expression of proinflammatory chemokines, CRT-MG cells were treated with CoCl2 for 24 h in either high or low glucose medium, and then the supernatants were analyzed via ELISA. In the presence of 0.5~1 mM of CoCl2, the expression levels of IL-6, IL-8, and IP-10 were increased in both high and low glucose media (Fig. 3). IL-8 protein expression level showed a similar pattern of increase in both high and low glucose conditions (Figs. 3B and 3E). Interestingly, the amount of IL-6 and IP-10 protein detected from CRT-MG cultivated in low glucose medium was greater than that from cells cultivated in high glucose medium (Figs. 3D and 3F). These results indicate that low glucose augments further chemokine production in CoCl2-treated CRT-MG compared to high glucose.
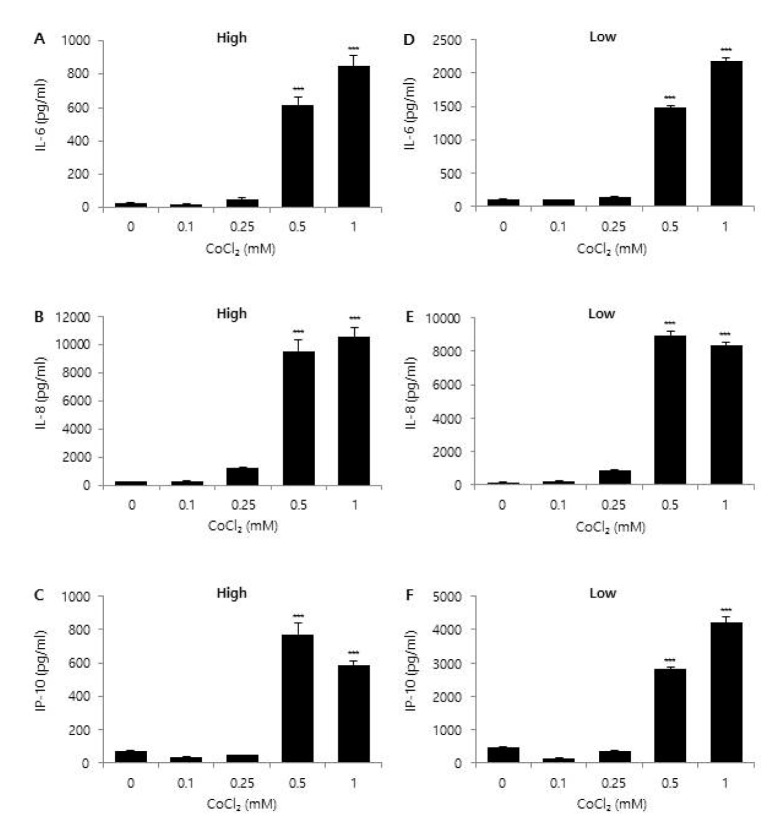 | Fig. 3Effect of glucose concentration on CoCl2-induced chemokine expression.CRT-MG astroglioma cells were cultured in either low (1,000 mg/L) or high (4,500 mg/L) glucose medium with the indicated concentration of CoCl2 for 24 h. After incubation, supernatants were collected and the level of IL-6 (A, D), IL-8 (B, E), and IP-10 (C, F) protein was measured via ELISA. Absorbance was measured at 450 nm. Data shown are representative of at least three experiments. *p<0.05, **p<0.01, ***p<0.001 vs. untreated control.
|
Effect of low glucose on chemokine expression of H2O2-treated CRT-MG
Next, to test whether the low glucose condition has an effect on proinflammatory chemokine expression in H2O2-treated cells, CRT-MG cells were treated with H2O2 at various concentrations (0~0.5 mM) for 24 h under either low or high glucose conditions, and then culture supernatants were analyzed via ELISA. In high glucose medium, treatment with H2O2 induced a dose-dependent increase in the expression levels of IL-6, IL-8, and IP-10 (Figs. 4A-4C), similar to the results shown in Figs. 2A-2C. As shown in Fig. 4D, low glucose levels abrogated the chemokine release of IL-6 in H2O2-treated CRT-MG. IL-8 production in cells grown in low glucose medium was increased in a dose-dependent manner, but to a lesser amount compared to that of cells in high glucose conditions (Fig. 4E). The level of IP-10 was induced by low glucose medium alone; however, treatment with H2O2 and low glucose decreased the expression level of IP-10. To examine the effect of low and high glucose on chemokine expression in response to H2O2 and CoCl2 using co-cultured cells, we next performed indirect co-culture assays. CRT-MG and U251 astroglioma cells were placed on the 24 well-plate, and HMO6 microglia cells were seeded onto the microporous membranes of the transwell insert, and then cells were treated with either 0.5 mM H2O2 or 0.5 mM CoCl2 for 24 h under low and high glucose conditions. After incubation, total RNA from CRT-MG, U251-MG and HMO6 cells were extracted and analyzed by RT-PCR for IL-8. In co-culture condition, HMO6 microglia showed modest, but not significant, increase in mRNA expression of IL-8 by H2O2 and CoCl2 treatment, consistently in both low and high glucose conditions (Fig. 4G, right panel). In CRT-MG astroglioma cells co-cultured with microglia, we found that H2O2-induced IL-8 mRNA expression was significantly decreased by low glucose condition, while CoCl2-induced IL-8 mRNA expression was not affected (Fig. 4G, left panel), similar to results obtained from separate cultured cells (Figs. 3B, 3E, 4B and 4E). On using U251-MG and HMO6 co-cultured cells, we observed findings that were similar to the findings in CRT-MG and HMO6 co-culture as shown in Fig. 4G, showing decreased mRNA expression of IL-8 in H2O2-treated U251-MG cells by low glucose condition. We again observed that the mRNA expression level of IL-8 in HMO6 was not affected by 0.5 mM CoCl2 and H2O2 under either low or high glucose conditions (data not shown). These data suggest that the low glucose condition abrogates a stimulatory effect of H2O2 on the expression of protumorigenic chemokines in CRT-MG cells.
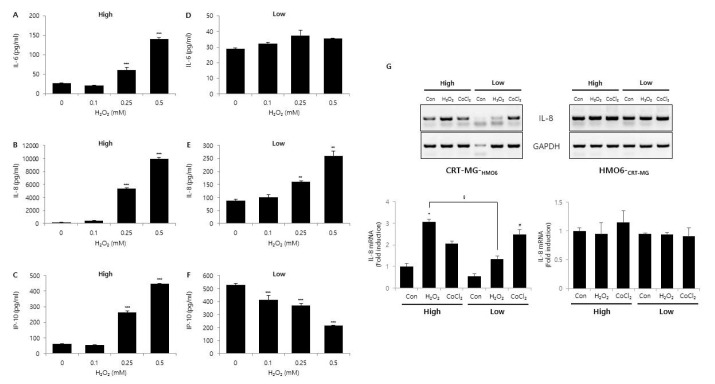 | Fig. 4Effect of glucose concentration on H2O2-induced chemokine expression.CRT-MG cells were cultured in either low or high glucose medium with the indicated concentration of H2O2 for 24 h. After incubation, supernatants were collected, and the level of IL-6 (A, B), IL-8 (C, D), and IP-10 (E, F) protein was measured using ELISA. Absorbance was measured at 450 nm. (G) Indirect co-culture assay. CRT-MG astroglioma cells were placed on the 24 well-plate, and HMO6 microglia cells were seeded onto the microporous membranes of the transwell insert, and then cells were treated with either 0.5 mM H2O2 or 0.5 mM CoCl2 for 24 h under low and high glucose conditions. After incubation, total RNA from CRT-MG and HMO6 cells were extracted and analyzed by RT-PCR for IL-8. Data shown are representative of at least three experiments. *p<0.05, **p<0.01, ***p<0.001 vs. untreated control.
|
Glucose level influences the activation/phosphorylation of signaling molecules in CRT-MG
Since we found that the expression level of chemokines induced by H2O2 treatment was affected by glucose concentration, we next used a phosphokinase array to identify the signaling pathways that are involved in H2O2-induced chemokine expression under either high or low glucose conditions. CRT-MG cells cultured at low or high glucose levels were treated with 0.5 mM of H2O2 for 24 h, and then cell lysates were analyzed via a phosphokinase array. Compared to the array incubated with cell lysates obtained from control CRT-MG cells which were cultured in high glucose medium (Fig. 5A, upper left), the intensity of several spots changed in the arrays incubated with cell lysates from H2O2-treated, and/or low glucose-incubated CRT-MG cells. The protein phosphorylation, including GSK-3α/β, Fyn Y420, PRAS40 T246, P53 S392, and P53 S15, was higher in H2O2-treated CRT-MG cells cultivated in high glucose medium than in those cultured in low glucose medium (Fig. 5B, dashed box, a~e). The phosphorylation of P38α T180/Y182, MSK1/2 S376/S360, c-Jun S63, eNOS S1177, p27 T198, PLC-γ1 Y783, and PYK2 Y402 was increased both in H2O2-treated CRT-MG cells cultured in high glucose medium and in control CRT-MG in low glucose medium. However, this increased phosphorylation was not observed in H2O2-treated CRT-MG cells in the low glucose condition (Fig. 5B, solid box, A~G). These data indicate that low glucose level influences the activation/phosphorylation of various signaling molecules, as well as chemokine expression, in H2O2-treated CRT-MG cells.
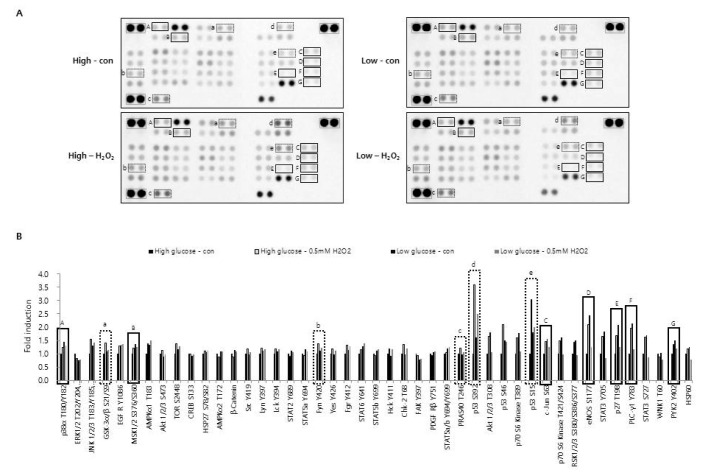 | Fig. 5Effect of H2O2 and glucose concentration on phosphorylation of protein kinases.CRT-MG cells cultured in low (1,000 mg/L) and high (4,500 mg/L) glucose medium were either treated with 0.5 mM of H2O2 or not treated for 24 h. After incubation, cells were lysed on ice for 30 min in lysis buffer, and 430 mg of cell lysate was analyzed for the phosphokinase assay as described in the Methods. (A) The duplicate spots corresponding to reduced phosphorylation of protein kinase in response to H2O2 plus low glucose compared to H2O2 plus high glucose or low glucose alone are highlighted in the solid box (A~G). Increased phosphorylation in response to H2O2 plus high glucose compared to high glucose alone, low glucose alone, or H2O2 plus low glucose is highlighted in the dashed box (a~e). The gray box indicates reference spots. (B) The intensity of spots corresponding to solid and dashed boxes is shown in A. The positive control was quantified using Image J software and subtracted from the background, then expressed as a ratio to the positive control. The ratio of each spot from untreated control cells, cultured in high glucose medium was assigned a value of one.
|
Go to :
DISCUSSION
In this study, we demonstrate that hypoxia, ROS, and differential concentration of glucose influence the expression of cytokines and chemokines, such as IL-6, IL-8, and IP-10, in human glial cell lines. Treatment with CoCl2 and H2O2 significantly increased the expression levels of IL-6, IL-8, and IP-10 in a dose-dependent manner in CRT-MG and U251-MG astroglioma cells, but not in HMO6 microglia cells. Interestingly, low glucose level abrogated the stimulatory effect of H2O2 on the expression of IL-6 and IP-10 in CRT-MG cells. Our results provide evidence that astroglioma and microglia cells exhibit distinct patterns of cytokine and chemokine expression in response to CoCl2 and H2O2 treatment and that different concentrations of glucose differentially regulate the expression level of these chemokines under either hypoxic or oxidant-enriched conditions.
Treatment with CoCl2 and H2O2 significantly increased the level of chemokine expression in a dose-dependent manner in CRT-MG and U251-MG astroglioma cells. When HMO6 cells were incubated under the same conditions, we found that the levels of IL-6 and IL-8 were increased at low concentrations (0.1~0.25 mM) of CoCl2 and H2O2, but decreased at high concentrations (>0.5 mM) of CoCl2 and H2O2. Furthermore, IP-10 production in HMO6 was decreased in response to CoCl2 and H2O2 in a dose-dependent manner. To assess the cytotoxicity of CoCl2 and H2O2 using the CCK-8 assay, we found the viability of astroglioma cells and HMO6 microglia was not affected by 24 h incubation with CoCl2 or H2O2 at a concentration of up to 1 and 0.5 mM, respectively (data not shown). These results indicate that decreased expression of IL-6, IL-8, and IP-10 in microglia in response to higher concentrations of CoCl2 and H2O2 is not due to cell death.
Microglia are believed to function as major players in brain inflammation [22]. In addition to microglia, astrocytes are also thought to actively participate in the process of neuroinflammation [23]. Although the pathogenic mechanism of astrocytes has not been fully elucidated, it is commonly accepted that astrocytes exert a modulatory effect on brain inflammation and neurodegenerative disorders by inducing a variety of biological processes, including neuroprotection, glial scar formation and CNS inflammation [24]. Acute inflammation in the brain is typically characterized by rapid activation of microglia; however, various cell types in the brain such as microglia, astrocytes, endothelial cells, and other glial cells produce cytokines and chemokines. These cytokines and chemokines can have both beneficial and detrimental effects in brain injury and disease, depending on the amount and duration of their release [25]. In this study, we demonstrate for the first time the evidence that different concentrations of glucose differentially regulate the expression level of these chemokines and activation of kinases under either hypoxic or oxidant-enriched conditions. Although the precise molecular mechanisms for mechanical link between the reduced activation of kinases and the resultant decrease in H2O2-induced chemokine production in low glucose condition are largely unknown, our data support the notion that low glucose level influences the activation/phosphorylation of various signaling molecules, as well as chemokine expression, in astroglioma cells which actively participate in the establishment of tumor microenvironment. It is important to understand the cellular mechanisms underlying tumor microenvironment of glioblastoma for improving prognosis for patients and developing improved therapy as a therapeutic target in the future.
Astrocytes and glioblastoma cells secrete IL-8 in response to several stimuli, including LPS, IL-1β, TNF-α, ischemia, and hypoxia [26]. In our system, treatment with CoCl2 and H2O2 resulted in a significant increase in the expression of IL-8 in CRT-MG and U251-MG astroglioma cells (Figs. 1 and 2). Moreover, compared to other cytokines, the expression level of IL-8 remained relatively similar in cells cultured with both low and high concentrations of glucose (Figs. 3 and 4). Previously, IL-8 has been implicated in glioma angiogenesis and increased malignancy in GBM [18]. In addition, IL-8 acts as an important modulator of melanoma growth by enhancing cancer cell proliferation [17]. In addition to IL-8, various cytokines and chemokines have been reported to be secreted by astrocytes and GBM. IP-10 (CXCL10) induces ERK1/2 activation and contributes to the proliferation of GBM cells [19]. Induction of IL-6 is known to enhance cell proliferation and migration in GBM cells, through STAT3 activation [20]. In addition, CCL2 triggers migration and invasion of GBM cells and exerts paracrine effects on the microenvironment of GBM by stimulating migration of astroglial cells [27]. Overexpression of CXCL3 and CXCL10 in GBM plays an important role in tumor growth and progression [28]. The CXCL12-CXCR4/R7 system plays a central role in tumor development and tumor cell proliferation via an autocrine/paracrine mechanism and contributes to the dissemination and invasiveness of several human cancers, including pancreatic, colon, ovarian, prostate, breast, renal carcinomas, lymphoma, melanoma, neuroblastoma, and GBM [29]. In this paper, we have examined the expression of these three chemokines, but it is necessary to confirm the effect of hypoxia, ROS, and differential concentration of glucose on the expression of other chemokines in the future.
High glucose is known to affect the expression pattern of chemokines and cytokines, leading to inflammation and leukocyte activation [21]. Moreover, an abundance of glucose is known to modify the metabolic behavior of cancer cells [30]. These results suggest that glucose concentration may have different effects on various TMEs, such as a hypoxic or pro-oxidant-enriched microenvironment. In this study, we examined the effect of different concentrations of glucose on chemokine and cytokine expression under either hypoxic or oxidant-enriched conditions, and found that different concentrations of glucose influenced the expression patterns of IL-6, IL-8, and IP-10 following CoCl2 and H2O2 exposure. As shown in Fig. 5, low glucose condition influenced and reduced the activation/phosphorylation of various signaling molecules as well as chemokine expression in H2O2-treated CRT-MG cells. Under the oxidant-enriched condition, no effect of low glucose on induction of chemokine expression was observed, whereas the CoCl2-induced hypoxic condition and low concentration of glucose showed synergistic effects on chemokine expression, at least for IL-6, IL-8, and IP-10 in CRT-MG cells (Figs. 3 and 4). Collectively, these data suggest that low glucose level may abrogate the stimulatory effect of H2O2 on the expression of protumorigenic cytokines and chemokines in glioblastoma cells. The data also suggest that low glucose conditions may have different consequences when combined with other conditions in GBM.
Here, we examined the effect of CoCl2, a mimetic of hypoxia, and H2O2 on the expression of chemokines such as IL-6, IL-8, and IP-10 in CRT-MG and U251-MG astroglioma cell lines and HMO6 microglia cell line. We show that astroglioma cells and microglia exhibit distinct patterns of cytokine and chemokine expression in response to CoCl2 and H2O2 treatment, and different concentrations of glucose influence IL-6, IL-8, and IP-10 expression under either hypoxic or oxidant-enriched conditions. Interestingly, our results demonstrate that low glucose condition abrogated the stimulatory effect of H2O2 on the chemokine expression in astroglioma cells, but not in HMO6 microglia cells. These results suggest that microglia consistently secrete these chemokines in response to varied conditions of tumor microenvironment, compared to GBM cells; however, astroglioma cells could act as major players in GBM tumor microenvironment through producing more chemokines than microglia in response to some stimuli.
Go to :
 XML Download