

 PDF
PDF ePub
ePub Citation
 Print
Print


INTRODUCTION
Type 2 diabetes mellitus (T2DM) is one of the main risk factors of cerebral vascular disease and neuropathy [1]. Diabetic cerebrovascular disease involves hemorrhagic cerebrovascular disease and ischemic cerebrovascular disease (approximately 80%) [2]. Cerebral ischemia-reperfusion injury includes a series of complex pathophysiologic processes, including over-expression of free radicals, enhancement of oxidative stress reaction, immune inflammatory injuries, calcium deregulation, and the initiation of the apoptosis gene. These processes are interrelated and interact on each other, and eventually lead to irreversible damage [34] of the brain tissue. But the underlying mechanisms are not yet well understood.
The key to therapy of cerebral ischemia injury is to restore the blood flow immediately, save the dying neurons, and promote nerve functional restoration after ischemic injury. At present, thrombolytic therapy is commonly used in clinical settings. However, owing to the short therapeutic window (usually 3 h) and low therapeutic rate (only 2 to 5% of patients), the method is severely limited [3]. Therefore, it has become an important subject in this area to find new treatments and neuroprotective drugs that are safe, effective, and with fewer side effects.
The glucagon-like peptide-1 amide (GLP-1) is a member of the incretin peptide hormone and it's bioactive amino acid sequence is GLP-1 (7-36). GLP-1 and its analogs facilitate glucose-induced insulin secretion by activating the GLP-1 receptor (GLP-1R) [56789], which is widely expressed in the pancreas, heart, and central nervous system (CNS). GLP-1 can activate several signal pathways to stimulate β-cell proliferation and inhibit β-cell apoptosis [10111213] as well as regulate oxidative stress by inducing the expression and subcellular localization of Nrf2 [1415] and can also protects cardiomyocytes via the PI3K signaling pathway [16]. It has been reported recently that GLP-1 receptor agonists (Exendin-4 / liraglutide) have neuroprotective effect on cerebral ischemia models [17181920], they could reduce tissue stress injury and reduce brain infarction volume, possibly through anti-oxidative effects and anti-apoptotic effects; as such, they may have a favorable therapeutic effect on central neuropathies such as Parkinson's disease and ischemic stroke.
The recombinant human GLP-1 (7-36) (rhGLP-1 (7-36)) is the complete amino acid sequence of GLP-1 (7-36)-NH2 without amidation in the C terminal. RhGLP-1 (7-36) is more homologous to humans than other GLP-1 receptor agonists such as exenatide and liraglutide [2122]. Moreover, GLP-1 may cause speculations of asymptomatic pancreatitis as a side effect to incretin therapy [2324], but rhGLP-1 (7-36) is short-acting and the effect can be stopped more timely than long-acting GLP-1 receptor agonists when adverse events happened. Our laboratory has consistently investigated the neuroprotective effects of rhGLP-1 (7-36) and demonstrated that a single administration of rhGLP-1 (7-36) has a beneficial effect on brain ischemia/reperfusion damage in diabetic rats by up-regulating the expression of antioxidant enzymes such as SOD, reducing the content of lipid peroxide such as MDA, and decreasing the infarction volume [25]. However, the exact mechanisms remain unclear. Furthermore, the drug was administered prophylactically, in other words, it was administered prior to ischemia/reperfusion damage. Thus, the aim of this study was to investigate the brain protective effect and the exact mechanisms of rhGLP-1 (7-36) on diabetic rats when administered after ischemia/reperfusion injury.
Go to : 
METHODS
Animals and high-fat feed
Male specific pathogen free (SPF) Sprague-Dawley rats (120~140 g) obtained from the Animal Center of the Academy of Military Medical Sciences, Beijing, China (certificate No.: SYXK 2011-0010). The animals were housed in SPF grade animal rooms of the experimental animal center of Peking University People's Hospital on a 12 h (light)-12 h (dark) cycle under controlled temperature (22~26℃) and relative humidity (40%~60%). The rats were allowed to acclimate for 1 week, were fed standard food and water ad libitum, and then were fed for five weeks with a high-fat diet. The animals and experimental procedures used were approved by the Animal Care and Use Committee of Peking University People's Hospital (NO: 2013-31). All animal care procedures were in accordance with the CCAC Guide to the Care and Use of Experimental Animals (CCAC 1993) and the Guide for the Care and Use of Laboratory Animals (1996, published by National Academy Press, 2101 Constitution Ave. NW, Washington, DC 20055, USA). The high-fat feed (HFD) was purchased from Beijing Macao cooperation Feed Co. Ltd. The composition of 1 kg HFD were as follows: standard flour 508.9 g; lard, 200 g; egg yolk flour, 150 g; sucrose, 80 g; casein, 40 g; calcium carbonate, 8 g; mountain flour, 5 g; sodium chloride, 3 g; vitamin and mineral mix, 5 g; and cholesterol, 0.1 g. The energy ratio of HFD was 20.27 KJ/g: 56% fat, 15% protein, and 29% carbohydrate.
Chemicals
STZ and TTC were purchased from Sigma-Aldrich Co. (Saint Louis, USA). Lyophilizing rhGLP-1 (7-36) powder, manufactured by Shanghai Huayi Bio-Technology Co., Ltd (Shanghai, China), was diluted in saline. Nimodipine injection was purchased from Byer Schering Pharma AG (Beijing, China). Insulin Aspart 30 Injection was from Novo Nordisk Company. Rabbit anti-rat P-PI3K monoclonal antibody (No: 4228P) and rabbit anti-rat PI3K monoclonal antibody (No: 4257S) were purchased from Cell Signaling. Rabbit anti-rat Nrf2 polyclonal antibody (No: 31163), GAPDH monoclonal antibody (No: 128915), and HRP-Goat Anti rabbit IgG (No: 6721) were purchased from Abcam. Rabbit anti-rat HO-1 monoclonal antibody (No: 2322-1) was purchased from EPITOMICS. The ELISA kits for detecting MDA and SOD were from American BIO-RAD Company.
Diabetic and brain ischemia/reperfusion model
The rats were fed for five weeks with a high-fat diet and then given STZ (30 mg/kg) intraperitoneally. Seven days later, tail vein blood samples were obtained to detect fasting blood glucose (FBG) levels with a blood glucose meter (Accu-chek active) in the morning, and an FBG ≥11.1 mmol/L was diagnosed as diabetic rats [26]. And the rat model of the middle cerebral artery occlusion/reperfusion (MCAO/R, 2/72 h) model was used [27]. First diabetic rats were anaesthetized with 10% chloral hydrate (3 ml/kg body mass, by intraperitoneal injection). Body temperature was maintained at 37±0.5℃ during and shortly after surgery with a heating lamp. Next, the right common carotid artery, internal carotid artery and external carotid artery were exposed surgically. A monofilament nylon thread (0.26~0.30 mm diameter, A4, Beijing Sunbio Biological Technology Co., Ltd.) was used to occlude the middle cerebral artery. The nylon filament was advanced from the external carotid artery into the lumen of the internal carotid artery until a resistance was felt (~20 mm), indicating occlusion of the middle cerebral artery. Then, the carotid artery was ligatured to prevent the nylon line from falling off. Finally, the incision was closed, infiltrated with Anerdian (Lot: 20120604, Shanghai likang disinfection technology co., LTD) for antiseptic post-operative care, and the animal was placed in its cage. Sham-operated rats had the same surgical procedures except that the occluding nylon filament was not inserted. After 2 hours of occlusion, the line was withdrawn and the diabetic rats were reperfused for 72 hours.
Groups
After MCAO 2 h rats were randomly divided into the following 7 treatment groups: 1) NS+Sham (2.5 ml/kg t.i.d., n=12); 2) NS+MCAO/R (2.5 ml/kg t.i.d., n=12); 3) Nimodipine+MCAO/R (0.5 mg/kg q.d., n=12); 4) Insulin+MCAO/R (0~1 IU/kg b.i.d., N =12); 5) rhGLP-1 (7-36)+MCAO/R (10 mg/kg t.i.d, n=12); 6) rhGLP-1 (7-36)+MCAO/R (20 mg/kg t.i.d., n=12); 7) rhGLP-1 (7-36)+MCAO/R (40 mg/kg t.i.d., n=12). Then the rats were injected with the drugs intraperitoneally at the same time of reperfusion and three times each day for the following 72 hours.
Neurological evaluation
Neurological evaluation after animals waking up (ischemia for 2 h) and 72 h of reperfusion was based on a 5-point scale as described by Longa et al. (1989). Scoring was as follows: 0=no deficits; 1=failure to fully extend left forepaw; 2=circling to the left; 3=paresis to the left; 4=no spontaneous walking.
Evaluation of infarct volume by TTC staining
Following neurological score evaluation, rats were sacrificed under anesthetization after 72 h reperfusion. The brains were quickly removed and placed in ice-cold saline for rinsing of the blood, and the olfactory bulb and cerebellum were discarded. Next, the brains were sliced into seven coronal slices of about 2 mm thick by Brain Matrix (1 MM, 170~300 g). Brain slices were immediately stained with a 2% TTC (confected with 0.01 M PBS) solution at 37℃ for 30 min and turned once during intervals of 7~8 min; the normal brain tissue appeared uniform red while the infarcted region showed white. The stained brain sections were stored in 10% formalin and kept at 4℃ for further processing and analysis [28]. Staining images were recorded by a digital camera and quantified analyzed by Image J software. The percentage of total infraction that reflected the degree of cerebral infarction was calculated as the total infarct volumes of seven brain slices/total brain volume ×100%. Total infract volumes were calculated by adding the infarcted areas of seven brain slices and then multiplying by section thickness.
Histopathology
At 72 h after reperfusion, the right-front ischemia brains of the seven groups were fixed with 10% formalin. The half brains were embedded in paraffin wax and cut into longitudinal sections of 5 µm thickness. The sections were stained with H&E for histopathological observation.
Immunohistochemistry
The right-back brains were infiltrated in Tissue OCT-Freeze Medium (Lot: 2998, Sakura) and being quickly frozen at –20℃ and stored at –80℃. Frozen coronal sections were cut at a thickness of 5~6 µm cryostat at –18℃ and collected on glass slides. Frozen sections were first fixed by cold acetone for 10~20 min at –4℃ and rinsed three times in phosphate-buffered saline (PBS). After incubation in 3% hydrogen peroxide for 20 min in dark to block endogenous peroxidase activity, sections were blocked in 5% normal goat serum albumin in PBS for 15 min at 37℃. Slides were incubated at 4℃ overnight with Rabbit anti-rat Nrf2 polyclonal antibody diluted in PBS at 1:50 and then were washed by PBS and incubated with HRP-Goat Anti rabbit IgG secondary antibody (No: 6721, Abcam) diluted in PBS at 1:1 for 40 min at 37℃. A DAB kit (No: K5007, DAKO) was used as a color substrate, stopped under running water. Sections were counterstained by Harris hematoxylin for about 3 min and then rinsed with tap water. Sections were dehydrated using graded ethanol, rinsed in water and transparentized by Xylene, and then the slides were sealed with neutral gum. The immunohistochemical images were analyzed by Image pro-plus 6.0 software by randomly-selected three visible horizons (at 400 x) in cortex area to take pictures of each slice of every group. We selected the same brown yellow as the uniform standard for all positive images and counted the percentage of nuclear positive cells in the positive cells per photo.
Measurement of superoxide dismutase and malondialdehyde
After 72 h of reperfusion, rats were sacrificed and their brains rapidly removed after neurological evaluation; the ischemia cortex was dissected and stored at –80℃ for analysis. Tissue was ground with liquid nitrogen and 10 mg tissue was added to lysis buffer according to 1: 10 (W/V) and a 2 µl cocktail of protease inhibitor. Samples were sonicated for 60s at 0℃, sonicated for 1 s and stopped after 1 s. Next, samples were centrifuged for 30 min (4℃, 14,000 g) and the supernatant was saved at –80℃. The determination of protein concentration in samples was carried out according to the Bradford quantitative reagent kit (500-0006, BIO-RAD). The activity of SOD and the content of MDA were determined using the enzyme-linked immunosorbent assay (ELISA) method.
Western blot analysis
The samples were mixed with 2×Laemmli sample buffer (1:1) and boiled for 3 min. Equal amounts of protein (20 µg) were resolved in 12% SDS-PAGE and electroblotted to nitrocellulose membrane (88018, PIERCE) at 100 V for 70 min at 4℃. The membrane was blocked with 5% (w/v) dry skimmed milk in 1×TBST for 2 h at 37℃. Then, the membranes were incubated with corresponding primary antibodies (P-PI3K 1: 200, PI3K 1:1000, Nrf2 1: 50, HO-1 1: 50, GAPDH 1: 2000) overnight at 4℃, extensively washed with TBST solution, and incubated with the secondary antibody, HRP-Goat Anti rabbit IgG (1: 5000) for 1 h at room temperature. Finally, the blots were rinsed and the peroxidase reaction was developed by chemiluminescence. Blots were stripped in Restore TM plus Western Blot Stripping Buffer (No: SJ-200512, ProMab) and were reported sequentially. The blots were analyzed using Image J software and relative expressions of target proteins were expressed by the optical density ratio of target protein and GAPDH.
Statistical analysis
SPSS 13.0 was used to calculate the variance among groups. Data were presented as means±S.E.M. The intergroup variation was analyzed by one-way analysis of variance (ANOVA) followed by Least Significant Difference test (LSD) when variances were homogeneous or Dunnett's T3 test when variances were not homogeneous. Neurological deficit scores were analyzed by nonparametric statistics with a Mann–Whitney U test. The level of significance used was 0.05 and a p-value of ≤0.05 was considered significant.
Go to :
RESULTS
Effect of rhGLP-1 (7-36) on blood glucose
As shown in the Table 1, there were no statistically differences on levels of blood glucose between the groups prior to occlusion. At 72 h after administration, compared with the Model group, blood glucose levels were reduced with different degrees in the Low-dose, Middle-dose (p<0.01), High-dose (p<0.01) rhGLP-1 (7-36) groups, and the Insulin group (p<0.05). In addition, the Nimodipine group showed no statistical significance (p>0.05). There were no statistical differences between Middle- and High-dose rhGLP-1 (7-36) groups and the Insulin group (p>0.05).
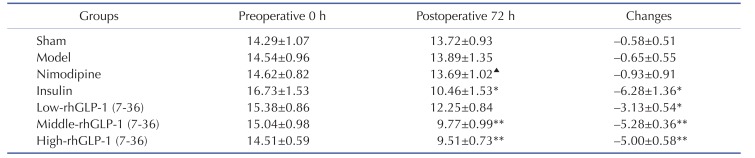
Table 1
Blood glucose (mM) levels and changes in MCAO/R rats in different groups (Mean±S.E.M, n=12)
Tail vein blood samples were obtained to detect FBG levels with a blood glucose meter at preoperative 0 h and 72 h after administration in the morning, rhGLP-1 (7-36) (10, 20, 40 µg/kg ip, tid) and insulin (0~1 IU/kg ip, bid) can significantly reduced blood glucoses compared with the Model group. The intergroup variation was analyzed by ANOVA followed by LSD test. *p<0.05, **p<0.01 vs. Model group; ▴p<0.05 vs. Insulin group.
![]()
Effect of rhGLP-1 (7-36) on neurological deficit scores of MCAO/R diabetic rats
MCAO was performed on the right side and 2 h later, left hind paw paresis was observed then followed by 72 h reperfusion. Neurological deficits were examined and scored on a 5-pointscale. As shown in Fig. 1, at 2 and 72 h after surgery compared with the Sham group, diabetic rats of the model group manifested hemiplegia and the scores increased (p<0.01). At 72 h after treatment, the scores of the Nimodipine group (p<0.05) and the Middle-(p<0.01) and High-dose rhGLP-1 (7-36) (p<0.05) groups were statistically decreased compared to the Model group, the Low-dose rhGLP-1 (7-36) and the Insulin groups showed a tendency to decrease (p>0.05). In rats treated with middle- and high-dose rhGLP-1 (7-36), there were improvements in the neurological deficit similar to that observed in nimodipine treated rats (p>0.05).
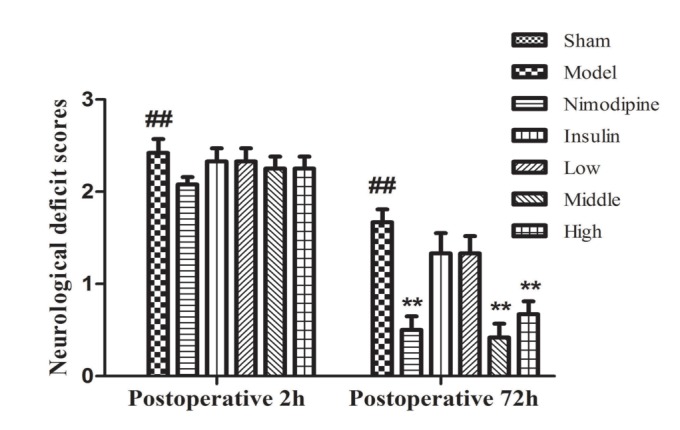 | Fig. 1Neurological deficit scores of MCAO/R rats in different groups.Neurological deficits were scored at 2 h after occlusion and 72 h after administration, rhGLP-1 (7-36) (20, 40 µg/kg ip, tid) and nimodipine (0.5 mg/kg ip, qd) can significantly reduced neurological deficit scores compared with the Model group. Columns represent the Mean±S.E.M (n=12). The intergroup variation was analyzed by nonparametric statistics with a Mann-Whitney U test. ##p<0.01 vs. Sham group; **p<0.01 vs. Model group.
|
Effect of rhGLP-1 (7-36) on the infarction volumes of MCAO/R diabetic rats
As shown in Fig. 2(A), normal brain tissue was deep stained red and the infarcted brain tissue was stained white. As shown in Fig. 2(B), compared with the Sham group, infarction was observed in the Model group (31.25%±2.21%) (p<0.01). The infarction volumes of the Nimodipine group (20.25%±3.94%) (p<0.05) and the Middle-and High-dose rhGLP-1 (7-36) groups (11.91%±3.42%, 17.57%±3.94%, respectively) (p<0.01) were statistically decreased compared to the Model group. The Low-dose rhGLP-1 (7-36) and Insulin groups (25.30%±3.14%, 25.31%±5.21%, respectively) showed a tendency to decrease (p>0.05). The infarction volumes of the Middle- and High-dose rhGLP-1 (7-36) groups were similar to that of the Nimodipine group (p>0.05).
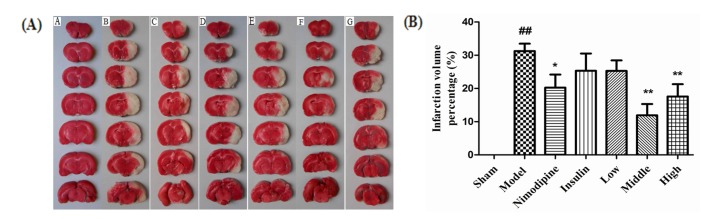 | Fig. 2Effect of rhGLP-1 (7-36) on the infarction volumes of MCAO/R diabetic rats.(A) Typical TTC stained brain slices of MCAO/R rats in different groups. The normal brain tissue is red and the cerebral ischemia and infarction tissues are white (n=6). A, Sham group; B, Model group; C, Nimodipine group; D, Insulin group; E, Low-rhGLP-1 (7-36) group; F, Middle-rhGLP-1 (7-36) group; G, High-rhGLP-1 (7-36) group. (B) Infarction volume percentage of MCAO/R rats in different groups, columns represent the Mean±S.E.M (n=6). Infarction volumes were measured at 72h after administration, rhGLP-1 (7-36) (20, 40 µg/kg ip, tid) and nimodipine (0.5 mg/kg ip, qd) can significantly reduced Infarction volumes compared to the Model group. The intergroup variation was analyzed by ANOVA followed by LSD test. ##p<0.01 vs. Sham group; *p<0.05, **p<0.01 vs. Model group.
|
Effect of rhGLP-1 (7-36) on the pathological changes in the brain
As shown in Fig. 3, compared with the Sham group, cavitation appeared and neurons appeared shrunken and decreased in the infarct core of the Model group. Compared with the Model group, the cavitation in each of the rhGLP-1, the Nimodipine, and the Insulin groups were alleviated, the number of surviving neurons increased and vascular proliferation was enhanced. The pathological changes of the Middle- and High-dose rhGLP-1 (7-36) groups were similar to that of the Nimodipine group.
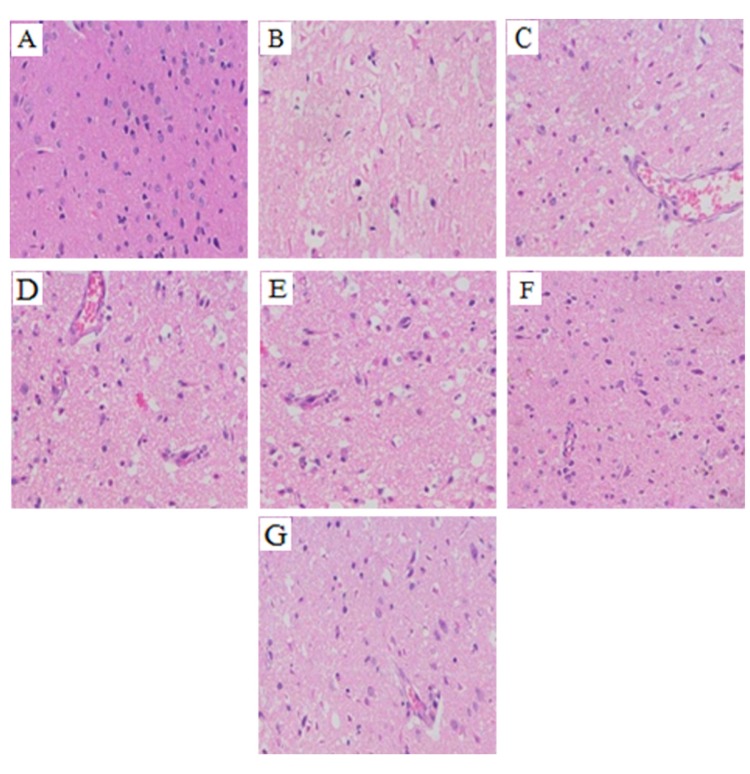 | Fig. 3Summary of typical pathological sections of MCAO/R rats in the different groups (HE, ×200, n=3).At 72 h after administration, compared with the Model group, the cavitation in each of the rhGLP-1, the nimodipine, and the insulin groups were alleviated, the number of surviving neurons increased and vascular proliferation was enhanced. (A) Sham group; (B) Model group; (C) Nimodipine group; (D) Insulin group; (E) Low-rhGLP-1 (7-36) group; (F) Middle-rhGLP-1 (7-36) group; (G) High-rhGLP-1 (7-36) group.
|
Effect of rhGLP-1 (7-36) on the distribution and expression of Nrf2 in the cerebral cortex of the ischemia-reperfusion damage
At 72 h after treatment, as shown in Fig. 4A, Nrf2 of the Sham group was negative or weakly positive expressed in the cytoplasm of the cerebral cortex with no obvious nuclear translocation. The expression of Nrf2 in cytoplasm and nuclear translocation increased in the Model group, and were more obvious after treatment with nimodipine, insulin, and rhGLP-1 (7-36). As shown in Fig. 4B, the Nrf2 nuclear positive cells ratio of the Model group increased compared to the Sham group (p<0.05). The Nrf2 nuclear positive cells ratio of the rhGLP-1 (7-36) groups (p<0.05) and the Insulin group (p<0.05) increased compared to the Model group. In addition, the Nimodipine group showed a tendency to increase (p>0.05). Western blot (Fig. 5) indicate that injury could enhance Nrf2 protein expression (p<0.05). Nimodipine (p<0.05), insulin (p<0.01), and that rhGLP-1 (7-36) (p<0.05) could significantly upregulate the expression of Nrf2 protein; the up-regulated magnitudes of the Middle- and High-dose rhGLP-1 (7-36) groups were most significant (p<0.01).
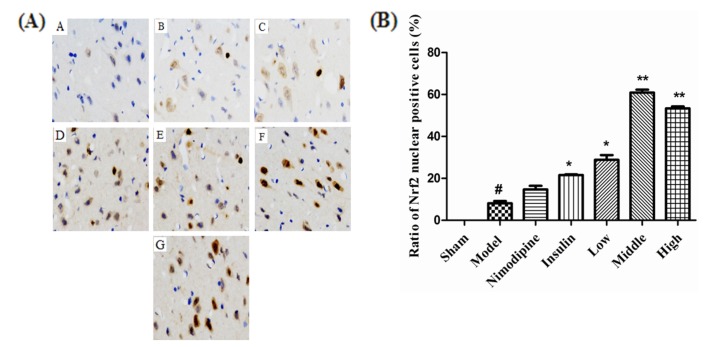 | Fig. 4Effect of rhGLP-1 (7-36) on the distribution and expression of Nrf2 in the cerebral cortex of the ischemia-reperfusion damage.(A) Immunohistochemistry of Nrf2 of MCAO/R rats in different groups (× 400, n=3), brown indicates Nrf2 positive. The expression of Nrf2 in cytoplasm and nuclear translocation increased after treatment with nimodipine, insulin, and rhGLP-1 (7-36). A, Sham group; B, Model group; C, Nimodipine group; D, Insulin group; E, Low-rhGLP-1 (7-36) group; F, Middle-rhGLP-1 (7-36) group; G, High-rhGLP-1 (7-36) group. (B) Ratio of Nrf2 nuclear positive cells of MCAO/R rats in different groups, columns represent the Mean±S.E.M (n=3). The Nrf2 nuclear positive cells ratio significantly increased at 72 h after treated with rhGLP-1 (7-36) (10, 20, 40 µg/kg ip, tid) and insulin (0~1 IU/kg ip, bid) compared to the Model group. The intergroup variation was analyzed by ANOVA followed by Dunnett's T3 test. #p<0.05 vs. Sham group; *p<0.05, **p<0.01 vs. Model group.
|
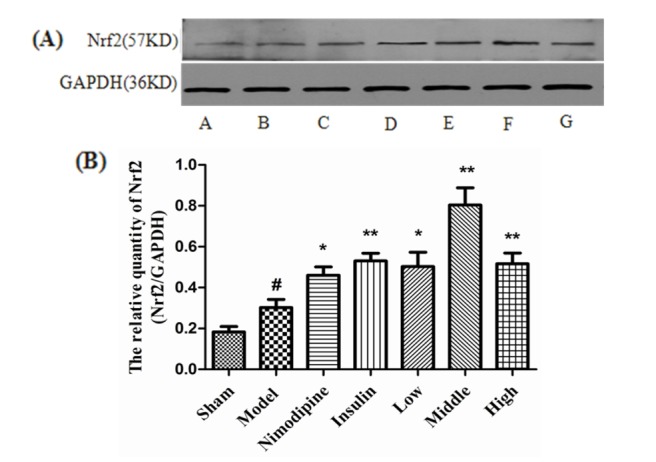 | Fig. 5Nrf2 expression in MCAO/R rats.(A) Expression of Nrf2 protein in MCAO/R rats in different groups (n=4) with GAPDH as a loading control. A, Sham group; B, Model group; C, Nimodipine group; D, Insulin group; E, Low-rhGLP-1 (7-36) group; F, Middle-rhGLP-1 (7-36) group; G, High-rhGLP-1 (7-36) group. (B) Nrf2/GAPDH in different groups (Mean±S.E.M, n=4). At 72 h after administration, compared with the Model group, rhGLP-1 (7-36) (10, 20, 40 µg/kg ip, tid), nimodipine (0.5 mg/kg ip, qd) and insulin (0~1 IU/kg ip, bid) can significantly enhance Nrf2 protein expression. The intergroup variation was analyzed by ANOVA followed by LSD test. #p<0.05 vs. Sham group; *p<0.05, **p<0.01 vs. Model group.
|
Effect of rhGLP-1 (7-36) on the levels of HO-1 expression and P-PI3K/PI3K ratio in the cerebral cortex of the ischemia-reperfusion damage
At 72 h after treatment, as shown in the Fig. 6A and B, HO-1 protein expression was more enhanced in the Model group than the Sham group (p<0.05). Nimodipine, insulin (p<0.01) and rhGLP-1 (7-36) (p<0.05) could significantly upregulate the expression of HO-1 protein compared to the Model group, and the up-regulated magnitude of the Middle-dose rhGLP-1 (7-36) group was most significant (p<0.01). The P-PI3K/PI3K ratio in the Model group decreased compared to the Sham group (p<0.01). RhGLP-1 (7-36) (p<0.05) and insulin (p<0.05) significantly up-regulated the P-PI3K/PI3K ratio compared to the Model group, and the up-regulated increases of the Middle- and High-dose rhGLP-1 (7-36) groups were more significant. There was no statistical difference between the Nimodipine and Model groups (p>0.05) (Fig. 6A and C).
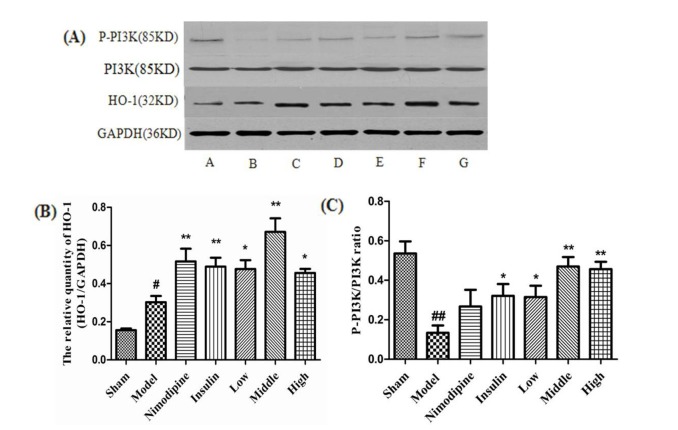 | Fig. 6Effect of rhGLP-1 on the levels of HO-1 expression and P-PI3K/PI3K ratio in the cerebral cortex of the ischemia-reperfusion damage.(A) Expressions of HO-1 and P-PI3K protein in MCAO/R rats in different groups (n=4) with GAPDH as a loading control. A, Sham group; B, Model group; C, Nimodipine group; D, Insulin group; E, Low-rhGLP-1 (7-36) group; F, Middle-rhGLP-1 (7-36) group; G, High-rhGLP-1 (7-36) group. (B) HO-1/GAPDH in different groups (Mean±S.E.M, n=4). At 72 h after administration, compared with the Model group, rhGLP-1 (7-36) (10, 20, 40 µg/kg ip, tid), nimodipine (0.5 mg/kg ip, qd) and insulin (0~1 IU/kg ip, bid) can significantly enhance HO-1 protein expression. The intergroup variation was analyzed by ANOVA followed by LSD test. #p<0.05 vs. Sham group; *p<0.05, **p<0.01 vs. Model group. (C) P-PI3K/PI3K ratio in different groups (Mean±S.E.M, n=4). At 72 h after administration, compared with the Model group, rhGLP-1 (7-36) (10, 20, 40 µg/kg ip, tid) and insulin (0~1 IU/kg ip, bid) can significantly enhance P-PI3K/PI3K ratio. The intergroup variation was analyzed by ANOVA followed by LSD test. ##p<0.01 vs. Sham group; *p<0.05, **p<0.01 vs. Model group.
|
The effect of rhGLP-1 (7-36) on the activities of SOD and the contents of MDA
Cerebral ischemia-reperfusion injury significantly reduced SOD activity (p<0.01) and increased MDA content (p<0.01) compared to the Sham group. Compared with the Control group, treatment with nimodipine (p<0.01), insulin (p<0.05) and low-, middle- and high-dose (p<0.01) rhGLP-1 (7-36) significantly improved the activities of SOD and decrease MDA contents; the changed magnitudes of the middle- and high-dose rhGLP-1 (7-36) were most significant, as shown in Fig. 7.
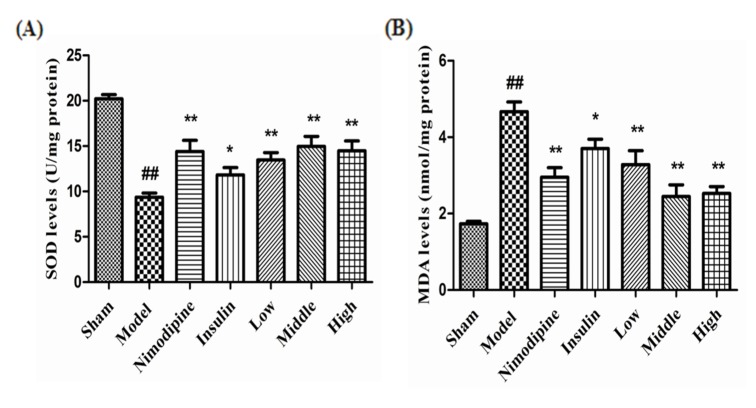 | Fig. 7The effect of rhGLP-1 (7-36) on the activities of SOD and the contents of MDA.(A) SOD activities of MCAO/R rats in different groups. (B) MDA contents of MCAO/R rats in different groups. Columns represent the Mean±S. E.M (n=4). At 72 h after administration, compared with the Model group, rhGLP-1 (7-36) (10, 20, 40 µg/kg ip, tid), nimodipine (0.5 mg/kg ip, qd) and insulin (0~1 IU/kg ip, bid) can significantly improved the activities of SOD and decrease MDA contents. The intergroup variation was analyzed by ANOVA followed by LSD test. ##p<0.01 vs. Sham group, *p<0.05; **p<0.01 vs. Model group.
|
Go to :
DISCUSSION
RhGLP-1 (7-36) is a biosynthetic drug that belongs to the GLP-1 receptor agonist which is mostly used for type 2 diabetes therapy in clinic due to its characteristics of glucose-dependent hypoglycemic effects. The GLP-1 receptor also exists in brain tissue, small molecular GLP-1 receptor agonists can pass through the blood-brain barrier, so the agonists can also play a physiological role [13] against brain damage [29303132]. The most recent research has found that [517] the GLP-1 long agonist (Exendin-4 / liraglutide) could reduce tissue stress damage and cerebral infarction volume. Nimodipine is a member of L-type calcium channel blockers and can inhibit calcium channels when cerebral ischemia reperfusion injury occurs, thereby preventing intracellular calcium overloading of playing a protective role in the brain. In a number of studies on cerebral ischemia reperfusion injury, nimodipine was used as a positive control drug [3334]. Insulin is mainly used to treat diabetes, it is recognized as an effective hypoglycemic drug and usually used as a positive control drug. Some studies have shown that insulin, to a certain extent, has brain protective effects [35].
The doses were set according to the research of Pharmacokinetics of recombined human glucagonlike peptide-1 (7-36) in Chinese healthy volunteers [36]. Our study found that after three days of administration, the rhGLP-1 (7-36) of each group could reduce blood glucose at different degrees. And it could play a role in the brain protection of diabetic rats with cerebral ischemia reperfusion injury, and that the effects of middle- and high-dose rhGLP-1 (7-36) were equivalent to nimodipine; however, the effect of low dose rhGLP-1 (7-36) was not obvious. The brain protective effect of nimodipine was positive, indicating that the design of our research was feasible. And insulin might also plays a role in protecting the brain, however, the effect was not obvious. The reason why the cerebral protective effect of high-dose rhGLP-1 (7-36) was not better than that of a middle dose might be that rhGLP-1 (7-36) activated the GLP-1 receptor in the brain while at the same time significantly activating GLP-1 receptors throughout the body, such as the cardiovascular system, to increase cardiac output and promote blood circulation [9] and increase metabolism to other parts of the body but not in brain tissue. And this problem can be researched further in the future.
The treatment of diabetes complicated with cerebral ischemia-reperfusion injury should combine hypoglycemic drugs with drugs for cerebral ischemia-cerebral injury in a clinical setting. Moreover, adjusting insulin dosage according to the patient's blood glucose levels at any given time often lead to hypoglycemia and exacerbation of the risks of brain ischemia injury [37]. In addition, nimodipine commonly results in hypotension[38]. However, rhGLP-1 (7-36) is a glucose-dependent hypoglycemic drug that requires a fixed dose for each administration [9]. The incidence of adverse reactions is low and it has a brain protection effect. These findings indicate that, in a clinical setting, rhGLP-1 (7-36) has great prospect for the treatment of diabetes combined with cerebral ischemic reperfusion injury in the future.
The Nrf2-ARE system is currently recognized as the major cellular defense mechanism against oxidative stress [39]. It can play a key role in the protection of cerebral ischemia-reperfusion injury [4041], regulating microglial cell kinetics [42], the expression of anti-inflammatory factors [43] and anti-oxidase [44], keeping astrocyte and neuron cells from violation of toxic substances in the brain [4546]. Some kinases such as PKC and PI3K can increased Nrf2/ARE transcription and expression by phosphorylating Nrf2 to promote its separation from Keap1 [47]. Nrf2 expresses in various parts of the body, in a physiological state, Nrf2 exists in the cytoplasm, so under staining, the nucleus shows blue and cytoplasm shows colorless or weakly brown. When Nrf2 is phosphorylated and translocates to the nucleus to up-regulate the expression itself, the nucleus shows brown. The color is deeper, the more nuclear-transfer occurs. Therefore, we detected the total expression of Nrf2 and observed the nuclear staining depth to determine its expression and nuclear transfer. Moreover, it was shown that HO-1 and SOD [5] had a direct impact on the antioxidant capacity against cerebral ischemia-reperfusion damage, mediated mainly by the Nrf2-ARE pathway [484950515253]. Free radicals play an important role in cerebral ischemia reperfusion injury. Many free radicals attack the cell membrane and the organelle by generating lipid peroxide (such as MDA). Scavenging free radicals can reduce the damage to brain tissue.
Research on rats with transient cerebral ischemia-reperfusion damage showed that mRNA and protein levels of Nrf2 is time-dependent in the endogenous antioxidant stress state and began to increase after three hours and reached a peak at 24 hours, declined at 48 to 72 hours, but remained high level [54]. Studies have reported that the Nrf2 gene exists in the ARE sequence. When Nrf2 was activated, Nrf2 could upregulate the synthesis of itself-mRNA [55]. Therefore, the treatment time in our research was set for 72 hours.
Under oxidative stress, pro-nuclear materials change Keap1 constellation to make Nrf2 uncoupling from Keap1, prompting Nrf2 nuclear transfer and endogenous expression increasing, which plays a protective role [56]. That is maybe the reason why Nrf2 nuclear positive cells ration of the model group increased compared to the sham group. RhGLP-1 (7-36) could upregulate the P-PI3K/PI3K ratio and the expression of HO-1, increase the activities of SOD and decreased the contents of MDA in our studies, insulin had the same effect but nimodipine could not upregulate the P-PI3K/PI3K ratio. Nimodipine may enhance expression of Nrf2 by other means, but its mechanism is not the purpose of this study, so there is no in-depth study here. This indicated that rhGLP-1 (7-36) and insulin could activate the expression of PI3K, Nrf2, Ho-1 and increase the activities of SOD against oxidant stress. The effects of brain protection of insulin and low-dose rhGLP-1 (7-36) were not obvious, probably because the dose had not reached the effective dosage for brain protection.
In conclusion, in the dosage used of our study, rhGLP-1 (7-36) had the dual role of hypoglycemic and brain protection for the treatment of diabetic rats combined with cerebral ischemic-reperfusion injury. The effects of middle-and high-doses were equivalent to nimodipine or insulin. The brain protection ability of rhGLP-1 (7-36) was based on a neuroprotective effect mechanism that could increase expression levels of the phase II detoxification enzyme HO-1 and the activities of antioxidant enzyme SOD by activating PI3K to induce the up-regulated expression and nuclear transfer of Nrf2 proteins and by decreasing amounts of MDA.
Go to :
 XML Download