

 PDF
PDF ePub
ePub Citation
 Print
Print


INTRODUCTION
Non-alcoholic fatty liver disease (NAFLD) has become the most prevalent liver disease in parallel with worldwide epidemic of obesity. The annual incidence of NAFLD has been increased, and the prevalence of NAFLD in the general population range from 9 to 35% [12]. Interaction of pathways involved in the development and progression of NAFLD was summarized as “two hits hypothesis” [3]. The first hit is represented by triglycerides (TGs) accumulation in the liver. The second hit of NAFLD, such as inflammatory cytokines, dysfunctional mitochondria, and oxidative stress leads to steatohepatitis and/or fibrosis. Increased reactive oxygen species (ROS) and subsequent imbalance in redox homeostasis may precede liver insulin resistance in mice fed with high fat [4567]. ROS can be generated during normal cell metabolism through various sources, including NAD(P)H oxidase, cytochrome P450 monoxygenases, mitochondria, and peroxisome [8].
Mitochondria and peroxisomes are closely related organelles and play major roles in various hepatic metabolic functions including fatty acid oxidation (FAO) and ROS scavenging, and dysfunction in these organelles is linked to NAFLD [91011]. Peroxisome is an essential organelle for lipid metabolism because it breakdowns fatty acid with carbon chains longer than 22 through β-oxidation and degrade branched-chain fatty acids, which cannot be oxidized in mitochondria. Peroxisomes are also responsible for maintenance of intracellular redox homeostasis. Peroxisomes generate hydrogen peroxide during β-oxidation of fatty acids via Acyl-COA oxidase (ACO) [1213], and various antioxidant defense system exist in the peroxisome [1314].
Catalase is the most prominent antioxidant enzyme in peroxisome and used as a marker of peroxisome function [15]. Catalase decomposes H2O2 to water and molecular oxygen and is abundantly expressed in the liver and kidney [16]. We recently reported that endogenous catalase may play an important role in protecting kidney injury under diabetic stress through maintaining peroxisomal fitness [17]. However, the role of endogenous catalase in high fat diet (HFD)-induced liver injury has not been reported yet.
Given that the expression of catalase and peroxisomes are the most abundant in the liver, it was hypothesized that endogenous catalase would play a protective role in HFD induced liver injury. Considering adaptive response during the initiation of liver steatosis [18], the present study has focused on early liver injury induced by HFD feeding.
METHODS
Animals
Homozygous catalase knock-out (CKO) generated by Ho et al. [19] were utilized, and all animal experiments were approved by Institutional Animal Care and Use Committee (IACUC) at Ewha Womans University (No. 15-062). 8-week-old male CKO mice and age-matched wild-type (WT) C57BL/6J mice were fed with either normal diet (ND) or HFD (Harlan TD06414; 18.4% protein-derived calories, 21.3% carbohydrate-derived calories, and 60.3% fat-derived calories) (Harlan Tecklad 2018S, Indianapolis, IN, USA) for 2 weeks. Mice were divided into three groups (6 mice per group): WT fed with ND (WT), WT fed with HFD (WT-HF), and CKO fed with HFD (CKO-HF). Intraperitoneal glucose tolerance test (IPGTT) was performed to assess glucose intolerance at 2 weeks after HFD feeding. Mice were injected via the inferior vena cava with Humulin®R (5 U/kg, Eli Lilly Indianapolis, IN, USA) for 5 minutes, and then perfused through heart by phosphate buffered saline (PBS, pH 7.4).
Intraperitoneal glucose tolerance test (IPGTT)
IPGTT was performed by intraperitoneal injection of 1 g glucose/kg body weight into mouse fasted for 16 hours. Blood glucose was measured by glucometer (OneTouch Ultra, Johnson & Johnson co., Milpitas, CA, USA) at each time point; 0, 15, 30, 60, 90, 120 min after intraperitoneal administration of glucose.
Measurements of blood parameters
Blood was centrifuged at 3,000 rpm for 15 min at 4℃, and plasma in the supernatant was collected. Plasma alanine aminotransferase (ALT), triglycerides (TG), and total cholesterol (TC) were measured using EnzyChrom™ assay kit (BioAssay Systems, Hayward, CA, USA) according to the manufacturer's recommendation.
Lipid peroxidation (LPO) assay
The extent of oxidative stress in hepatic tissue was determined by measuring lipid hydroperoxides using an LPO assay kit (Cayman Chemical Co, Ann Arbor, MI, USA).
Western blot analysis
The concentration of protein in liver lysates was determined using Bradford methods (Bio-Rad Laboratories, Hercules, CA, USA), and aliquots of tissues was mixed with the sample buffer containing SDS and β-mercaptoethanol and heated at 95℃ for 6 min. Respective samples were then loaded to SDS-PAGE gel and subjected to electrophoresis. The proteins were transferred onto a polyvinylidene fluoride (PVDF) membrane (GE Healthcare BioSciences Co., Piscataway, NJ, USA) in the transblot chamber with Tris buffer. The membrane was blocked for 1 h at room temperature with 5% skim milk in TBS-Tween 20 buffer, followed by an overnight incubation at 4℃ in diluted polyclonal antibodies of p-Akt (Ser 473) (1:2000, Cell Signaling Technology, MA, USA), t-Akt (1:2000, Cell Signaling Technology), β-actin (1:3000, Sigma-Aldrich, St Louis, MO, USA), β-tubulin (1:2000, Santa Cruz Biotechnology, CA, USA), p-GSK-3β (Ser9) (1:2000, Cell Signaling Technology), t-GSK-3β (1:2000, Cell Signaling Technology), and Nitrotyrosine (1:2000, Santa Cruz Biotechnology) Positive immunoreactive bands were quantified using the densitometer (LAS-3000, FUJIFILM Corporation, Tokyo, Japan) and normalized by β-actin or β-tubulin.
Reverse transcription and real-time PCR
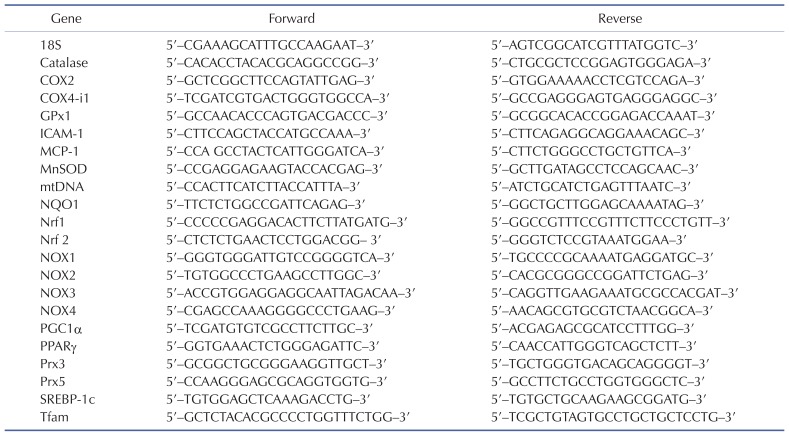
Total RNA was extracted from liver tissues using Trizol (Invitrogen). The expression of mRNAs was assessed by real-time quantitative RT-PCR using SYBR Green PCR Master Mix kit (Applied Biosystems, Foster City, CA, USA) with a Stepone™ real-time PCR system (Applied Biosystems). All reactions were performed in duplicate in a final volume of 20 µl. The quantities of the tested genes and internal control, 18S mRNA were then determined from standard curves using the Applied Biosystems software. The mRNA expression levels of tested genes were normalized to 18S mRNA levels. The primer sequences of each gene are listed in Table 1.
Morphometric and immunohistochemical analysis
Liver tissues were fixed in 10% of formalin, dehydrated, and embedded in paraffin. Five micron sections were used for hematoxylin and eosin (H&E) staining. To determine hepatic steatosis, frozen liver sections were stained with 0.5% Oil red O (Sigma-Aldrich, St Louis, MO, USA). Immunohistochemistry was performed using immunoperoxidase procedures from a commercially available kit (Dako, Glostrup, Denmark). The sections were incubated with anti-8-oxo-dG (1:200, Trevigen, MD, USA), and anti-F4/80 (1:500, Santa Cruz Biotechnology, CA, USA) overnight at 4℃. Sections were photographed using a Zeiss microscope equipped, AxioCamHRC digital camera, and AxioCam software (CarlZeiss, Thornwood, NY, USA).
Statistical analysis
All results are expressed as means±SE. Analysis of variance (ANOVA) was used to assess the differences among multiple groups. If the F statistic was significant, the mean values of each group were compared using Fisher's least significant difference method. p<0.05 indicates statistical significance.
RESULTS
Catalase deficiency accelerates obesity and obesity-related metabolic syndrome in short term HFD-fed mice
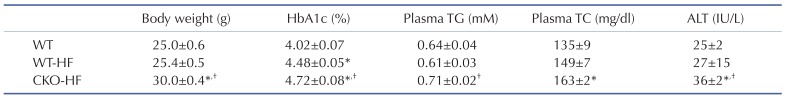
10-week-old male CKO mice exhibited similar body weight, systemic glucose tolerance, and liver insulin signaling compared to age-matched WT mice (Supplementary Fig. 1). Plasma ALT, inflammatory cytokines, and markers of mitochondrial biogenesis mRNA expression were not different between WT and CKO mice at basal (Supplementary Fig. 2). However, CKO mice gained body weight significantly faster than WT mice at early period of HFD feeding. HbA1c levels of WT-HF and CKO-HF mice were increased compared to WT mice, and HbA1c of CKO-HF mice was significantly increased than that of WT-HF mice after HFD feeding for 2 weeks. Plasma TG and TC level were significantly increased only in CKO-HF mice among 3 groups. Furthermore, plasma ALT was significantly increased in CKO-HF mice compared to WT or WT-HF (Table 2). These results demonstrated that catalase deficiency accelerated obesity and obesity-related metabolic syndrome, including liver injury from the early phase of HFD feeding.
Catalase deficiency accelerates short term HFD-induced systemic insulin resistance
At 2 weeks after HFD feeding, the area under the curve (AUC) in response to IPGTT was increased in both WT-HF and CKO-HF mice compared to that of WT mice (Fig. 1A, B). However, fasting plasma insulin level was significantly increased CKO-HF mice compared to WT or WT-HF (Fig. 1C). These results demonstrated that catalase deficiency aggravated HFD-induced systemic insulin resistance from the early phase of HFD-induced metabolic stress.
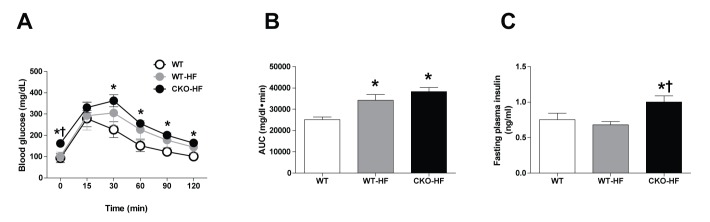
Fig. 1
Catalase deficiency accelerates short term HFD-induced systemic insulin resistance.
(A) IPGTT was performed after 2 weeks on the HFD. (B) Area under the curve (AUC) for IPGTT was calculated using the trapezoidal method. (C) Fasting plasma insulin was measured by blood parameter. Data are shown as mean±SE of 6 mice per group. *p<0.05 vs. WT; †p<0.05 vs. WT-HF.
![]()
Catalase deficiency accelerates early liver lipid accumulation
To examine whether catalase deficiency affects liver lipid accumulation in short term HFD-induced mice, we performed H&E and Oil red O staining (Fig. 2A). Lipid droplets were increased in both WT-HF and CKO-HF mice compared to WT mice. To further investigate the mechanism involved in short term HFD-induced lipid accumulation, mRNA expression of SREBP1c and PPARγ mRNA, which are the major lipogenic transcription factors, was measured. Liver SREBP1c and PPARγ mRNA expression tended to increase in response to HFD, and those gene expressions were significantly increased in CKO-HF mice compared to WT mice (Fig. 2B, C). Those gene expressions in between CKO-HF and WT-HF did not reach the statistical significance.
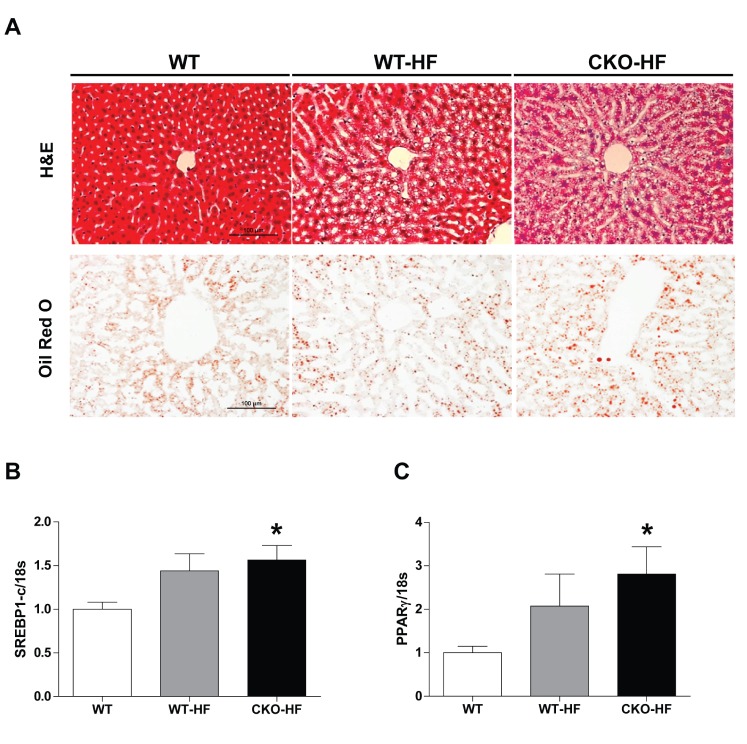
Fig. 2
Catalase deficiency accelerates liver lipid accumulation.
(A) The liver lipids detected by H&E and Oil red O staining. Magnification, 200x; scale bar, 100 µm. (B) mRNA expression of sterol regulatory element binding protein 1c (SREBP1)c and peroxisome proliferator-activated receptor (PPARγ). Data are shown as mean±SE of 6 mice per group. *p<0.05 vs. WT.
![]()
Catalase deficiency accelerates short term HFD-induced liver inflammation
Obesity is associated with chronic low-grade inflammation in NAFLD [20]. Macrophage infiltration estimated by immunostaining of F4/80 was significantly increased in the liver of CKO-HF mice compared to WT mice (Fig. 3A, B). Liver F4/80 mRNA expressions were not significantly different among 3 groups (Data not shown). ICAM-1, but not MCP-1 and COX2 mRNA expression in CKO-HF mice liver was significantly increased compared to WT (Fig. 3C).
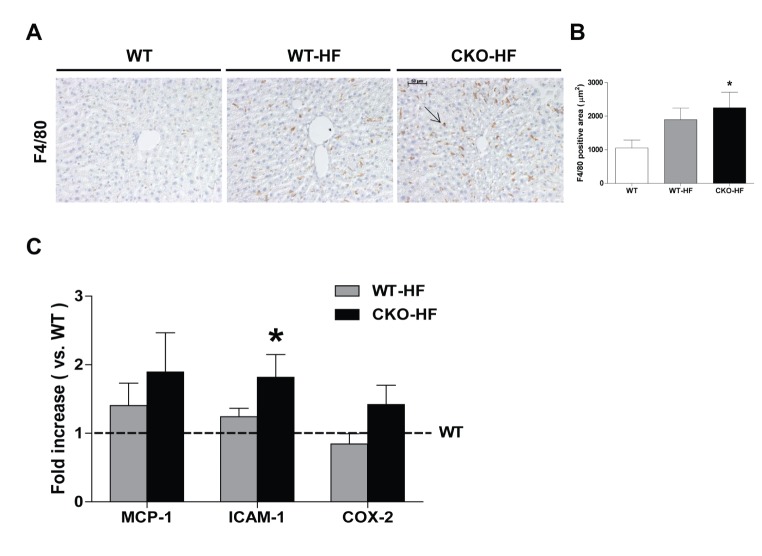
Fig. 3
Catalase deficiency accelerates liver inflammation.
(A and B) Representative immunohistochemistry staining of F4/80 (1:500) and quantification of F4/80 positive area in liver. Magnification, 200x; scale bar, 50 µm. (C) Monocyte chemoattractant protein-1 (MCP-1), intercellular adhesion molecule 1 (ICAM-1), and cyclooxygenase-2 (COX2) were determined by real-time PCR. Data are shown as mean±SE of 6 mice per group. *p<0.05 vs. WT.
![]()
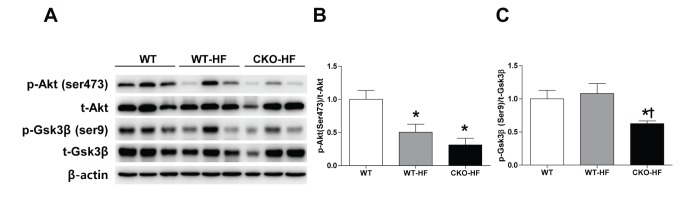
Catalase deficiency accelerates short term HFD-induced liver insulin resistance
Catalase deficiency induced systemic insulin resistance as shown in Fig. 1. To investigate whether liver insulin signaling was also impaired, phosphorylation of Akt (Ser473) and Gsk3β (Ser9) in liver homogenates was measured by western blot. Akt phosphorylation was significantly decreased in both WT-HF and CKO-HF mice (Fig. 4A, B), but Gsk3β phosphorylation was significantly decreased only in CKO-HF mice (Fig. 4A, C).
Catalase deficiency disrupts liver mitochondrial biogenesis
To investigate whether catalase deficiency affects mitochondrial biogenesis during short-term HFD feeding, mRNA expression of mtDNA, Tfam, PGC1α, COX4-i1, and Nrf1 was measured by real-time PCR. PGC1α mRNA expression was significantly decreased in both WT-HF and CKO-HF mice compared to WT mice, and COX4-i1 mRNA expression was significantly decreased only in CKO-HF mice (Fig. 5).
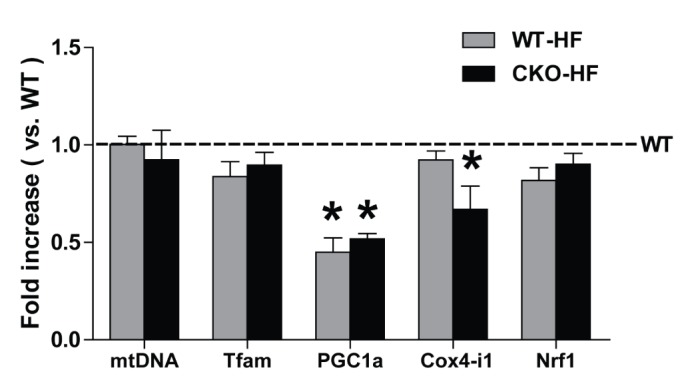
Fig. 5
Catalase deficiency accelerates mitochondrial biogenesis.
Mitochondrial DNA (mtDNA), mitochondrial transcription factor A (Tfam), peroxisome proliferator-activated receptor γ coactivator 1α (PGC-1α), and cytochrome c oxidase subunit 4 isoform 1 (COX4-i1), nuclear respiratory factor 1 (Nrf1) mRNA expressions were measured by real-time PCR as described in methods. Data are shown as mean±SE of 6 mice per group. *p<0.05 vs. WT.
![]()
Catalase deficiency accelerates liver oxidative stress
Then, we measured liver oxidative stress using 8-oxo-dG staining, LPO assay, and assessment protein level of nitrotyrosine. Plasma TBARS, hepatic LPO, and 8-oxo-dG staining were not different between WT and CKO (Supplementary Fig. 3). However, 8-oxo-dG expression and LPO level were increased in both WT-HF and CKO-HF mice compared to WT mice (Fig. 6A, B). Nitrotyrosine was significantly increased only in CKO-HF mice (Fig. 6C, D). NOX 1, 2, 3, and 4 mRNA expressions were not significantly changed either in WT-HF or CKO-HF group compared to WT group (Fig. 6E).
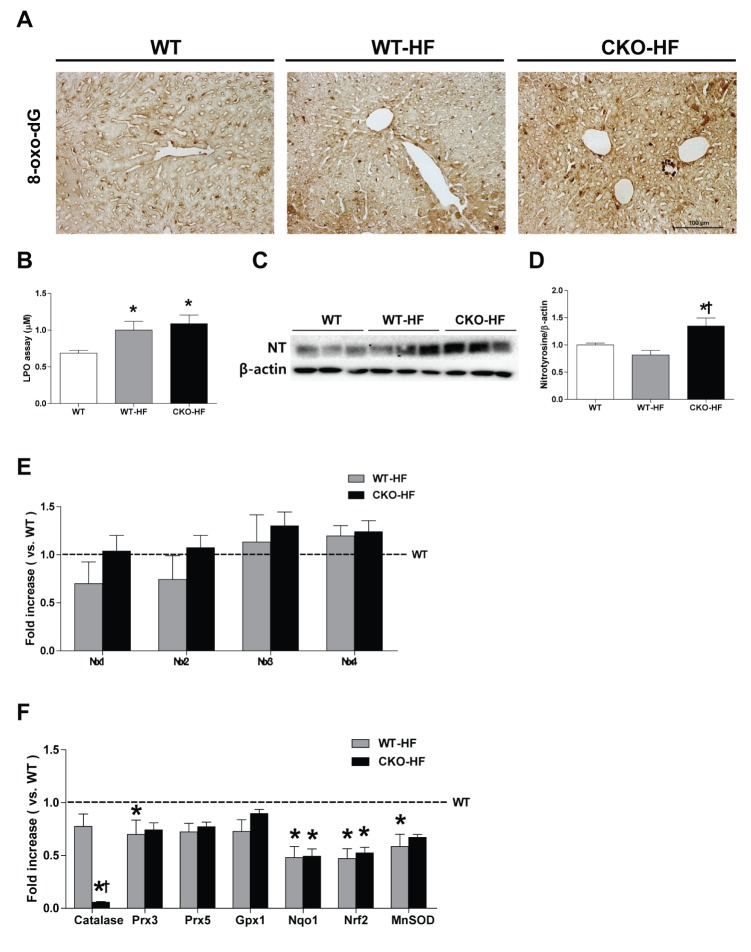
Fig. 6
Catalase deficiency accelerates liver oxidative stress and affects other antioxidant defense systems in the liver.
(A) Representative 8-oxo-dG staining (1:200) in the liver. Magnification, 200x; scale bar, 100 µm. (B) Lipid peroxidation products were measured by LPO assay. (C and D) Hepatic nitrotyrosine (NT) expression were analyzed with western blot. (E) mRNA expression of NOX 1~4 was described in the methods. (F) Catalase, peroxiredoxin 3, 5 (Prx3, Prx5), glutathione peroxidase (GPx1), NAD(P)H dehydrogenase (quinone)-1 (NQO1), nuclear factor (erythroid-derived 2) like-factor 2 (Nrf2), manganese superoxide dismutase (MnSOD) mRNA expressions were measured by real- time PCR as described in methods. Data are shown as mean±SE of 6 mice per group. *p<0.05 vs. WT; †p<0.05 vs. WT-HF.
![]()
To investigate whether catalase deficiency affected other antioxidant defense systems in the liver as a compensatory mechanism, mRNA expression of antioxidant enzymes, including Prx3, GPx1, NQO1, Nrf2, and MnSOD was measured by real-time PCR. All antioxidant mRNA expressions were not changed in CKO mice compared to WT mice (Supplementary Fig. 3D). NQO1, Nrf2, and MnSOD mRNA expression in WT-HF and CKO-HF mice were significantly reduced compared to those of WT mice (Fig. 6F). These data suggest catalase deficiency may not cause compensatory enhancement of other antioxidant systems.
DISCUSSION
The present study demonstrated that catalase deficiency did not cause noticeable changes in mice phenotype up to 10 weeks of age, but accelerated HFD-induced systemic and liver insulin resistance, liver inflammation along with increased oxidative stress as early as 2 weeks of HFD feeding.
We, first, aimed to determine the early phase of HFD-induced liver injury in mice in order to provide experimental model for interventional study on the screening of new liver-protective agents against NAFLD, since only few studies reported early stage of HFD-induced liver dysfunction. Previous study reported that mice fed with HFD for 3 days caused a significant body weight gain and elevated liver lipid content as well as systemic insulin resistance [21]. In addition to that, a 3 days short-term HFD in mice demonstrated early hepatic insulin resistance and steatosis through Kupffer cell activation [22]. We also found that systemic glucose tolerance and insulin-induced Akt phosphorylation (a marker of tissue insulin resistance) were decreased in HFD-fed mice. Body weight gain and liver lipid accumulation were not significantly increased in HFD-fed WT mice. While the exact reason for this difference is not clear, differences in high fat food formula, experiment period, and genetic background possibly account for the different outcomes.
Interestingly, HFD-induced liver injury was accelerated in CKO mice, which underscores the important role of peroxisome-derived oxidative stress in the progression of NAFLD. Because catalase is exclusively expressed in the peroxisome and that peroxisome conducts fatty acid oxidation, especially VLCFA and branched chain fatty acid, support the present finding that feeding 2 weeks of HFD significantly increased hepatic nitrotyrosine in CKO mice. Meanwhile, previous studies have demonstrated that overexpression of catalase in the peroxisome has been reported to reduce H2O2 production and protects insulin-producing cells from lipotoxicity [23]. Thus, it is important to notice that endogenous catalase protects early of HFD-induced liver injury through maintaining cellular redox homeostasis.
Oxidation reaction occurs mainly in both mitochondria and peroxisomes. Importantly, imbalances in peroxisomal lipid and ROS metabolism affect the mitochondrial function [14]. PGC-1a is the main regulator of mitochondrial biogenesis. The PGC-1a activation stimulates transcription of nuclear respiratory factor 1 (NRF-1) and its target gene mitochondrial DNA transcription factor A (TFAM). TFAM is one of the necessary regulators for mitochondrial DNA transcription, as well as genes encoding subunits of respiratory complexes. Our results showed lower PGC1a gene expression and its downstream effects of COX4-i1 in the CKO-HF mice, indicates that disturbances of peroxisomal ROS homeostasis have impact on the mitochondrial biogenesis. But mitochondria biogenesis genes expressions alone do not completely represent mitochondrial biogenesis. Additional methods of assessing mitochondrial biogenesis such as mitochondrial number or electron microscopic analysis are needed to validate our finding. In addition, spatiotemporal measurement of peroxisomal, mitochondrial, and cytosolic ROS by using hyper protein would be needed to dissect cross-talk between peroxisomal and mitochondrial ROS homeostasis [24].
In summary, 2-week HFD feeding induced liver injury including lipid accumulation, insulin resistance, and inflammation, which can be utilized for screening new therapeutic agents, targeting obesity and obesity related NAFLD. Catalase deficiency accelerates liver injury through increment of oxidative stress. These results suggested that endogenous catalase may play an important role in adapting liver redox homeostasis during early HFD-induced metabolic stress. Eventually, catalase deficiency may blunt initial induction that may protect the liver from HFD-induced injury.
 XML Download