

 PDF
PDF ePub
ePub Citation
 Print
Print


INTRODUCTION
The p53-inducible gene 3 (PIG3) is a gene located downstream of the tumor suppressor p53 and was originally identified through gene expression analysis during the search for genes associated with the onset of apoptosis in human colorectal cancer cells [1]. The major cellular role of PIG3 is its contribution to the generation of reactive oxygen species (ROS), which are downstream mediators of p53-dependent apoptosis [2]. A study by Contente et al., showed that PIG3 was induced by the transcriptional activation of p53 through direct binding to a pentanucleotide microsatellite sequence within the PIG3 promoter (TGYCC)n where Y=C or T [3]. The microsatellite sequence was found to be polymorphic, with a variable number of pentanucleotide repeats. An increased number of pentanucleotide microsatellites may be associated with cancer susceptibility. Moreover, the nucleotide sequence of PIG3 is homologous with NADH quinone oxidoreductase 1 (NQO1), which is a ubiquitous flavoenzyme involved in p53-induced apoptosis through ROS generation and cellular responses to oxidative stress and irradiation [45]. It was previously demonstrated that PIG3 regulates catalase activity through direct binding of catalase, resulting in ROS generation in response to DNA damage [6]. Moreover, PIG3 was also recently reported to be involved in the early cellular response to DNA damage. Long et al. first reported the discovery of PIG3 as a radiation-response gene, induced in a dose-dependent manner by ionizing radiation (IR) [7]. A subsequent study has demonstrated in detail that PIG3 plays a critical role in the cellular response to DNA damage induced by UV and by the radiomimetic drug neocarzinostatin (NCS) [8]. PIG3 knockdown causes impairment of DNA repair and defects in the intra-S phase and G2/M checkpoints in response to DNA damage. Additionally, PIG3 demonstrated the modulation of phosphorylation of Chk1, Chk2 and H2AX. PIG3 also associates with sensor complex components, such as γ-H2AX and 53BP1 in DNA damage foci after DNA damage, and contributes to the recruitment of 53BP1, Mre11, Rad50 and Nbs1 to the sites of DNA breaks. A recent study has also revealed a new mechanism of PIG3 function in the DNA damage response by regulating the homeostasis of DNA-PKcs, which plays a role in the response triggered by DNA double strand breaks induced by IR [9].
In addition to its regulatory role in ROS generation and DNA damage response, it was recently suggested that PIG3 might be involved in tumorigenesis. Microsatellite instability at the pentanucleus locus in the PIG3 promoter could be a potential tumorigenic mechanism. An association of the PIG3 promoter polymorphism was found in Japanese patients with invasive bladder carcinoma and squamous cell carcinoma of the head and neck [1011]. More recently, a report demonstrated that PIG3 was highly expressed in papillary thyroid carcinoma, suggesting an oncogenic effect of PIG3 in papillary thyroid cancer through activation of the PI3K/AKT/PTEN pathway [12]. Although accumulating evidence suggests the possibility of a role of PIG3 in cancer, the functional significance of PIG3 in cancer remains to be determined.
In this study, we demonstrate that PIG3 is highly expressed in human colon cancer cell lines. We also show that the silencing of PIG3 suppresses the anchorage-independent growth in soft agar, cell migration and invasion ability of HCT116 cells. Finally, through mouse xenograft tumor model studies, we demonstrate the inhibitory effect of PIG3 silencing on tumorigenesis in cancer cells. Thus, we propose that PIG3 may play a critical role in promoting and sustaining oncogenesis in colon cancer cells.
Go to : 
Methods
Cell cultures
Human colon carcinoma cell lines, HCT116, DLD-1, HCT-15, SW480, SW620, Caco-2 cells and fibroblasts from normal colon CCD-18Co cells were purchased from the American Type Culture Collection (ATCC; Manassas, VA, USA). DLD-1 and HCT-15 cells were maintained in RPMI1640 medium (Gibco-BRL, Grand Island, NY, USA). CCD18Co cells were grown in Eagle's minimum essential medium (EMEM; Gibco-BRL) and HCT116 cells were grown in Iscove's modified Dulbecco's medium (IMDM; Gibco-BRL). All culture media were supplemented with 10% fetal bovine serum (FBS; Gibco-BRL), 100 Units/ml penicillin, and 100 mg/ml streptomycin (Invitrogen, Carlsbad, CA, USA). Caco-2 cells were grown in Eagle's minimum essential medium supplemented with 20% FBS. Cells were incubated in 5% CO2-humidified atmosphere at 37℃.
Plasmid constructs and transfection
To generate the full-length constructs of PIG3, cDNA was amplified from human fibroblast GM00637 cells by RT–PCR using PIG3 oligo primers of the following sequences: sense, 5′-AA GGAAATAACCACCATGTTAGCCGTGCAC-3′ and antisense, 5′-CTGGGGCAGTTC CAGGACGATCTT-3 for full-length PIG3 construct. The amplified PIG3 PCR products were cloned into pEGFP-N1 vector (Invitrogen) and confirmed its sequences by automated DNA sequencing. Cells were transfected with the GFP-tagged full length PIG3 plasmid using Lipofectamine 2,000 (Invitrogen) according to the manufacturer's instructions.
Establishment of PIG3 shRNA-expressing HCT116 cells
For the stable knockdown of PIG3 expression, the target sequence of the 21-nucleotide sense shRNA was as follows: 5′-AAAUGUUCAGGCUGGAGACUA-3′. The PIG3 shRNA was prepared using transcription-based methods with the pSilencer hygro kit (Ambion, Austin, TX, USA) according to the manufacturer's instructions. Cells were transfected with the pSilencer-empty, pSilencer-PIG3 vector, which contains a human U6 promoter and a hygromycin resistance gene, and several colonies resistant to 300 µg/ml hygromycin were selected.
Western blot analysis
Cells were washed with 1× PBS and lysed in lysis buffer (20 mM HEPES [pH 7.4], 2 mM EGTA, 50 mM glycerol phosphate, 1% Triton X-100, 10% glycerol, 1 mM DTT, 1 mM phenylmethylsulfonyl fluoride, 10 µg/ml leupeptin, 10 µg/ml aprotinin, 1 mM Na3VO4 and 5 mM NaF) and amount of protein was determined using a dye-binding microassay (Bio-Rad, Hercules, CA, USA). Equal amounts of protein were electrophoresed on 8~12% SDS polyacrylamide gels followed by electrotransfer onto a polyvinylidene difluoride membrane (Millipore, Bedford, MA, USA). The membranes were carried out using the following antibodies: mouse anti-PIG3, rabbit anti-PIG3, and mouse anti-α-tubulin from Santa Cruz Biotechnology. The immunoblotted proteins were detected using an enhanced chemiluminescence detection system (ECL; iNtRON Biotechnology, Gyeonggi, Korea). Quantification of the band intensity was analyzed using ImageJ software (NIH Image, Bethesda, MD, USA).
Soft agar colony formation assay
Soft agar assays were performed in 6-well plates. The base layer of each well consisted of 2 ml with final concentrations of 1× medium and 0.6% low-melting point agarose (Duchefa, Haarlem, The Netherlands). Plates were chilled at 4℃ until solid. Next, a 1 ml growth agar layer was poured, consisting of 5×10⁴ cells suspended in 1× medium and 0.3% low-melting point agarose; plates were again chilled at 4℃ until the growth layer congealed. A further 1 ml of 1× medium without agarose was added on top of the growth layer. Cells cultures were maintained at 37℃ for 14 days with exchanging the media for every 3 days. Total colonies were stained with 0.005% crystal violet (Sigma, St Louis, MO, USA) and counted in five randomly fields. Images were analyzed using Image-Pro plus 4.5 software (Media Cybernetics).
Cell migration and invasion assays
In vitro cell migration assays were performed in a 24-well Transwell plate with 8-µm pore size polyethylene terephthalate membrane filters (BD Biosciences, San Jose, CA, USA) separating the lower and upper culture chambers. 2.5×10⁴ cells were plated in serum free media in upper chamber. Complete media were added to the bottom wells. Non-migrated cells were removed from the upper face of the filters using cotton swabs, and migrated cells in the lower face of the filters were fixed with 4% paraformaldehyde and stained with 0.1% crystal violet. For invasion assay, transwell inserts were coated with Matrigel. Images of 5 random ×10 fields were captured from each well and counted under a light microscope. The mean of triplicate assays for each experimental condition was used.
Tumor formation in nude mice
The 6-week-old male BALB/c nude mice (Orient Bio Inc. Seongnam, Korea) used in this study, which were housed in our pathogen-free facility and handled in accordance with standarduse protocols and animal welfare regulations, used in this study. Control shRNA- or PIG3 shRNA-HCT116 Cells (2×10⁶ cells) were resuspended in serum-free IMDM media and injected subcutaneously into the left and right flank of BALB/c nude mouse. Tumor size was measured with a caliper every 3 days. Tumor volumes were calculated by the following formula: tumor volume=(width2×length)/2. Mice were euthanized when their tumor diameters reached 2 cm and tumors were excised.
Ethics statement
All mouse experiments were reviewed and approved by the Institution Animal Care and Use Committee (IACUC) of Chosun University School of Medicine (IACUC No. CHOSUN-2015-12-001) and complied with the NIH Guide for “The Care and Use of Laboratory Animals”. The animals were housed in specific pathogen-free (SPF) rooms with free access to food and water.
Immunohistochemistry
The tumors from xenograft tumors in nude mouse were embedded in OCT (Sakura Tissue-Tek, Torrance, CA, USA) and frozen on dry ice. Samples blocks were sectioned at 6~8 µm thickness for staining. Sections were permeabilized for 30 min with 0.1% Triton X-100 in PBS and incubated for 30 min with 3% hydrogen peroxide to inhibit endogenous peroxidase activity. For hematoxylin and eosin (H&E) staining, sections were stained with hematoxylin for 3 min followed by counterstaining with eosin for 27 s. For immunohistochemistry to detect the PIG3 expression, sections were blocked with blocking buffer (5% normal goat serum in TBS) for 1 hour at room temperature and stained with anti-PIG3 antibody in blocking buffer at 4℃ for overnight. After PBS washing, sections were incubated with biotinylated goat anti-rabbit secondary antibody (Vector Laboratories, Burlingame, CA, USA) followed by the diaminobenzidine (DAB)-Peroxidase Substrate Solution (DakoCytomation, Carpinteria, CA, USA) for 30 min and counterstained with haematoxylin. Images were acquired using an Olympus C-4040Z digital camera and an Olympus BX-50 microscope (Olympus Corp., Lake Success, NY, USA).
Data analysis
Each experiment was performed at least three times. The data in all experiments are represented as mean±standard deviation (S.D.). Statistical comparisons were carried out using an unpaired t-test. p values<0.05 were considered statistically significant.
Go to :
Results
Expression of PIG3 in human colon cancer cell lines
To demonstrate the relevance of PIG3 in cancer, we measured the expression of PIG3 in 6 human colon cancer cell lines, HCT116, DLD-1, HCT-15, SW480, SW620, and Caco-2, as well as in fibroblasts derived from normal human colon (CCD-18Co). Western blot analysis revealed that the expression of PIG3 was much higher in colon cancer cell lines than in CCD-18Co cells, suggesting an oncogenic role of PIG3 in human colon cancer cells (Fig. 1). Based on this finding, we explored the effects of PIG3 in human colon adenocarcinoma HCT116 cells.

Overexpression of PIG3 enhances tumorigenicity in colon cancer cells
To investigate whether PIG3 could be involved in cancer cell tumorigenicity, we constructed a pEGFP-N1 vector expressing the full-length PIG3 gene. Control- and PIG3-pEGFP were transfected in HCT116 cells, respectively, and 48h after transfection, cells were examined in the soft agar colony formation assay to assess clonogenic potential under anchorage-independent growth conditions. PIG3 expression in transfected HCT116 cells was confirmed by Western blot analysis. As shown in Fig. 2A, the PIG3 protein expression level of was significantly increased in PIG3-pEGFP transfected cells, as compared to control cells. We found that overexpression of PIG3 led to a marked increase in colony formation in soft agar assays (Fig. 2B). These results indicate that overexpression of PIG3 could promote the tumorigenic behavior of colon cancer cells. Together with anchorage-independent cell growth, the monitoring of cancer cell mobility is also an important way to evaluate the potential for cancer progression. Therefore, we examined whether PIG3 affected the migration and invasion ability of cancer cells using the transwell assay. The results presented in Fig. 2C show increased migration of PIG3 transfected cell compared to control GFP-transfected cells. Therefore, overexpression of PIG3 could enhance cell migration and invasion activity. These results suggest that PIG3 expression is associated with tumorigenicity of colon cancer cells in vitro, supported by the increase of colony formation, and enhancement of migratory and invasive capacity.
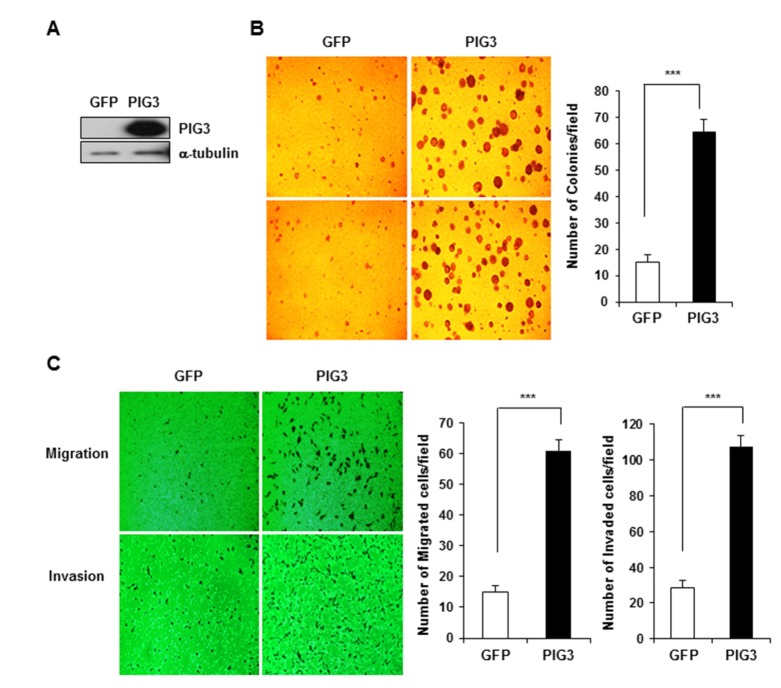 | Fig. 2PIG3 overexpression enhances the tumorigenicity of HCT116 cells in vitro.(A) Western blot analysis showed the increase of PIG3 expression in PIG3 overexpressing HCT 116 cells, compared to control vector expressing cells. a-tubulin was used as a loading control. (B) Control vector and PIG3 overexpressing cells were assessed for colony formation in soft agar for 14 days. (C) Cell migration and invasion assays were performed using the Transwell system. Data represent the mean cell numbers from 5 fields, ***p<0.001, compared to control.
|
Knockdown of PIG3 suppresses cell growth and mobility in colon cancer cells
To investigate the biological role of PIG3 in the survival and growth of colon cancer cells, we analyzed the effect of PIG3 depletion in HCT116 cells. For these studies, we established HCT116 cell lines containing a stable PIG3-knockdown using a small hairpin RNA (shRNA) expression vector. Western blot analysis showed that the expression of PIG3 was effectively inhibited in PIG3 shRNA-HCT116 cells compared with control shRNA-HCT116 cells (Fig. 3A). We tested the colony formation ability of PIG3 knockdown HCT116 cells using the soft agar assay. The soft agar assay indicated that PIG3 knockdown resulted in reduction of colony formation in PIG3 shRNA-HCT116 cells, in contrast to control shRNA-HCT116 cells that formed colonies of increased size and number (Fig. 3B). To determine the effect of PIG3 knockdown on cell mobility, we performed a transwell migration and invasion assay with control- and PIG3 shRNA-HCT116 cells. As shown in Fig. 3C, the migration assay revealed a 30% reduction in the cell migration ability of PIG3 shRNA-HCT116 cells compared to control cells. Additionally, an invasion assay using Matrigel-coated transwells showed that the number of invasive cells when PIG3 was knocked down was approximately 35% lower than with control shRNA cells. In summary, these results suggest that knockdown of PIG3 could suppress the colony formation, migration and invasion capabilities of colon cancer cells, in clear contrast to the effects caused by PIG3 overexpression, and consistent with the anticipated regulatory effect of PIG3 in HCT116 cell tumorigenesis.
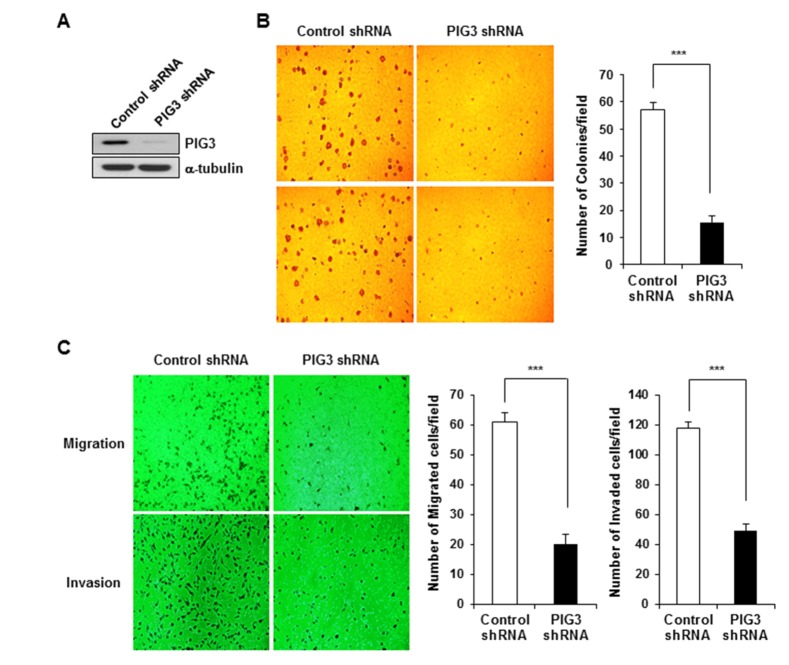 | Fig. 3PIG3 knockdown by shRNA attenuates the tumorigenicity of HCT116 cells in vitro.(A) Cells stably expressing control shRNA and PIG3-specific shRNA were analyzed by Western blot using an anti-PIG3 antibody. a-tubulin was used as a loading control. (B) Colony formation assay performed on soft agar. (C) Cell migration and invasion assays were performed using the Transwell system. Data represent the average cell numbers from 5 fields. ***p<0.001, compared to control.
|
Knockdown of PIG3 inhibits in vivo tumor growth of HCT116 cells in nude mice
Next, we examined the effects of PIG3 on tumor formation and growth in vivo using mouse xenograft tumor models. Control shRNA- and PIG3 shRNA-HCT116 cells were subcutaneously injected into the left and right flank, respectively, of nude mice to initiate tumor formation. Tumor volume was measured twice a week. At 12 days post implantation, we observed that the implanted HCT116 cells had successfully formed solid tumors. Most importantly, the size of the tumors originating from the implantation of PIG3 shRNA-HCT116 cells was significantly smaller than that of tumors from control shRNA-HCT116 cells. With exponential tumor growth until 40 days, tumor growth rate was significantly reduced in mice receiving PIG3 shRNA-HCT116 cells, compared with the control group (Fig. 4A and B). These results suggest that PIG3 plays a critical role in the in vivo growth of HCT116 cells.
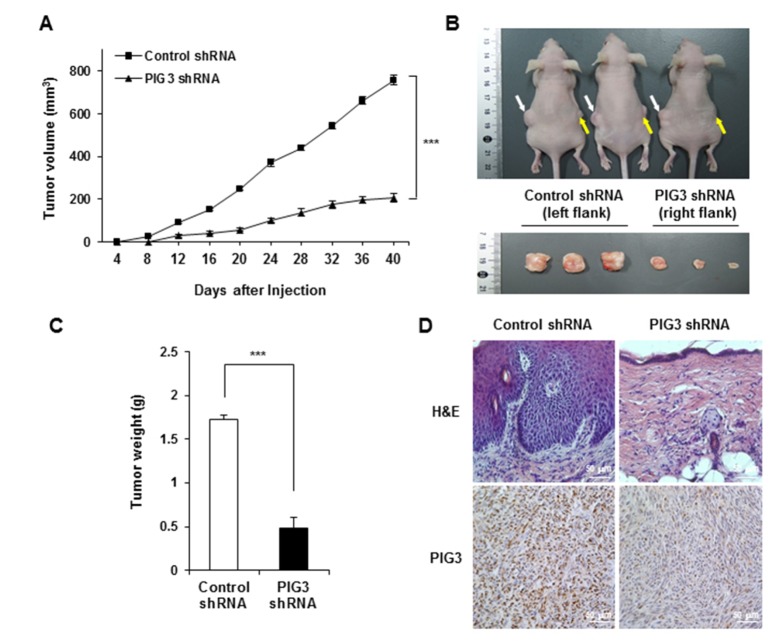 | Fig. 4Effects of PIG3 knockdown on tumor growth cells in a nude mice HCT116 xenograft model.Control-(white arrows) and PIG3 shRNA (yellow arrows) HCT116 cells were injected subcutaneously into the left and right flank of nude mice, respectively (n= 3). (A) Tumor volumes were measured every 4 days over a period of 40 days. (B) The morphology of nude mice (upper panel) and xenograft tumors (lower panel) were photographed 40 days after injection. (C) The graph represents the average of the tumor weights. Values are means of tumor weights±S.D. from triplicate experiments. ***p<0.001, compared to control shRNA-transfected group. (D) Tumor tissues were subjected to H&E staining and immunostaining for determination of expression of PIG3 in the tumor xenografts.
|
Tumors were excised at the end of the experiments. The weights of the tumors derived from control and PIG3 shRNA-HCT116 cells were 1.7±0.06 g and 0.5±0.12 g, respectively (Fig. 4C). Thus, tumor growth of the PIG3 knockdown cells was markedly reduced compared to that of the control cells. We also performed an immunohistochemistry analysis using anti-PIG3 antibody to determine the expression of PIG3 in the xenograft tumor tissue. As the shown in Fig. 4D, tumor tissue from nude mice injected with control shRNA expressing HCT116 cells had high expression of PIG3. By contrast, tumor tissue from nude mice injected with PIG3 shRNA expressing HCT116 cells had significantly lower expression of PIG3.
Go to :
Discussion
In the present study, we demonstrate the oncogenic effect of PIG3 in human colon cancer cells. We first discovered that PIG3 was highly expressed in human colon cancer cell lines compared to normal colon-derived fibroblasts, suggesting a key role of PIG3 in colon cancer susceptibility. To assess PIG3 function in colon cancer cell lines, we analyzed the role of PIG3 in the tumorigenicity of HCT116 cells through colony formation, migration and invasion assays. We found that PIG3 overexpression led to increased colony formation, migration and invasion in HCT116 cells.
To further determine the role of PIG3 in cancer cell function, we established the knockdown of PIG3 expression in HCT116 cells. Downregulation of PIG3 significantly reduced the cancer cells' growth and metastatic potential, as revealed by the reduction of colony formation on soft agar, as well as reduction of cell migration and invasion ability. Our in vivo xenograft tumor results also confirmed that PIG3 promoted tumor growth, as silencing of PIG3 suppressed tumor growth in vivo. Therefore, our data suggest that overexpression of PIG3 may contribute to the tumorigenicity of colon cancer cells.
Accumulating evidence has identified a relationship between PIG3 and cancer. For example, the number of repeats of the microsatellite in PIG3 may be closely related to invasive bladder cancer and squamous cell carcinoma of head and neck [1011]. In addition, the full length PIG3 was primarily overexpressed in human cancer cells, whereas non-functional PIG3AS (PIG3 alternative splice) expression was not highly expressed in cancer cells, suggesting a role of PIG3 in cancer [13]. Moreover, the expression of PIG3 in papillary thyroid carcinoma (PTC) was significantly increased at the both the mRNA and protein levels, but the expression of p53, which induces the expression of PIG3 through a microsatellite at its promoter, was lower in PTC than normal thyroid tissue, suggesting that the expression of PIG3 is not associated with p53 in PTC [12]. PIG3 is known to be a downstream effector in p53-dependent apoptosis response. However, because PIG3 expression alone is insufficient to induce apoptosis, it may cooperate with several proapoptotic factors in causing apoptotic cell death [1]. PIG3 expression was increased during p53-dependent apoptosis. However, elevated levels of PIG3 were maintained in cells when the apoptotic stimulus was removed, while levels of p53 and its downstream targets, such as p32 and MDM2 decreased rapidly [14]. The above mentioned studies suggest that PIG3 is involved in carcinogenesis without induction by p53.
In summary, our studies demonstrated that PIG3 plays an oncogenic role in the colon cancer cell lines. Our in vitro studies demonstrated that overexpression of PIG3 enhanced colon cancer cell proliferation, migration and invasion. Conversely, knockdown of PIG3 markedly inhibited cancer cell proliferation, migration and invasion, and inhibited in vivo tumor growth in a nude mice tumor model. These findings provide strong support for PIG3's role as a promoter of colon cancer.
Go to :
 XML Download