

 PDF
PDF ePub
ePub Citation
 Print
Print


INTRODUCTION
The extracellular pH in all tissues is generally controlled within a narrow range (7.4±0.05) to maintain normal physiological processes. However, the extracellular pH can fall as low as pH 5.5 in several pathological conditions, including inflammation, ischemia/hypoxia, injury, and malignant tumors [1], and under normal physiological conditions, including the generation of action potentials and synaptic transmission [2]. This tissue acidosis has a broad impact on several tissues that have electrically excitable membranes, such as nerves, heart, and muscle [23]. In the case of peripheral tissues, light has been shed on the role of tissue acidosis on nociceptive transmission, since acidic pH induces pain and exacerbates painful conditions [456] by activating acid-sensitive ion channels (ASICs) to increase the excitability of sensory neurons [789]. However, since all proteins are affected by pH, the functional properties of ion channels and receptors expressed in the nervous system can be altered by the pH level. For example, various voltage-gated ion channels, transient receptor potential vanilloid 1, and gamma-aminobutyric acid A (GABAA) receptors are modulated by an acidic pH [810], suggesting that local and systemic changes in the extracellular pH may affect basic functions, including neuronal excitability.
The somata of sensory neurons innervating orofacial tissues are located in the trigeminal ganglia and trigeminal mesencephalic nucleus (Vmes). While sensory neurons within the trigeminal ganglia process somatosensory information from orofacial tissues, including pain and innocuous tactile sensation, those within the Vmes process proprioception and mechanosensation from the muscle spindle of the masseter muscle and periodontal ligaments [1112]. Unlike other sensory neurons, the somata of Vmes neurons are located in the central nervous system (CNS); thus, their excitability can be affected by peripheral as well as central environments [131415]. For example, local and/or systemic acidosis may affect the proprioception and mechanosensation mediated by Vmes neurons by activating ASICs [16171819]. However, given that peripheral information is conveyed to the CNS through action potentials, the role of an acidic extracellular pH in the generation and conduction of action potentials should also be examined. In this regard, we have recently shown that an acidic pH had a minor effect on voltage-gated Na+ channels in acutely isolated Vmes neurons [20]. However, the generation and conduction of action potentials, and synaptic transmission at presynaptic nerve terminals also require other voltage-gated ion channels, such as voltage-gated K+ and Ca2+ channels and hyperpolarization-gated and cyclic nucleotide-activated cation (HCN) channels. Therefore, in the present study we investigated whether acidic pH modulates the function of voltage-gated K+ and Ca2+ channels, and HCN channels in acutely isolated rat Vmes neurons.
Go to : 
METHODS
All experiments complied with the guiding principles for the care and use of animals approved by the Council of the Physiological Society of Korea and the National Institutes of Health Guide for the Care and Use of Laboratory Animals, and every effort was made to minimize both the number of animals used and their suffering.
Sprague Dawley rats (12~16 days old, either sex) were decapitated under ketamine-induced anesthesia (100 mg/kg, intraperitoneally [i.p.]). The midbrain was dissected and transversely sliced at a thickness of 400 µm using a microslicer (VT1000S; Leica, Nussloch, Germany). Slices containing the Vmes were kept in an incubation medium (124 mM NaCl, 3 mM KCl, 1.5 mM KH2PO4, 24 mM NaHCO3, 2 mM CaCl2, 1.3 mM MgSO4 and 10 mM glucose) saturated with 95% O2 and 5% CO2 at room temperature (22~24℃) for at least 1 h before the mechanical dissociation. For dissociation, slices were transferred into a 35 mm culture dish (Primaria 3801; Becton Dickinson, Rutherford, NJ, USA) containing a standard external solution (150 mM NaCl, 3 mM KCl, 2 mM CaCl2, 1 mM MgCl2, 10 mM glucose, and 10 mM Hepes; pH of 7.4 with Tris-base, 320~330 mOsm), and the Vmes region was identified under a binocular microscope (SMZ-1; Nikon, Tokyo, Japan). Details of the mechanical dissociation have been described previously [21]. Briefly, mechanical dissociation was accomplished using a custom-built vibration device and a fire-polished glass pipette oscillating at 50~60 Hz (0.3~0.5 mm) on the surface of the Vmes region. The slices were removed and the mechanically dissociated neurons were left for 15 min to allow the cells to adhere to the bottom of the culture dish.
All electrophysiological measurements were performed using a conventional whole-cell patch clamp method in a voltage-clamp mode (Axopatch 200B; Molecular Devices, Union City, CA, USA). Patch pipettes were made from borosilicate capillary glass (G-1.5; Narishige, Tokyo, Japan) using a pipette puller (P-97; Sutter Instrument Co., Novato, CA, USA). The resistance of the recording pipettes filled with an internal solution was 1.0~2.0 MΩ. The liquid junction potential (–9 to –11 mV; measured by exchanging the bath solution from the internal solution to the standard external solution) and pipette capacitance were compensated for. Neurons were viewed under phase contrast on an inverted microscope (TE2000; Nikon). Membrane currents were filtered at 2~5 kHz, digitized at 10~20 kHz, and stored on a computer equipped with pCLAMP 10.2 (Molecular Devices). Recordings were discontinued if the access resistance changed by more than 15%. All experiments were performed at room temperature (22~25℃).
To record voltage-dependent K+ currents, the pipette solution containing 140 mM KMeHSO3, 10 mM KCl, 2 mM EGTA, 2 mM Mg-ATP, and 10 mM Hepes (pH 7.2 with Tris-base, 300~310 mOsm) was used, and neurons were held at a holding potential (VH) of –120 mV. The standard external solution contained 10 µM SR95531, 3 mM kynurenic acid, 300 nM tetrodotoxin (TTX), and 100 µM Cd2+ to block ionotropic GABAA and glutamate receptors, and voltage-gated Na+ and Ca2+ channels, respectively. To record HCN channel-mediated currents (also called Ih), the pipette solution containing 140 mM CsMeHSO3, 5 mM TEA-Cl, 5 mM CsCl, 2 mM EGTA, 2 mM Mg-ATP, and 10 mM Hepes (pH 7.2 with Tris-base, 300~310 mOsm) was used and neurons were held at a VH of –50 mV. Intracellular Cs+ does not affect the HCN channel-mediated currents [22]. The standard external solution contained 10 µM SR95531, 3 mM kynurenic acid, 300 nM TTX, and 100 µM Cd2+ to block ionotropic GABAA and glutamate receptors, and voltage-gated Na+ and Ca2+ channels, respectively. To record voltage-dependent Ca2+ currents, the pipette solution containing 140 mM CsMeHSO3, 5 mM CsCl, 1 mM CaCl2, 4 mM EGTA, 2 mM Mg-ATP, and 10 mM Hepes (pH 7.2 with Tris-base, 300~310 mOsm) was used and neurons were held at a VH of –100 mV. The standard external solution contained 10 µM SR95531, 3 mM kynurenic acid, and 300 nM TTX to block ionotropic GABAA and glutamate receptors, and voltage-gated Na+ channels, respectively. Each extracellular solution was adjusted to a pH of 7.4, pH 6.5, or pH 6.0 with Tris-base, and was applied using the ‘Y–tube system’ for rapid solution exchange [23]. All drugs used in this study were purchased from Sigma (St. Louis, MO, USA).
The amplitudes of voltage-gated ion currents were measured by subtracting the baseline from the peak currents using the Clampfit program (Molecular Devices). The effects of acidic pH were quantified as the percentage change in current amplitudes compared to the control values. The amplitude of the voltage-gated ion current was transformed into conductance (G) using the following equation: G=I/(V–Eion), where Eion represents the equilibrium potential of the relevant ion channels (K+ channels: –98.5 mV of EK, Ca2+ channels: +75.5 mV of ECa, HCN channels: +0.5 mV of Ecation, respectively) calculated by the Nernst equation. The averaged steady-state activation curves were fitted to the Boltzmann equation: G/Gmax=1/{1+exp[(V50,act–V)/k]}, where Gmax is the maximum conductance, V50,act is a half-maximum potential for activation, and k is the slope factor. Numerical values are provided as the mean±standard error of the mean (SEM), except where indicated, using values normalized to the control. Significant differences induced in the current amplitude by acidic pH levels were tested using a two-tailed Student's t-test, using absolute values rather than normalized values. Differences with a p<0.05 were considered statistically significant.
Go to :
RESULTS
Effects of acidic pH on voltage-gated K+ channels
The effects of acidic pH on voltage-gated K+ channels were examined in acutely isolated Vmes neurons using a whole-cell patch-clamp technique. Vmes neurons were easily distinguished from other central neurons based on their morphological properties, such as round or oval somata without any dendritic processes (Fig. 1A). As shown in our previous study, the application of an acidic solution induced an inwardly directed membrane current, which is mediated by ASICs, in most Vmes neurons [24]. However, the acid-induced currents were desensitized within 10 s, and the input resistance was not changed by the prolonged application of a solution with pH 6.0 (150.3±31.5 MΩ for the control and 134.9±28.4 MΩ for 30 s after the application of a pH 6.0 solution, respectively, n=6, p=0.61; Fig. 1B). Therefore, in all subsequent experiments the effects of an acidic solution on voltage-gated ion channels were examined at least 30 s after the application of the acid.
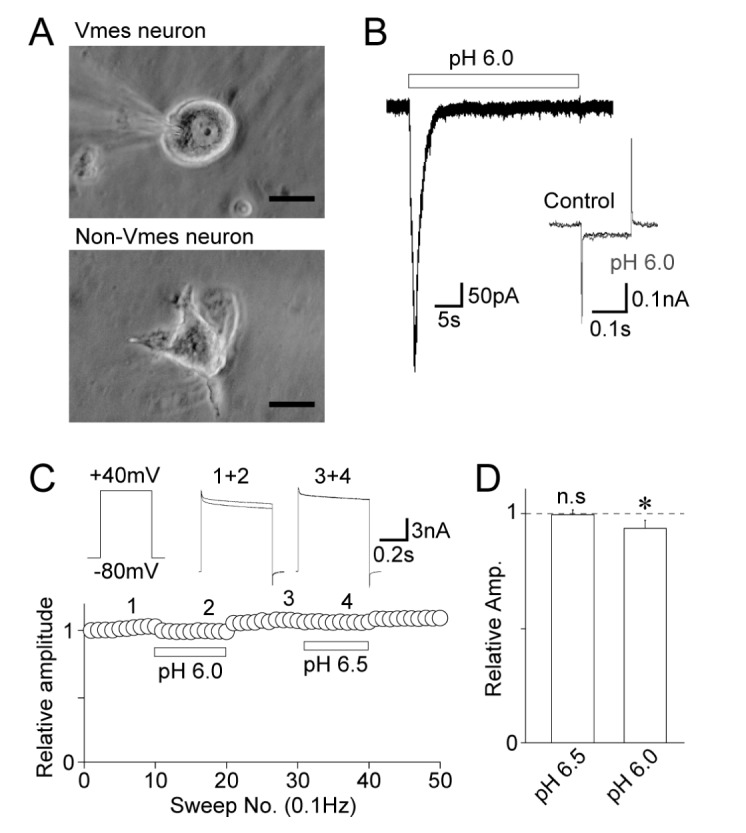 | Fig. 1Effects of acidic pH on voltage-dependent K+ currents.(A) Phase contrast images of Vmes (upper) and non-Vmes (lower) neurons isolated from the Vmes region. While Vmes neurons, which are primary sensory neurons, generally had a round or oval soma without any dendritic processes, non-Vmes neurons, which are central neurons, have several dendritic processes. Scale bars: 20 µm. (B) pH 6.0-induced current recorded from Vmes neurons. Note that the acid-induced currents returned to the basal current levels within 10 s of the application of the pH 6.0 solution. Inset: typical current responses to hyperpolarizing voltage step pulses (–10 mV, 150 ms duration) before (black) and 30 s after the application of the pH 6.0 solution (gray). (C) A typical time course of the peak amplitude of voltage-dependent K+ currents before, during, and after the application of a solution with an acidic pH. Insets represent raw traces of voltage-dependent K+ currents at numbered regions. (D) Acidic pH-induced changes in the peak amplitude of voltage-dependent K+ currents. Each column represents the mean and standard error of mean from 8 and 9 experiments for the pH 6.5 and pH 6.0 conditions, respectively. *p<0.05; n.s: not significant.
|
The voltage-gated K+ currents were induced by depolarizing step pulses (–120 mV to +30 mV, 500 ms duration every 10 s), and the stable voltage-gated K+ currents were recorded (Fig. 1C). The acidic extracellular solution was applied to Vmes neurons under these conditions. While the pH 6.5 solution had no effect on voltage-gated K+ channels (99.5±2.1% of the control, n=8, p=0.85), the pH 6.0 solution slightly but significantly decreased the peak amplitude of voltage-gated K+ currents (93.6±3.5%, n=9, p<0.05; Fig. 1C and D).
Next, the effects of acidic pH on the voltage-activation relationship of voltage-gated K+ channels were examined. The voltage-gated K+ currents were induced by 500 ms depolarizing pulses from –120 mV to +30 mV in 10 mV increments at pH 7.4 and acidic pH (Fig. 2A). While the pH 6.5 solution did not affect the current-voltage (I~V) and conductance-voltage (G~V) relationships (Fig. 2B), the pH 6.0 solution shifted both the I~V and G~V relationships slightly to the right (Fig. 2C). In addition, the conductance at pH 6.5 or pH 6.0 was normalized to the maximal conductance at pH 7.4, and the data were individually fitted to the Boltzmann function. The pH 6.5 solution had no effect on the midpoint voltage for activation (V50,act) (–20.2±1.0 mV for the control and –20.3±1.5 mV for the pH 6.5 condition, n=8, p=0.49; Fig. 2Bb and Da). However, the pH 6.0 solution significantly shifted the V50,act towards the depolarization range (–22.7±1.3 mV for the control and –16.8±1.0 mV for the pH 6.0 condition, n=10, p<0.01, Fig. 2Cb and Da). The slope factor k was not affected by acidic pH (15.1±1.1 mV and 15.3±1.3 mV for the control and pH 6.5 conditions, respectively, n=8, p=0.74; 15.2±1.0 mV and 15.4±0.8 mV for the control and pH 6.0 conditions, respectively, n=10, p=0.82; Fig. 2Db).
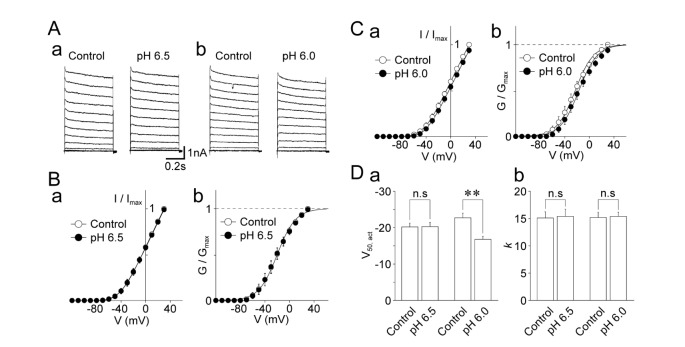 | Fig. 2Effects of acidic pH on the voltage-dependence of voltage-dependent K+ currents.(A) Typical traces of voltage-dependent K+ currents before (left) and during (right) the application of a solution with an acidic pH (a: pH 6.5; b: pH 6.0). (B) Current-voltage (a) and conductance-voltage (b) relationships of voltage-dependent K+ channels in the control (open circles) and pH 6.5 conditions (closed circles). Each circle and error bar represents the mean and standard error of mean (SEM) from 8 experiments. (C) Current-voltage (a) and conductance-voltage (b) relationships of voltage-dependent K+ channels in the control (open circles) and pH 6.0 conditions (closed circles). Each circle and error bar represents the mean and SEM from 10 experiments. (D) Acidic pH-induced changes in V50,act (a) and k (b) of voltage-dependent K+ channels. Each column and error bar represents the mean and SEM from 8 and 10 experiments for the pH 6.5 and pH 6.0 conditions, respectively. **p<0.01; n.s: not significant.
|
Effects of acidic pH on HCN channels
The effects of acidic pH on HCN channels were examined in acutely isolated Vmes neurons. Vmes neurons were held at a VH of –50 mV and the stable hyperpolarization-induced inward currents were recorded by voltage step pulses (–50 mV to –130 mV, 1,000 ms duration every 10 s). The application of 1 mM Cs+, a general HCN channel inhibitor, greatly reduced the hyperpolarization-induced membrane currents (12.6±1.1% of the control, n=6, p<0.01; Fig. 3A and B), suggesting that these hyperpolarization-induced currents are mediated by HCN channels. Under these conditions, the acidic extracellular solution was applied to Vmes neurons. While the pH 6.5 solution had no effect on hyperpolarization-induced currents (97.0±1.3% of the control, n=9, p=0.33), the pH 6.0 solution significantly decreased the peak amplitude of hyperpolarization-induced currents (90.1±2.1% of the control, n=9, p<0.05) (Fig. 3A and B).
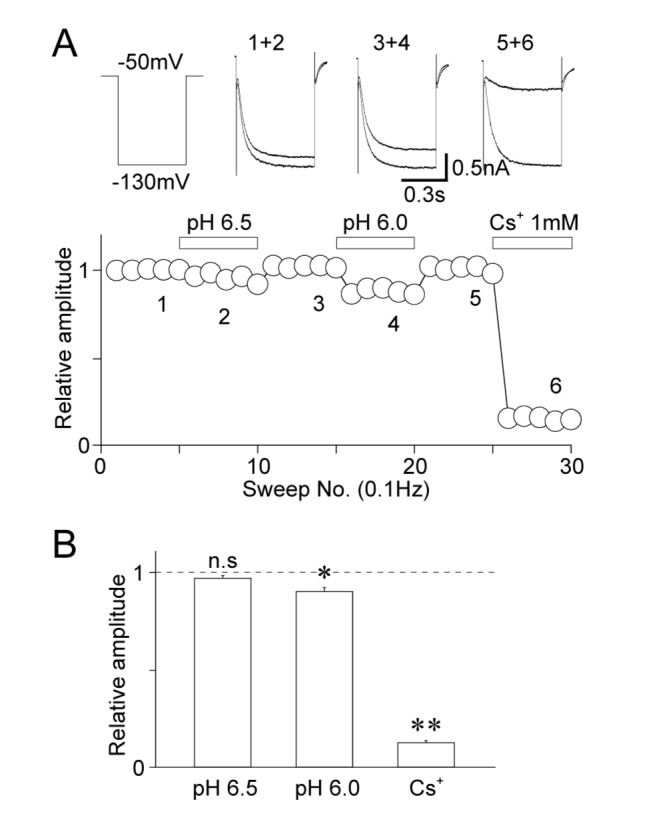 | Fig. 3Effects of acidic pH on cyclic nucleotide-activated cation (HCN) currents.(A) A typical time course of the peak amplitude of HCN currents before, during, and after the application of a solution with an acidic pH and 1 mM Cs+. Note that Cs+, a general HCN channel blocker, greatly inhibited the membrane currents induced by hyperpolarizing voltage stimuli. Insets represent raw traces of HCN currents at numbered regions. (B) Acidic pH-induced changes in the peak amplitudes of HCN currents. Each column represents the mean and standard error of mean from 9, 9, and 6 experiments for the pH 6.5, pH 6.0, and Cs+ conditions, respectively. *p<0.05, **p<0.01; n.s: not significant.
|
Next, the effects of acidic pH on the voltage-activation relationship in HCN channels were examined. The hyperpolarization-induced currents were stimulated by 1000 ms hyperpolarizing pulses from –50 mV to –160 mV in 10 mV decrements at pH 7.4 and acidic pH (Fig. 4A). The pH 6.5 solution did not affect the I~V and G~V relationships (Fig. 4B), or the V50,act of the hyperpolarization-induced currents (–111.3±5.6 mV for the control and –111.4±4.8 mV for the pH 6.5 condition, n=9, p=0.68; Fig. 4Bb and Da). The slope factor k was not affected by the pH 6.5 solution (10.2±0.3 mV for the control and 10.5±0.4 mV for the pH 6.5 condition, n=9, p=0.93; Fig. 4Db). Unlike the pH 6.5 solution, the pH 6.0 solution induced a unique pattern in the I~V and G~V relationships in HCN channels (Fig. 4C). When the hyperpolarization-induced currents were stimulated by strong hyperpolarization (–130 mV~–160 mV), the pH 6.0 solution decreased the amplitude of these currents. However, the pH 6.0 solution increased the amplitude of the hyperpolarization-induced currents stimulated by weak hyperpolarization (–80 mV~–100 mV). The V50,act of the hyperpolarization-induced currents was not affected by the pH 6.0 solution (–113.7±5.2 mV for the control and –109.5±5.9 mV for the pH 6.0 condition, n=10, p=0.47; Fig. 4Cb and Da). However, the slope factor k was significantly increased (10.3±0.3 mV for the control and 11.7±0.5 mV for the pH 6.0 condition, n=10, p<0.05; Fig. 4Db).
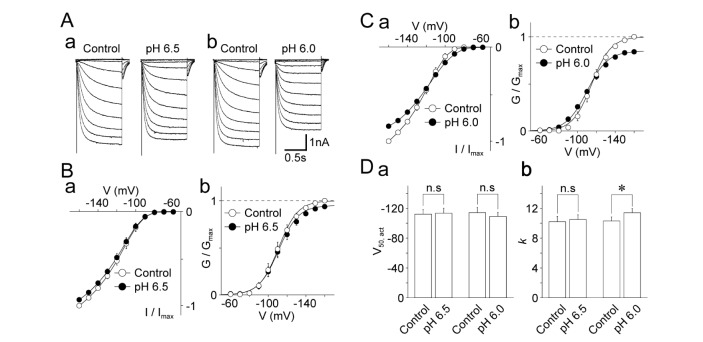 | Fig. 4Effects of acidic pH on the voltage-dependence of cyclic nucleotide-activated cation (HCN) currents.(A) Typical traces of HCN currents before (left) and during (right) the application of a solution with an acidic pH (a: pH 6.5; b: pH 6.0). (B) Current-voltage (a) and conductance-voltage (b) relationships of HCN channels in the control (open circles) and pH 6.5 conditions (closed circles). Each circle and error bar represents the mean and standard error of mean (SEM) from 9 experiments. (C) Current-voltage (a) and conductance-voltage (b) relationships of HCN channels in the control (open circles) and pH 6.0 conditions (closed circles). Each circle and error bar represents the mean and SEM from 10 experiments. (D) Acidic pH-induced changes in V50,act (a) and k (b) of HCN channels. Each column and error bar represents the mean and SEM from 9 and 10 experiments for the pH 6.5 and pH 6.0 conditions, respectively. *p<0.05; n.s: not significant.
|
Effects of acidic pH on voltage-gated Ca2+ channels
The effects of acidic pH on voltage-gated Ca2+ channels were examined using acutely isolated Vmes neurons. Vmes neurons were held at a VH of –100 mV and the stable voltage-gated Ca2+ currents were recorded by voltage step pulses (–100 mV to 0 mV, 50 ms duration every 20 s). Application of 100 µM of Cd2+, a general voltage-gated Ca2+ channel inhibitor, completely blocked these currents (1.5±0.1% of the control, n=8, p<0.01; Fig. 5A and B). Unlike the voltage-gated K+ channels or HCN channels, the acidic extracellular solution profoundly decreased the peak amplitude of voltage-gated Ca2+ currents (for pH 6.5: 72.3±2.3% of the control, n=9, p<0.01; for pH 6.0: 48.2±2.8% of the control, n=9, p<0.01; Fig. 5A and B).
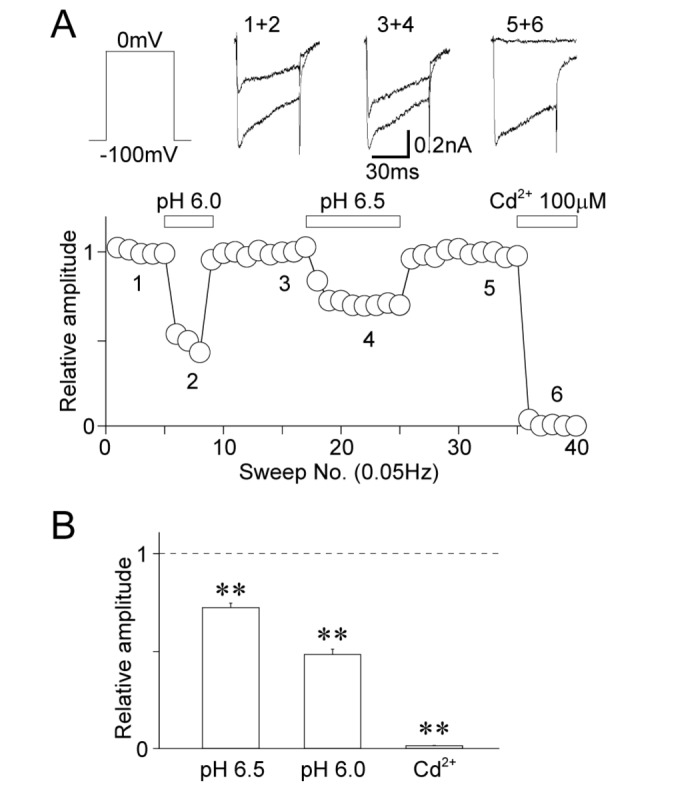 | Fig. 5Effects of acidic pH on voltage-dependent Ca2+ currents.(A) A typical time course of the peak amplitude of voltage-dependent Ca2+ currents before, during, and after the application of a solution with an acidic pH and 100 µM Cd2+. Note that Cd2+, a general voltage-dependent Ca2+ channel blocker, greatly inhibited the membrane currents induced by depolarizing voltage stimuli. Insets represent raw traces of voltage-dependent Ca2+ currents at numbered regions. (B) Acidic pH-induced changes in the peak amplitude of voltage-dependent Ca2+ currents. Each column represents the mean and standard error of mean from 8, 9, and 9 experiments for the pH 6.5, pH 6.0, and Cd2+ conditions, respectively. **p<0.01.
|
Next, the effects of acidic pH on the voltage-activation relationship of voltage-gated Ca2+ channels were examined. The voltage-gated Ca2+ currents were induced by 50 ms depolarizing pulses from –100 mV to +20 mV in 15 mV increments at pH 7.4 and acidic pH (Fig. 6A). As shown in Fig. 6B, the pH 6.5 solution changed both the I~V and G~V relationships. In particular, the pH 6.5 solution shifted the V50,act towards the depolarization range (–24.4±1.8 mV for the control and –17.8±2.1 mV for the pH 6.5 condition, n=8, p<0.01; Fig. 6B and Da). The slope factor k was increased by acidic pH 6.5 (6.1±0.4 mV for the control and 7.2±0.4 mV for the pH 6.5 condition, n=8, p<0.05; Fig. 6Db). The pH 6.0 solution also changed both the I~V and G~V relationships. The V50,act was shifted towards the depolarization range (–25.6±2.2 mV for the control and –22.7±1.9 mV for the pH 6.0 condition, n=10, p<0.05; Fig. 6C and Da). The slope factor k was increased (6.1±0.4 mV for the control and 7.0±0.4 mV for the pH 6.0 condition, n=8, p<0.05; Fig. 6Db).
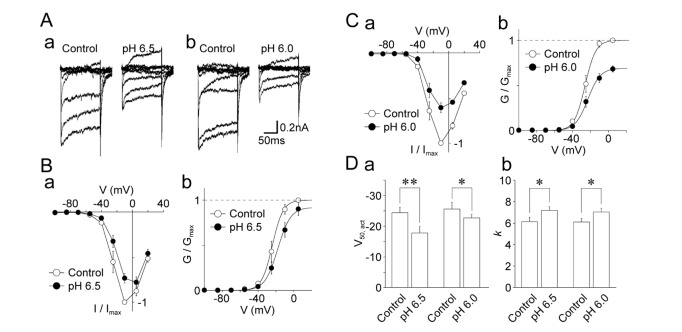 | Fig. 6Effects of acidic pH on the voltage-dependence of voltage-dependent Ca2+ currents.(A) Typical traces of voltage-dependent Ca2+ currents before (left) and during (right) the application of a solution with an acidic pH (a: pH 6.5; b: pH 6.0). (B) Current-voltage (a) and conductance-voltage (b) relationships of voltage-dependent Ca2+ channels in the control (open circles) and pH 6.5 conditions (closed circles). Each circle and error bar represents the mean and standard error of mean (SEM) from 8 experiments. (C) Current-voltage (a) and conductance-voltage (b) relationships of voltage-dependent Ca2+ channels in the control (open circles) and pH 6.0 conditions (closed circles). Each circle and error bar represents the mean and SEM from 10 experiments. (D) Acidic pH-induced changes in V50,act (a) and k (b) of voltage-dependent Ca2+ channels. Each column and error bar represents the mean and SEM from 8 and 10 experiments for the pH 6.5 and pH 6.0 conditions, respectively. *p<0.05, **p<0.01.
|
Go to :
DISCUSSION
Potassium channels play a pivotal role in neuronal excitability by shaping action potentials and regulating resting membrane potentials. Potassium channels are largely divided into three families based on their transmembrane domains (TM), i.e., 2TM, 4TM, and 6TM K+ channels [2526]. The 2TM K+ channel family includes inward rectifier K+ channels (KIR2.x), G-protein-activated inward rectifier K+ channels (KIR3.x), and ATP-sensitive K+ channels (KIR6.x) [2728]. The 4TM channel family includes a number of two-pore domain K+ channels (K2P), such as TREK and TRESK. This family is responsible for the leak K+ currents and act as background K+ channels determining resting membrane potentials in electrically excitable cells [2930]. Voltage-gated K+ channels belong to the 6TM family, and various subtypes, such as KV1.X (shaker-related), KV2.X (shab-related), KV3.X (shalr-related), KV4.X (shaw-related), KV7.X (KCNQ), KV10. X (ERG), KVV11.X (HERG), play roles in the excitability of several tissues. With regard to function, KV3.3, KV3.4, KV1.4, and KV4.x subtypes mediate the A-type K+ currents (IA), which show faster inactivation kinetics [31]. In contrast, KV7.x mediates the slowly inactivating K-type K+ currents (IK), and KV11.x mediates the hyperpolarization of cardiac action potentials [31].
While a number of factors regulate the physiological functions of voltage-gated K+ channels [25], the modulation of voltage-gated K+ currents by the extracellular pH is largely undetermined. A previous study performed in hippocampal CA1 pyramidal neurons has shown that an acidic extracellular pH (pH 6.4) does not change the peak amplitude or the voltage-activation relationship of IA and IK but shifts the inactivation relationship of voltage-gated K+ channels to the depolarization range [32]. In the present study, we recorded the voltage-gated K+ currents from Vmes neurons, which are mediated by a variety of KV subtypes. Although we could not determine which KV subtypes are responsible for the recorded K+ currents owing to the absence of subtype-selective antagonists, both the peak and steady currents might be responsible for the components of IA and IK evoked by depolarization, respectively. We found that a weakly acidic pH (pH 6.5) had no effect on the peak amplitude or the voltage-activation relationship of K+ currents, which is consistent with a previous study [32]. However, we found that the pH 6.0 solution slightly but significantly inhibited the peak amplitude of K+ currents, and shifted the voltage-activation relationship of K+ currents to the depolarization range. These results suggest that the voltage-gated K+ channels expressed in Vmes neurons are difficult to activate at an acidic pH below pH 6.0.
HCN channels are non-selective cation channels that are activated by membrane hyperpolarization. To date, four subtypes of HCN channels, i.e., HCN1, HCN2, HCN3, and HCN4, have been identified [263334]. By providing additional depolarization at the end of action potentials, HCN channels play a crucial role in the generation of repetitive and rhythmic action potentials in electrically excitable cells [353637]. HCN channels are widely expressed in the central and peripheral nervous system, including in nociceptive neurons, and therefore dysfunction of these channels is closely related to hyperexcitable neurological disorders, such as epilepsy and pain [38394041]. Although functional HCN channels are found in Vmes neurons [42], it is still unknown which HCN channel subtypes are expressed in these cells.
To our knowledge, no previous study has been conducted to determine whether the extracellular pH regulates the function of HCN channels. In the present study, we found that a weakly acidic pH (pH 6.5) had no effect on the peak amplitude or the voltage-activation relationship of HCN channels. In the present study, the HCN currents induced by weak hyperpolarization (–80 ~–100 mV) were increased at pH 6.0; however, those induced by strong hyperpolarization (–140~–160 mV) were increased at pH 6.0. Given that the resting membrane potential of Vmes neurons is about –65 mV [1942], and that the membrane potential is unlikely to fall below –100 mV during the repolarization period, the HCN currents elicited by physiological hyperpolarizing stimuli might be increased by acidic pH (pH 6.0). This would suggest that an acidic pH contributes to the increased excitability of Vmes neurons. Similarly, the cyclic AMP-mediated potentiation of HCN channels at near resting membrane potentials results in the activation of a larger HCN current following an action potential in a variety of excitable tissues [40].
Voltage-gated Ca2+ channels are divided into six subtypes, i.e., L, N, P, Q, R, and T-types, based on the pore-forming α-subunits [2643]. Of these, T-type Ca2+ channels have a low activation threshold; however, other Ca2+ channel subtypes need higher voltage stimuli to be activated. The voltage-gated Ca2+ currents recorded from Vmes neurons might be mediated by the various Ca2+ channel subtypes described above. While voltage-gated Ca2+ channels are not directly related to the generation and conduction of action potentials, they play pivotal roles in synaptic transmission at presynaptic terminals, and in Ca2+-dependent cellular signal transduction pathways in somata [4445]. Previous studies have shown that voltage-gated Ca2+ channels are highly sensitive to the extracellular pH [464748]. The proton inhibition of voltage-gated Ca2+ channels seems to be mediated by a direct interaction with the channel pore, as well as changes in the voltage-dependence for activation of Ca2+ channels [32]. In the present study, we found that an acidic pH inhibited the membrane currents mediated by voltage-gated Ca2+ channels more strongly than those of the other voltage-gated ion channels tested. In addition, an acidic pH shifted the V50,act value of voltage-gated Ca2+ channels to the depolarization range, indicating that these channels need further depolarization to become activated under acidic extracellular pH conditions. The increase in the slope factor induced by an acidic pH suggests that the steepness of the voltage-dependence is decreased under acidic pH conditions. The acidic pH-mediated inhibition of voltage-gated Ca2+ channels may suppress action potential-dependent neurotransmitter release from presynaptic terminals in Vmes neurons.
In the present study we have shown the effects of acidic pH on several voltage-gated ion channels in acutely isolated Vmes neurons. The mechanisms underlying the acidic modulation of voltage-gated ion channels are still unknown; however, an acidic pH may affect the various ion channels tested in this study either directly or indirectly. For example, an acidic pH indirectly affects these ion channels by activating ASICs, since Vmes neurons express multiple ASIC subtypes [181924]. However, the acidic pH-induced modulation of voltage-gated ion channels might not be due to the activation of ASICs, as the membrane currents mediated by ASICs disappeared during the prolonged application of an acidic solution. The direct acidic modulation of voltage-gated ion channels, such as the neutralization of negative charges near ion channels and/or the membrane surface, and protonation of extracellular parts of ion channels, may result in shifts in both voltage dependence and channel conductance [324950]. Similarly, we found that an acidic pH shifted the voltage dependence of voltage-gated K+ and Ca2+ channels. Alternatively, the increased number of protons at acidic pH levels might compete with cations for the pore region of voltage-gated ion channels, like voltage-gated Na+ channels [51]. Further studies are required to elucidate the detailed mechanisms underlying the acidic modulation of voltage-gated ion channels.
In general, the generation and conduction of action potentials in single neurons is determined by the summation of activities of various ion channels and receptors. In addition to voltage-gated Na+ channels, which are responsible for the upstroke of action potentials, other voltage-gated ion channels tested in the present study play important roles in the shape and frequency of action potentials in response to generator potentials. In particular, voltage-gated K+ channels and HCN channels play important roles in the generation of repetitive action potentials [3039]. Voltage-gated Ca2+ channels are not related to the generation and conduction of action potentials; however, these channels are involved in neurotransmitter release at the central terminals of Vmes neurons. Therefore, acidic modulation of voltage-gated ion channels related to action potentials and synaptic transmission would have a broad impact on neuronal activity. In this regard, since the somata of Vmes neurons are located in the central region [131415], the excitability of Vmes neurons can be regulated by changes in extracellular pH in peripheral tissues, as well as in the CNS. Further study is needed to evaluate whether the acidic modulation of voltage-gated ion channels shown here affects the unique functions mediated by Vmes neurons, including the regulation of mastication in pathological conditions.
Go to :
 XML Download