

 PDF
PDF ePub
ePub Citation
 Print
Print


INTRODUCTION
With the explosive increase in the usage of mobile phones, public concerns have increased with regard to the potential effects of exposure to radiofrequency electromagnetic fields (RF-EMFs) on human health. The brain is a main concern with regard to the effects of RF-EMF since the head is close to mobile phones during mobile communication.
Various studies have reported that the RF-EMF emitted by mobile phones cause the activation of diverse intracellular pathways including the apoptotic pathway, extracellular signal-regulated kinase pathway and DNA damage response in vitro [123], which may lead to neurological damages. The RF-EMF was also reported to cause neurotransmitter alteration, changes in calcium homeostasis, synapse plasticity, and blood-brain barrier damage as well as various cognitive disorders in vivo, which may affect behavior [456]. Importantly, recent reports have shown that RF-EMF exposure facilitates autophagy in mammalian cells [78]. Autophagy is a catabolic process of cellular degradation responsible for degrading injured organelles or unusual protein aggregates, which is activated in the presence of various stressors [9]. Thus, autophagy may function to protect cells from various stressors as well as maintain cellular homeostasis [9].
The cerebral cortex is a thin layer comprised of folded bulges (gyri) and deep furrows (sulci) in the outside brain tissue [10]. The cerebral cortex is a highly developed region in the human brain and plays a specific role in memory, thought, attention, perception, and language [11]. Dysfunctions of the cerebral cortical region could be related to various neurodegenerative diseases such as Alzheimer's disease and Lafora disease and various cognitive disorders [1213].
The brainstem is the posterior region of the brain, which connects the cerebrum with the spinal cord [14]. It is localized deep within the brain and consists of the midbrain, medulla oblongata, and the pons. The brainstem plays an important role in the regulation of cardiac and respiratory functions such as breathing, heart rate, and blood pressure [1415]. Abnormality of the brainstem has been strongly associated with autism spectrum disorders in children and various cognitive disorders such as dysphagia, sleeping difficulties, and hearing and balance problems [1617].
RF-EMF studies of effects on the cerebral cortex and brainstem have reported that RF-EMF exposure induced physiological alteration, metabolic change and neurotoxicity in human cerebral cortex and cultured cortical neurons [181920] as well as the alteration of glycine receptors for neurotransmitters in the auditory brainstem of mice [21].
Previously, we demonstrated that 12 week exposure of mice to RF-EMF up-regulates the autophagy pathway in specific interior regions of the brain. In this study, C57BL/6 mice were exposed to 835 MHz RF-EMF at specific absorption rate (SAR) values of 4.0 W/kg for 5 hours daily to examine whether autophagy is also triggered in either the cerebral cortex or brainstem of mice brain in response to RF-EMF exposure for 4 weeks. Presently, we tested the effect of RF-EMF exposure for a shorter period of 4 weeks on autophagy in two differently localized brain tissues: the cerebral cortex and the brainstem, which are the most external and interior regions, respectively. Additionally, we elucidated the altered molecular mechanisms for apoptotic cell death in the mice brain following RF-EMF exposure for 4 week. After RF-EMF exposure, autophagic and apoptotic changes of gene and protein levels were analyzed in the cerebral cortex and brainstem using RT-PCR and Western blotting. For further convincing evidence of morphologic changes following autophagy induction, the fine structure of cortical or brainstem neurons following RF-EMF exposure for 4 weeks were observed by transmission electron microscopy (TEM).
Go to : 
METHODS
Mice
C57BL/6 mice (6-week-old male) weighing 25~30 g were purchased from Daehan Bio Link (DBL, Chungbuk, South Korea). The mice were maintained under specifically controlled conditions (ambient temperature 23±2℃, 12-h light/dark cycle). Food pellets (DBL, Chungbuk, South Korea) and water were supplied ad libitum. After a 7-day adaptation period, the mice were assigned to sham exposure or RF exposure for 4 weeks. All procedures complied with National Institutes of Health guidelines of the NIH for animal research and were approved by Dankook University Institutional Animal Care and Use Committee (IACUC; DKU-15-001), which adheres to the guidelines issued by the Institution of Laboratory of Animal Resources.
RF-EMF exposure system
Mice had a one week adaptation period prior to RF-EMF exposure. Mice were mouse cage for RF-EMF exposure for 5 hour daily. Following one week adaptation, mice were exposed to 835 MHz RF-EMF using a Wave Exposer V20 as described in detail [822]. Whole body exposure was at a specific absorption rate (SAR) value of 4.0 W/kg for 5 hours/day for 4 weeks for five randomly allocated mice. The other five mice received sham treatment for 4 weeks. The sham treated control groups were kept under the same environmental conditions and treated the same circular pattern as the RF-exposed groups without RF-EMF exposure. The sham-treated and RF-exposed mice could move freely in their cage. The cage inside RF-EMF generator was 43 cm long×37 cm wide×18 cm high. RF-EMF exposure was a top horn antenna to the lower mouse cage. The bottom and wall of the cage were covered by ceramic wave absorption material. The intent was to mimic RF with SAR exposure in the open environment, to exclude the possibility of the influence of the number of mice on exposure. Importantly, the RF exposure apparatus was equipped with automatic light system, air conditioning, and water dispenser. The mice were not restricted in movement in the cage during the exposure. All the experiments have done in our animal facility, which were maintained in constant temperature.
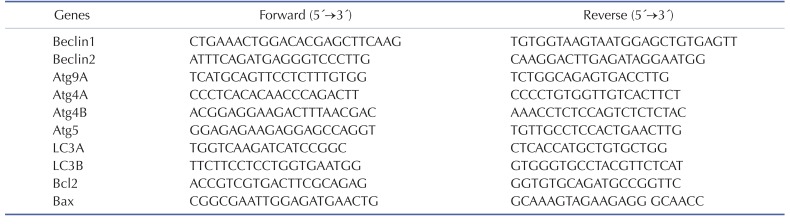
Quantitative real-time PCR and semi-quantitative RT-PCR
Total RNA was purified from the whole cerebral cortex of the both group of mice by using TRIzol reagent (Thermo Fisher Scientific, USA). RNA was reverse transcribed to cDNA using MMLV Reverse-Transcriptase (Bioneer, South Korea) and an oligo-d(T)18 primer. Quantitative RT-PCR reactions were performed with Rotor-gene SYBR Green supermix Kit (QIAgen, Germerny) and fluorescence was measured using Rotor Gene PCR Cycler (QIAgen, Germerny). The expression levels of the genes were normalized to that of GAPDH as a housekeeping gene. GAPDH primer was purchased from QIAgen (Germerny). The primers (Table 1) used for qRT-PCR and sqRT-PCR were synthesized from Bioneer or Cosmogenetech (South Korea). Three biologically independent experiments were performed and each PCR reaction was done in triplicate. The relative levels of specific mRNA were calculated by normalizing to expression of GAPDH by the 2−ΔΔCt method (n=5). Also, the expression values of the RF-exposed groups were normalized to those of the sham-exposed group. Semi-quantitative RT-PCR reactions were carried out using PCR PreMix (Bioneer, South Korea). Subsequently, sqPCR product of each gene was electrophoresed in 1.5% agarose gel and signal intensity of PCR product was visualized the Syto 60 (Li-Cor, USA)-stained DNA using the Odyssey infrared imaging system (Li-Cor, USA).
Western blotting analysis
Sham-exposed or RF-exposed mice were quickly sacrificed and the cerebral cortex and brainstem were rapidly dissected from mouse brain. Dissected cerebral cortex was lysed with RIPA lysis buffer (ATTO, Japan) which supplemented with protease inhibitor and phosphate inhibitor cocktail (ATTO, Japan). Whole cortical lysates were then homogenized and sonicated briefly under the cold condition. Concentration of proteins was measured using a Bio-Rad DC™ protein assay (Bio-Rad, USA) and total proteins were subjected to a SDS-polyacrylamide gel electrophoresis and transferred with transfer buffer to polyvinylidene difluoride (PVDF) transfer membrane (ATTO, Japan). Protein bands were visualized using Odyssey infrared imaging system (Li-Cor, USA). The intensity of band was then quantitated and normalized using α-tubulin as an internal control.
Transmission electron microscopy (TEM)
The cerebral cortex and brainstem dissected from mice brain were fixed immediately in 2% glutaraldehyde-2% paraformaldehyde in 0.1M phosphate buffer (pH 7.4) for 2 hours at 4℃. Following three washes in phosphate buffer, the brain tissues were post-fixed with 1% osmium tetroxide on ice for 2 hours and washed three times, all in phosphate buffer. The tissues were then embedded in Epon 812 mixture after dehydration in an ethanol and propylene oxide series. Polymerization was conducted with pure resin at 70℃ for 24 hours. Ultrathin sections (~70 nm) were obtained with an ultramicrotome (MT-X, RMC, Tucson, AZ, USA) and then collected on 100 mesh copper grids. After staining with 2% uranyl acetate (15 min) and lead citrate (5 min), the sections were visualized using transmission electron microscopy (TEM) (Technai G2 Spirit Twin, FEI, Hillsboro, OR, USA) at 120 kV.
Statistical analysis
All data are presented as the mean±SEM (n=5). The n values represent the number of animals used in experiments. The significance for all pairwise comparisons of interest was assessed by two-tailed Student's t-test with probability values of p<0.05 considered significant. Significance was defined as p-value; *p<0.05, **p<0.01, ***p<0.001.
Go to :
RESULTS
Autophagy related genes significantly increased in the cerebral cortex but not in the brainstem
To explore whether autophagy is induced in the cerebral cortex or brainstem in the mice in response to 4 weeks of RF-EMF exposure, the expressional levels of several autophagy related genes, specifically Beclin1/2, Atg9A, Atg4A/B, Atg5 and LC3A/B, were evaluated by using either quantitative RT-PCR or semi-quantitative RT-PCR. The qRT-PCR analysis indicated that most of the autophagy genes significantly increased by approximately 1.5~3.0 fold in expression levels in the cerebral cortex of mice exposed to RF-EMF for 4 weeks (Fig. 1). Most autophagic related genes in the brainstem did not present significant changes but their expression levels generally displayed a modest change following RF-EMF exposure (Fig. 2). Additionally, semi-quantitative PCR was conducted to validate the expression levels of altered genes identified by qPCR. The results of sqPCR confirmed patterns similar to the qRT-PCR results for the expression levels shown of most autophagic genes in the cerebral cortex and the brainstem of mice following 4 weeks of RF exposure (Figs. 1i and 2i). The results of RT-PCR indicated that 4-week exposure to RF-EMF could activate the autophagy pathway in the cerebral cortex but not in the brainstem of mice.
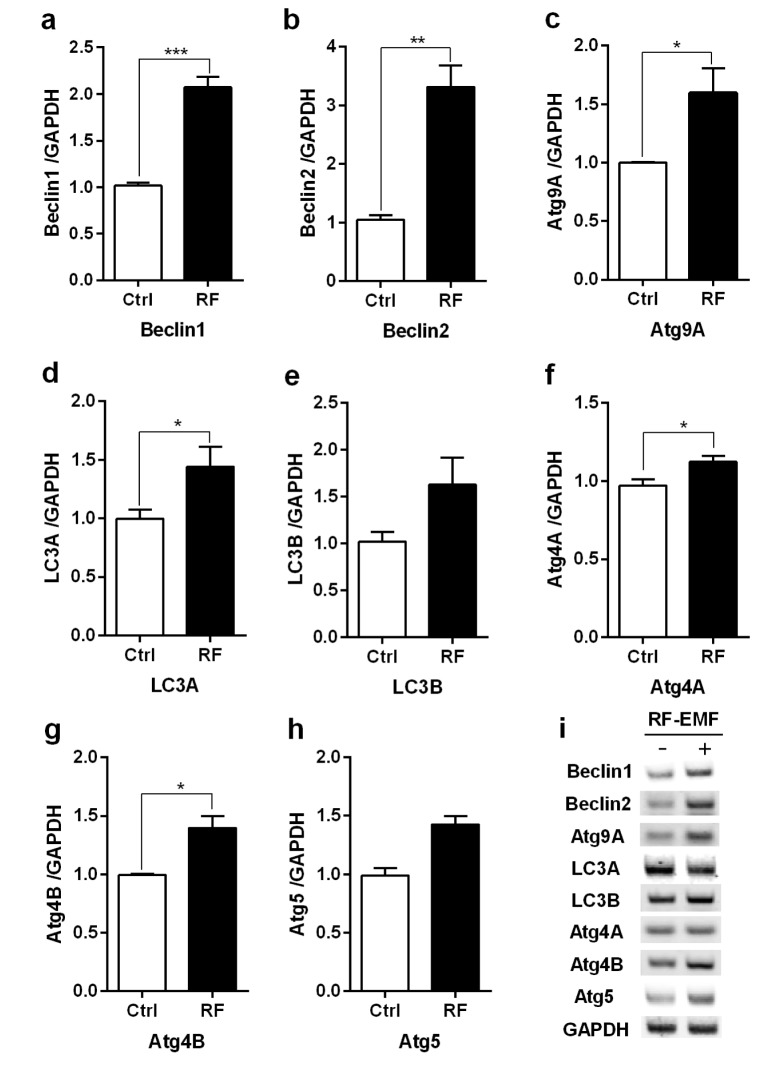 | Fig. 1The transcription levels of autophagic-related genes in the cerebral cortex of mice in response to RF-EMF exposure for 4 weeks.Total RNA was extracted from the cerebral cortex of sham-exposed and RF-EMF exposed mice and were analysed by quantitative real-time PCR to determine the expression level of autophagy genes. (a~h) Quantification of Atg4A/B, Beclin1/2, Atg5, Atg9A, LC3A/B mRNA transcripts by qRT-PCR. (i) 1.5% Agarose gel electrophoresis indicating the differential expression of autophagy genes by sqRT-PCR. The expressional values of the cerebral cortex of the RF-EMF exposed mice were normalized to those of the sham-exposed mice. The relative transcriptional levels of each gene were calculated by normalizing to the expression of GAPDH using the 2−ΔΔCt method (n=5). Each bar represents the mean±SEM of three independent experiments. Statistical significance was evaluated using a t-test: *p<0.05, **p<0.01, ***p<0.001.
|
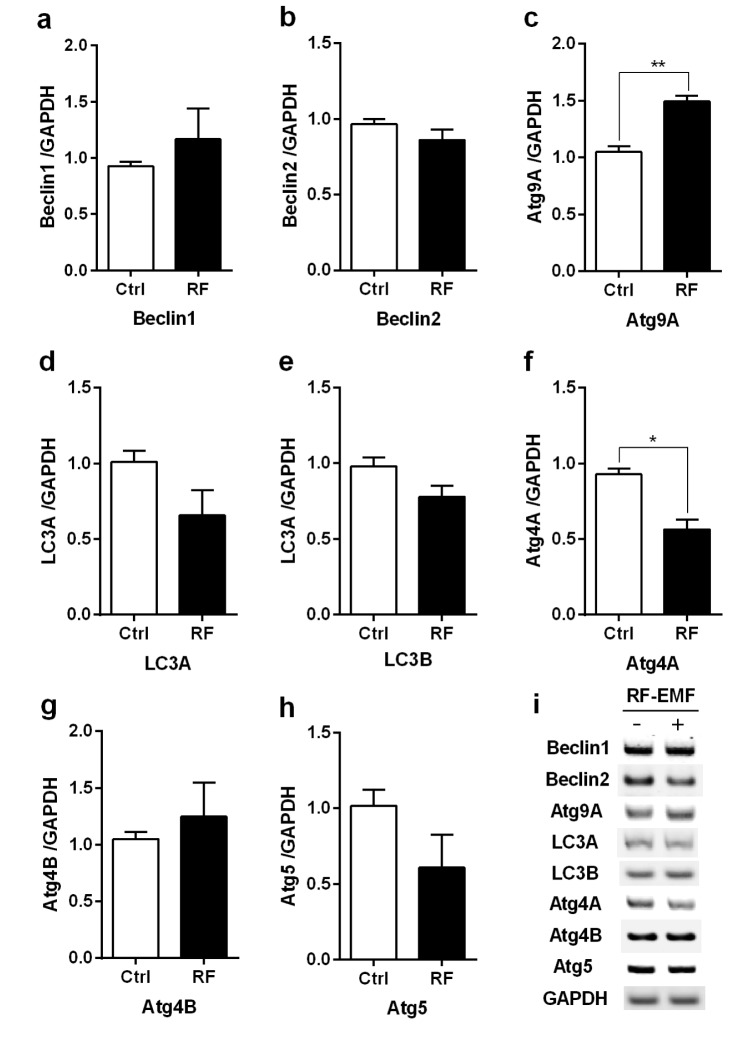 | Fig. 2The transcription levels of autophagic-related genes in the brainstem of mice following 4 weeks of exposure to RF-EMF signals.Total RNA was extracted from the brainstem of sham-exposed and RF-EMF exposed mice and were analysed for the expressional levels of autophagy genes by quantitative real-time PCR. (a~h) Quantification of Atg4A/B, Beclin1/2, Atg5, Atg9A, LC3A/B mRNA transcripts by qRT-PCR. (i) 1.5% Agarose gel electrophoresis showing differential expression of autophagy genes by sqRT-PCR. The expressional values of the cerebral cortex of RF-exposed mice were normalized to those of the sham-exposed mice. The relative transcriptional levels of each gene were calculated by normalizing to the expression of GAPDH using the 2−ΔΔCt method (n=5). Each bar shows the mean of three independent experiments with SEM. Statistical significance was evaluated using a t-test: *p<0.05, **p<0.01.
|
LC3B-II and Beclin1 protein is significantly upregulated in the cerebral cortex but not in the brainstem
To validate the transcriptional level of autophagy, we examined the expressional level of the autophagy proteins LC3B-II and Beclin1, which are crucial for the formation of autophagosomes in response to environmental stress [23]. Maximized total proteins prepared from the cerebral cortex and brainstem were used for Western blot with anti-LC3B antibody (Cell Signaling Technology, Beverly, MA, USA) and both LC3B-I (16 kDa) and LC3B-II (14 kDa) proteins were detected.
The expression levels of both LC3B-II and Beclin1 proteins were significantly up-regulated in the cerebral cortex of mice exposed to RF-EMF for 4 weeks (Fig. 3a). However, brainstem expression of LC3B-II and Beclin1 proteins showed insignificant or no changes (Fig. 3b).
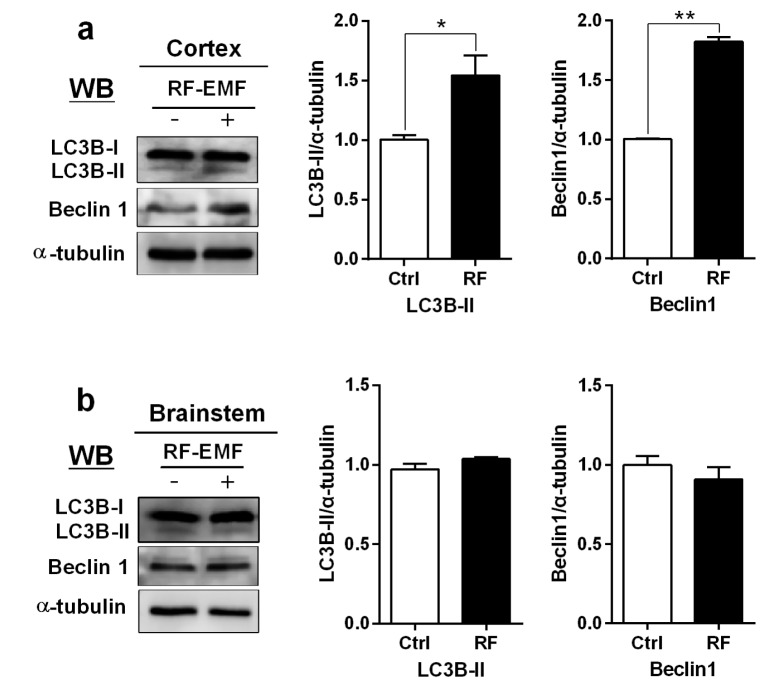 | Fig. 3Expression level for LC3B-II and Beclin1 proteins in the cerebral cortex and brainstem of mice after 4 weeks of exposure to RF-EMF radiation.(a) Total lysates extracted from the cerebral cortex and brainstem of mice was subjected to 15% SDS–PAGE and western-blotted with antibody against LC3B-II and Beclin1 (Cell Signaling Technology, Beverly, MA, USA). α-tubulin was used as the internal loading control. (b) The band intensity of western blot was quantified by densitometry. The protein level was normalized relative to α-tubulin. Each bar shows the mean of three independent experiments with SEM. Statistical significance was evaluated using two tailed t-test: *p<0.05, **p<0.01.
|
Apoptosis is down-regulated in the cerebral cortex but augmented in the brainstem
To explore the correlation between apoptosis and autophagy in response to RF-EMF stressor, the expression level of apoptotic components such as Bcl2 (anti-apoptotic member) and Bax (proapoptotic member) in the cerebral cortex and the brainstem of mice following 4 weeks of RF-EMF exposure were analyzed by RT-PCR and immunoblot. The apoptotic level of the cerebral cortex indicated that apoptotic components of both Bcl2 and Bax were generally decreased in their transcripts and proteins in the cerebral cortex after RF-EMF exposure (Fig. 4A). However, in the brainstem, the mRNA level of Bax was significantly increased but Bcl2 was slightly reduced in response to the RF-EMF signal. Also, the protein level of Bax was significantly up-regulated by about 1.5 fold and conversely, Bcl2 showed a significant decrease in the brainstem following RF-EMF exposure (Fig. 4B). This result indicated that 4 weeks of exposure to RF-EMF may inhibit the apoptotic pathway but induces mainly autophagy processes in the cerebral cortex of mice. In contrast, in the brainstem, apoptosis may be activated instead of autophagy in the presence of RF-EMF stressor.
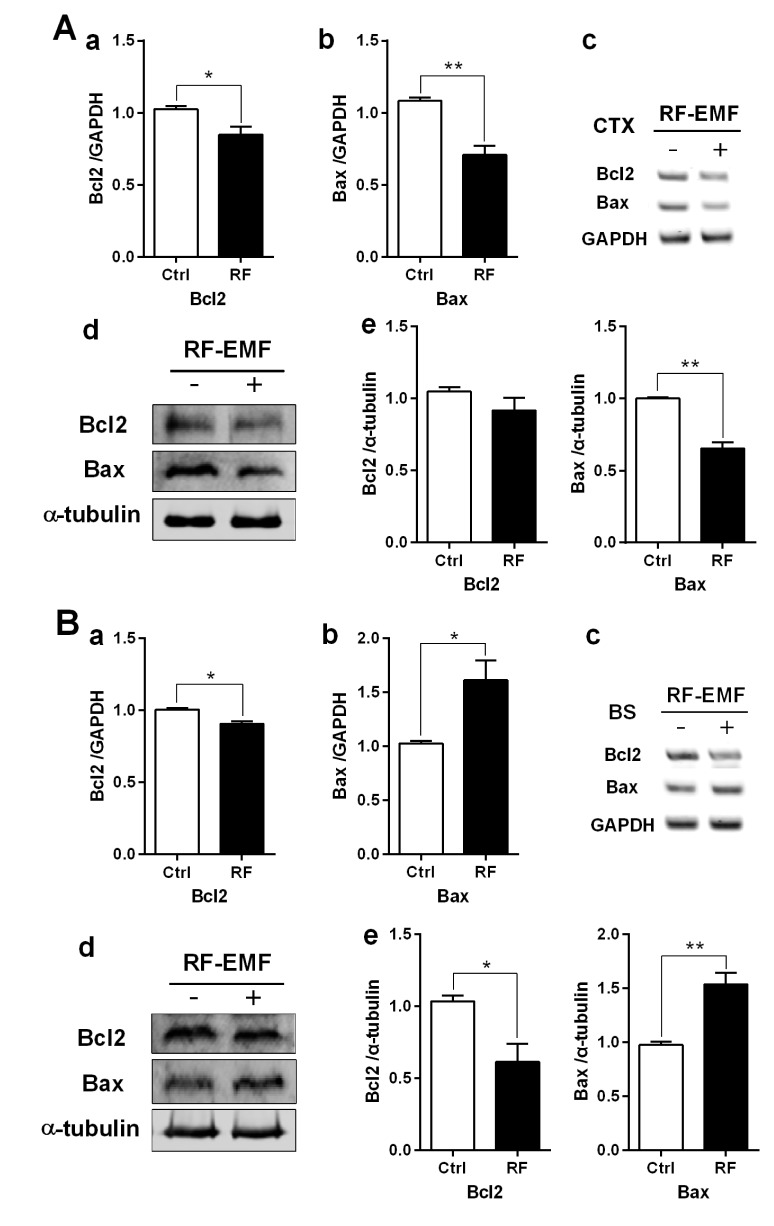 | Fig. 4The expression levels of apoptosis related genes in the cerebral cortex or brainstem of mice following 835 MHz RF-EMF exposure for 4 weeks.The cerebral cortical (A) or brainstem (B) RNA and proteins extracted from sham-exposed and RF-exposed mice were analysed to determine the expression level of apoptotic genes or proteins. (a~b) Quantification of Bcl2 and Bax mRNA transcripts by qRT-PCR. (c) 1.5% Agarose gel electrophoresis showing differential expression of Bcl2 and Bax by sqRT-PCR. The expression values of the cerebral cortex of RF-exposed mice were normalized to those of the sham-exposed mice. The relative mRNA levels of each gene were calculated by normalizing to the expression of GAPDH using the 2−ΔΔCt method (n=5). (d) Total proteins were subjected to 15% SDS–PAGE and immunoblotted with antibodies against Bcl2 and Bax. α-tubulin was used as the loading control. (e) The intensity of western blot bands was quantified by densitometry. The protein level was normalized relative to α-tubulin. Each bar represents the mean±SEM of three independent experiments. Statistical significance was evaluated using a t-test: *p<0.05, **p<0.01.
|
Autophagy is accumulated in the cerebral cortical neuron
Following confirmation of the impact of RF-EMF on autophagy with both mRNA and proteins in the cerebral cortex, we further examined whether more autophagic structures accumulate in cerebral cortical neurons or brainstem neurons in response to 4 weeks of RF-EMF exposure using TEM. The results indicated that a large number of autophagic structures such as autohagosomes and autolysosomes were concentrated in the cerebral cortical neurons of the RF-EMF exposure group compared to either sham-control group (Figs. 5c and d). However, fewer autophagic structures were found in the brainstem neurons of mice following RF-EMF exposure (Fig. 5b). In terms of the process of autophagic structure, we observed that mature autophagosomes that engulfed intracellular organelles were fused to lysosomes, which became autolysosomes in the cerebral cortical neurons (Fig. 5d). These results showing the accumulation of autolysosomes strongly indicated that 4-week RF-EMF exposure in mice induced autophagy in the cerebral cortical neurons but not in the brainstem.
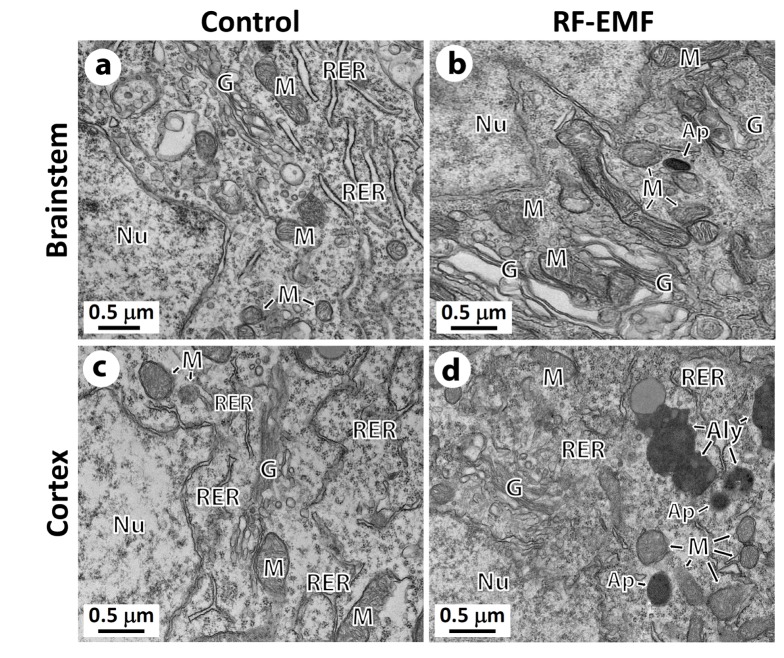 | Fig. 5Representative ultrastructure images showing the autophagic structure in the neuronal cell body of the cerebral cortex or brainstem following 4 weeks of exposure to RF-EMF.Ultrastructural comparison of autophagy between sham control vs RF-EMF exposed group. Representative TEM micrographs were acquired from sham control (a and c) and RF-EMF exposed mice (b and d). Autophagosome (Ap) and autolysosome (Aly) were clearly observed in RF-EMF exposed cortex. Abbreviations are: Ap, autophagosome; Aly, autolysosome; G, Golgi apparatus; M, mitochondria; N, nucleus; Ph, phagophore; RER, rough endoplasmic reticulum. Size bars: 500 nm.
|
Go to :
DISCUSSION
With the expanding usage of wireless mobile phone communication in daily life, public concerns have increased regarding the biological health effects of exposure to RF-EMFs on the nervous system in the brain. Although there have been some conflicting data, numerous in vivo and in vitro studies have reported the effect of mobile phones on the central nervous system, especially intracellular mechanisms suggesting alterations in cell cycle control, DNA repair and apoptosis [123]. Importantly, recent investigations have reported that RF-EMF exposure initiates the autophagy pathway in mammalian cells [78].
In this study, we provide evidence for the induction of autophagy following 4-week exposure to 835 MHz RF-EMF with 4.0 W/kg SAR and demonstrate a significant increase in the autophagic levels of genes and proteins in the cerebral cortex but not in the brainstem in response to RF-EMF signals (Figs. 1, 2 and 3), indicating the accumulation of autophagosomes.
Previously, we reported that 12-week exposure to RF-EMF induces autophagy in the striatum and hypothalamus in mice brain, whereas 4-weeks of RF-EMF exposure does not activate the autophagy mechanism in the striatum and hypothalamus in mice brain [8]. However, we found that 4-week exposure of mice to RF-EMF could induce strong autophagic responses in the cerebral cortex. As previous report [8], autophagy pathway was not significantly activated in the brainstem at the 4 week of RF-EMF exposure. We confirmed that 4-week exposure of mice to RF-EMF resulted in strong autophagic response in the cerebral cortex but not in the brainstem. One clear reason may be due to the fact that the cerebral cortex is relatively external in the brain so the exposure to RF-EMF is more direct, whereas the brainstem is the bottom-most portion of the brain and therefore has less positional or structural sensitivity to RF-EMF compared to the cerebral cortex. In other words, the cerebral cortex is locationally more effective for the induction of autophagy.
Autophagy is a cellular degradation mechanism that eliminates damaged organelles or unusual protein aggregates, which could otherwise lead to various neurodegenerative diseases [924]. Autophagy-related genes for RT-PCR analysis play a crucial role for autophagosomal formation [23]. Autophagosomal formation can be initiated by the formation of a multi-protein complex containing Beclin1/2 and the class III phosphoinositide 3-kinase (PI3K CIII, also known as Vps34) complex, which drives vesicle nucleation. The transmembrane protein Atg9A/B may also recruit lipids to the phagophore [2526]. Microtubule-associated protein 1 light chain 3 (LC3)-II is associated with autophagic vesicles [27]. LC3 undergoes post-translational modifications in which it is cleaved by cysteine protease Atg4A/B during autophagy [28]. Importantly, an E3 ubiquitin ligase-like enzyme Atg5 forming complex with Atg12 and Atg16L1 regulates autophagosome elongation and this complex is required for LC3-I combination with phosphatidylethanolamine (PE) to form LC3-II (LC3-PE) [2629]. Little is known the signaling mechanisms underlying autophagy induction and differential responses between cerebral cortex and brainstem in vivo model following RF-EMF exposure. Recently, Nixon et al. (2013) reported that various cellular stress signals suppress mTOR complex 1 (TORC1), thus activating uncoordinated (UNC) 51-like kinase 1 and 2 (ULK1 and ULK2) and turning on autophagy [30]. ULK1 phosphorylation is mainly regulated by the TORC1 but may be activated by AMP-activated protein kinase (AMPK). Thus, RF-EMF exposure could function as initiation autophagosome formation via mTOR inhibition or AMPK activation. This results in the phosphorylation of ULK1 at sites that activate it and catalyze phosphorylation of other components such as AMBRA (activating molecule in Beclin-1-regulated autophagy), a component of the PI3K CIII complex, which then initiatevesicle nucleation [30]. So, we are planning to study the possible mechanisms in the up-stream genes of autophagy such as AMPK and ULK1 are upregulated in mice brain after RF-EMF exposure. Another possible mechanism is that inhibition of a particular miRNA sequence is modulated to autophagy activation after EMF exposed in vitro model [31]. LF-EMF exposure strongly decreases miR-30a expression and consequently Beclin1 levels were increased in SH-SY5Y cells. In parallel, Zhu et al. (2009) has reported that miR-30a inhibits Beclin1 expression, which causes decrease in autophagy activity [32]. Therefore, it could suggest that miR-30a suppression is modulated to autophagy induction in response to LF-EMF exposure in SH-SY5Y human neuroblastoma cells.
In addition, RF-EMF exposure was reported to cause the upregulation of the caspase-3 dependent apoptotic pathway in primary cultured rat brain tissues [133]. Also, the activation of apoptosis or autophagy can be regulated by the inhibition of key factors like Beclin1 or Bcl2, respectively [3435]. Thus, we checked the apoptotic levels in the cerebral cortex and brainstem after 4 weeks of exposure to RF-EMF stressor. Expecially, we confirmed the relationship between apoptosis and autophagy, indicating the down-regulation of the apoptotic level in the cerebral cortex during autophagic induction with an increase in the apoptotic factor (Bax) in the brainstem, which was inactivated following RF-EMF exposure (Fig. 4). Based on our knowledge, there is no study addressing what mechanisms make the differential responses of brain regions after exposure of RF-EMF. One simple hypothesis on this issue is the different sensitivity or different location of the cerebral cortex and brainstem could explain the differential cues on cell fates to RF-EMF exposure. Also, due to the differential microenvironments on brain regions, neuronal cells in brainstems and/or cortex responses to RF-EMF differently. Importantly, the same cellular stressor can lead to two different responses, namely apoptosis or autophagy in the same cell [26]. The outcome depends on the sensitivity thresholds that activate either apoptosis or autophagy. One possibility is the level of calcium channels which is an important factor for regulation of calcium signaling pathway by control entry of calcium ions across the plasma membrane [36]. Previous reports showed that the mRNA levels of calcium channels are differently expressed in different tissues of mice brain after RF-EMF exposure [37]. This may be influenced the prominent activation of apoptosis in brainstem, since calcium influx via voltage-gated calcium channels which control entry of calcium ions is an important for the regulation of apoptosis [3839].
Moreover, we showed the accumulation of autophagic structures in the cerebral cortical neurons of RF-EMF exposed mice using TEM (Fig. 5). This morphological change is consistent with the increase in transcriptional level and protein production in the cerebral cortex following RF-EMF exposure. Additionally, autolysosomes which autophagosomes fused with lysosomes (autophagy flux) were observed in Fig. 5d, which confirmed that 4-week exposure to RF-EMF induced autophagy in the cerebral cortical neurons.
The cerebral cortex is a highly developed brain region in humans and processes specific functions including memory, thought, attention, perception, and language [11]. Dysfunctions of the cerebral cortical region may be related to Alzheimer's disease, Lafora disease and various cognitive disorders [1213]. The brainstem connects the cerebrum with the spinal cord and plays a key role in the regulation of cardiac and respiratory functions such as breathing, heart rate, and blood pressure [1415]. Abnormality of the brainstem has been strongly associated with autism spectrum disorders in children as well as various cognitive disorders [1617]. Furthermore, studies on the effects of RF-EMF on the cerebral cortex and brainstem have reported physiological alteration, metabolic change and neurotoxicity in the human cerebral cortex [181920] as well as neurotransmitter alteration in the auditory brainstem of mice [21].
Thus, our results strongly suggest that autophagy can be triggered in the cerebral cortex following RF-EMF exposure as a physiologic means of adaptation to cellular stress for 835 MHz radiofrequency at 4.0 W/kg SAR strength for 4 weeks. However, apoptosis can be induced in the brainstem after RF-EMF exposure although the reason is unclear. This may be due to the fact that the structure or function of the brainstem is more sensitive to apoptosis by 835 MHz RF-EMF compared to the cortical region. Further study may be needed to show strong evidence for apoptotic induction in the brainstem in response to our specific RF-EMF signal using various experimental methods such as immunohistochemistry.
In conclusion, 4 weeks of exposure to 835 MHz RF-EMF at 4.0 W/kg SAR induced the autophagy pathway in the cerebral cortex, but not in the brainstem, of mice. The present results may provide insight into the adaptation process during 4 weeks of RF-EMF stress and may also offer a protective mechanism against RF-EMF stimuli, which will be beneficial for maintaining normal brain function.
Go to :
 XML Download