

 PDF
PDF ePub
ePub Citation
 Print
Print


INTRODUCTION
5-Hydroxytryptamine (5-HT)3 receptors are the only ligand-gated ion channels (LGIC) among the subfamilies of 5-HT receptors. Based on structural and functional properties, 5-HT3 receptors are members of the Cys-loop family of LGIC, which includes glycine, GABAA and nicotinic acetylcholine (nACh) receptors [1234]. These receptors are widely distributed in the central and peripheral nervous systems [567]. Given their expression at both pre- and post-synaptic terminals, their activation modulates the release of various neurotransmitters such as dopamine, cholecystokinin, GABA, substance P and acetylcholine. Moreover, antagonism of 5-HT3 receptors results in antiemetic [8], anxiolytic [9], and antipsychotic effects [10] suggesting an important role of this receptor in neuronal function. 5-HT3 receptors are remarkably sensitive to a number of pharmacological agents, thus constituting important therapeutic target for the treatment of neuronal disorders such as schizophrenia, depression and anxiety [37]. Furthermore, it has been reported that 5-HT3 receptor agonist, 1-(m-chlorophenyl)-biguanide (m-CPBG), increases the duration of fully kindled seizures and facilitates the developmental seizure process in a kindling model of epilepsy [11]. This result suggests that 5-HT3 receptor activation leads to an increase in neuronal excitation [1213].
Lamotrigine [3,5-diamino-6-(2,3-dichlorophenyl)-1,2,3-trazine] is an antiepileptic drug effective in treating most seizure types [14]. Although the cellular and molecular mechanisms of lamotrigine are still unknown, it has been proposed that the antiepileptic effects can be ascribed to the inhibition of voltage-gated Na+ channels, resulting in blockade of the release of excitatory amino acid transmitters [15]. It has been also reported that lamotrigine acts as an open channel blocker for the nACh receptor [1617], and alters 5-HT release in a rat brain [1819]. Moreover, lamotrigine modulates 5-HT uptake in rats [20]. Altogether these results suggest lamotrigine as a potential agent in the treatment of neuropsychiatric disorders such as schizophrenia, bipolar disorder, and anxiety disorders [21].
A study using a binding assay method reported that lamotrigine weakly binds to 5-HT3 receptors [22]. However, no studies have addressed its role on 5-HT3 receptors using electrophysiological techniques to better assess the functional outcomes of its binding to the receptor. Thus, using the whole-cell patch clamp in combination with a fast drug application approach, we tested the effects of lamotrigine on 5-HT3 receptor function. Based on our results we suggest an additional pharmacological mechanism with therapeutic potential for neuropsychiatric disorders associated with 5-HT3 receptor dysfunction.
Go to : 
METHODS
Cell culture
NCB-20 neuroblastoma cells (kindly provided by Dr. Lovinger, National Institute on Alcohol Abuse and Alcoholism, USA) were maintained under conditions previously described conditions [23]. Frozen cell stocks were maintained in liquid nitrogen, and thawed as needed. Cells were maintained in a medium containing 90% Dulbecco's modified Eagle's medium, 10% fetal bovine serum, and 1% hypoxanthine aminopterin thymidine supplement, and were cultured in an incubator containing 5% CO2 at 37℃. Cells were seeded on 35 mm culture dishes at least 24 h prior to electrophysiological experiments.
Electrophysiology
For whole-cell patch-clamp recordings, NCB-20 cells were plated on cover glasses (12 mm diameter; Fisher Scientific, Pittsburgh, PA, USA) and transferred to the recording chamber (RC-13, Warner Instruments, Hamden, CT, USA) mounted on the stage of an inverted microscope (IX70, Olympus, Tokyo, Japan) at room temperature (21~24℃), as previously described [23]. Cells were continuously perfused with an extracellular solution containing (in mM) 150 NaCl, 2.5 KCl, 2.5 CaCl2, 10 N-(2-hydroxyethyl)piperazine-N′-2-ethansulfonic acid (HEPES), and 10 D-glucose (pH adjusted to 7.4 with NaOH and osmolality adjusted to 340 mOsm/kg with sucrose) at a rate of 2~3 ml/min through the theta glass micropipette (see below in Drug preparation and application) . Patch pipettes were pulled from borosilicate glass capillaries (1B150-4, World Precision Instruments, Sarasota, FL, USA) using a programmable horizontal micropipette puller (P-97, Sutter Instrument, Novato, CA, USA). Pipette tips had resistances of 2.0~3.0 MΩ when filled with an internal solution containing (in mM) 140 CsCl, 2 MgCl2, 5 ethylene glycol bis(2-aminoethylether)-N,N,N′,N′-tetraacetic acid (EGTA), 10 HEPES, (pH adjusted to 7.2 with CsOH, osmolality adjusted to 310 mOsm/kg with sucrose). Whole-cell currents were recorded using an Axopatch 200B amplifier and pClamp 9.2 software (Molecular Devices, Sunnyvale, CA, USA). All experiments were carried out at a holding potential of –50 mV unless otherwise stated. The current signals were filtered at 2 kHz, digitized at 10 kHz, and saved on a PC using DigiData 1322 and pClamp 9.2 software (Molecular Devices). The liquid junction potentials between the pipette and bath solutions were 3~5 mV, and were zeroed before a gigaohm seal was formed. Capacitive currents were compensated with analog compensation, but leak subtraction was not used in this study.
After achieving a whole-cell configuration, a variable amount of current run-down was typically observed for several minutes. To minimize run-down condition, we waited at least 10 min after getting whole-cell configuration, and drug applications were carried out at 2 min intervals. At the end of the experiments, 5-HT-induced currents that decreased more than 20% in comparison with the first current were excluded from the data analysis.
Drug preparation and application
A fast drug application technique was used to induce the 5-HT3 receptor currents and to evaluate the drug effects as previously described [23]. After establishing a whole-cell configuration, cells were lifted up and positioned in front of one side of theta glass micropipette, which was pulled from the theta glass tubing (Clark Borosilicate Theta, Warner Instruments; 2 mm outer diameter, 1.4 mm inner diameter, 0.2 mm septum thickness) to an outer diameter of ~300 µm, and continuously perfused with an extracellular solution. The extracellular solution, which contained agonists with or without drug, flowed through a different side of the theta glass micropipette. Solutions were rapidly switched around the cell by the linear movement of theta glass micropipette mounted on a piezoelectric translator (P-601 PiezoMove Z Acturator, Physik Instrumente, Karlsruhe, Germany), which displaced the theta glass micropipette laterally so that the cell could be exposed for a defined period of time to the drug-containing solution, and then rapidly returned to the drug-free extracellular solution. The piezoelectric translator was controlled by a Piezo Servo Controller (E-625, Physik Instrumente) and triggered by pClamp 9.2 software (Molecular Devices). The rate of solution exchange was usually 24.4±5.3 msec (n=11) in the open pipette tip configuration [24]. Solution flow was driven by gravity from reservoirs placed above the preparation, and the application of solutions was controlled by a perfusion valve control system (VC-8, Warner Instruments, Hamden, CT, USA).
The agonist and other drugs were diluted in the extracellular solution from stock solutions in distilled water. Lamotrigine was dissolved in dimethyl sulfoxide (DMSO, 30 mM stock) and further diluted in the extracellular solution with or without the agonist. Lamotrigine was purchased from Santa Cruz Biotechnology (Dallas, Texas, USA). All other chemicals were purchased from Sigma Chemicals (St. Louis, MO, USA). Cell culture reagents were obtained from Gibco BRL (Rockville, MD, USA). Solutions were freshly prepared prior to each experiment.
Data analysis and statistics
Peak amplitudes of currents were measured using Clampfit 9.2 software (Molecular Devices), by determining the differences in currents before and during agonist application. The rise slopes of current were also analyzed to evaluate 5-HT3 receptor activation using the built-in statistical tools in Clampfit 9.2 software. Since peak amplitudes of the 5-HT3 receptor currents induced by agonist application varied among cells, data were normalized to the maximal values in each cell. Receptor desensitization was measured as the decay in the 5-HT3 receptor currents in the continuous presence of the agonist (10 sec). Receptor deactivation was measured as the current decay in response after brief application of the agonist for 10 msec. Both current decays by desensitization and deactivation were fitted to a double exponential function, then analyzed and compared the time constants for fast and slow component of current decays.
Concentration–response data were fitted to a sigmoid curve, as calculated by the four-parameter logistic equation using Prism 4.0 software (GraphPad Software, San Diego, CA, USA). For the EC50 of 5-HT:
where the bottom is the minimal response, top is the maximal response by 5-HT, X is the logarithm of concentrations of tested agonist and EC50 is the concentration of 5-HT that gives a response half way between bottom and top. For the IC50 of lamotrigine:
where the bottom is the maximally inhibited response by lamotrigine, top is the maximal response by 5-HT alone, X is the logarithm of concentrations of lamotrigine and IC50 is the concentration of lamotrigine resulting in a response half way between bottom and top.
The averaged values were expressed as mean±S.E.M. Statistical significance was determined by the Student's t-test. p<0.05 was considered to be statistically significance.
Go to :
RESULTS
Inhibitory effects of lamotrigine on 5-HT3 receptor activation
To determine the direct effects of lamotrigine on 5-HT3 receptor currents, we studied the concentration-dependent responses of lamotrigine (1~300 µM) on the currents activated by 3 µM of 5-HT, near EC50 of 5-HT3 receptor currents in our previous report [23]. Application of lamotrigine (300 µM) alone did not induce any current (data not shown). Co-application of lamotrigine reduced the peak amplitudes of 3 mM 5-HT-induced currents in a concentration-dependent manner (Fig. 1A). The IC50 value of lamotrigine for the peak amplitude reduction was 28.2±3.6 µM with a Hill coefficient of 1.2±0.1 (Fig. 1C, n=8). In addition to reducing the peak amplitude, lamotrigine also decreased the rise slope of 5-HT3 receptor currents, an indicator of activation of the 5-HT3 receptor [25], induced by 3 µM of 5-HT. The IC50 value for the rise slope decreases by lamotrigine was 21.7±4.9 µM with a Hill coefficient of 1.4±0.2 (Fig. 1D, n=8).
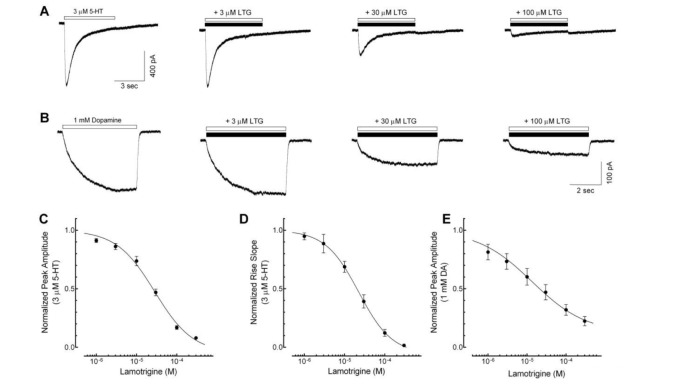 | Fig. 1Concentration-dependent inhibition of lamotrigine on the 5-HT3 receptor currents.(A) Sample traces show currents activated by 3 µM 5-hydroxytryptamine (5-HT) application (open bar) and co-application of 3 µM 5-HT with 3, 30, 100 µM of lamotrigine (LTG, closed bar) for 5 sec. (B) Representative traces show currents induced by application of 1 mM dopamine (DA) alone (open bar) and co-application with various concentration of lamotrigine (closed bar) for 5 sec. (C~E) A concentration-dependent block of lamotrigine on the peak amplitude and rise slope of 5-HT3 receptor currents induced by 3 µM 5-HT (n=8) and 1 mM DA (n=6). Data were normalized to the value of the peak current amplitudes and rise slope induced by 3 µM of 5-HT alone or 1 mM DA alone, which was taken as 1. Each data represents mean±S.E.M.
|
To further investigate the effects of lamotrigine on 5-HT3 receptor activation, we used dopamine (DA), a partial 5-HT3 receptor agonist [26]. Currents activated by 1 mM of DA were characterized by a slow rise time, smaller peak amplitude (compared to that of a full agonist, i.e., 5-HT) and, either no decay or a small slow decay during DA application for 5 sec (Fig. 1B). It has been also reported that DA-induced currents in NCB-20 cells were completely blocked by zacopride, a potential and highly selective 5-HT3 receptor antagonist [26]. These results suggest that DA directly activates the 5-HT3 receptors without strong desensitization. Therefore, it is possible to clarify further effects of lamotrigine on the activation or the open process of 5-HT3 receptors [26]. We then studied the effect of lamotrigine (1~300 µM) on 1 mM DA-induced currents (Fig. 1B). Co-application of lamotrigine with DA reduced the peak amplitude in a concentration-dependent manner. The IC50 value of the peak amplitude was 18.2±6.7 µM with a Hill coefficient of 1.3±0.6 (Fig. 1E, n=6). The IC50 values of lamotrigine on the inhibition of peak amplitude were similar between the 5-HT3 receptor currents activated by a full agonist, 5-HT and a partial agonist, DA. These results suggest that the inhibitory action of lamotrigine on 5-HT3 receptors resulted from the blockade of the channel activation process.
Fig. 2A shows the representative 5-HT3 receptor currents evoked by 1, 3, 10, 30 µM of 5-HT with or without lamotrigine co-application (30 µM, near IC50 based on other experiments mentioned in this study) to study whether lamotrigine inhibits the 5-HT3 receptor competitive manner. Co-application of lamotrigine attenuated the currents activated by 0.1~30 µM of 5-HT (Fig. 2B). EC50 value of peak currents induced by application of 5-HT alone was 3.4±0.1 µM with Hill coefficient of 2.5±0.3 (n=9). EC50 value of peak currents induced by co-application of 5-HT and 30 µM of lamotrigine was 4.2±0.3 µM with Hill coefficient of 2.3±0.1 (n=9). Co-application of 30 µM of lamotrigine increased the EC50 (p<0.05, unpaired t-test) however, the Hill coefficient change was not statistically significant (p=0.5698). The maximum of peak currents, reached at 30 µM of 5-HT, were not significantly different between those with and without 30 µM of lamotrigine (96.1±4.0% and 104.1±1.9% of 10 µM 5-HT response, respectively; p=0.0843, unpaired t-test). These results suggest that lamotrigine inhibits 5-HT3 receptor activation in a competitive manner.
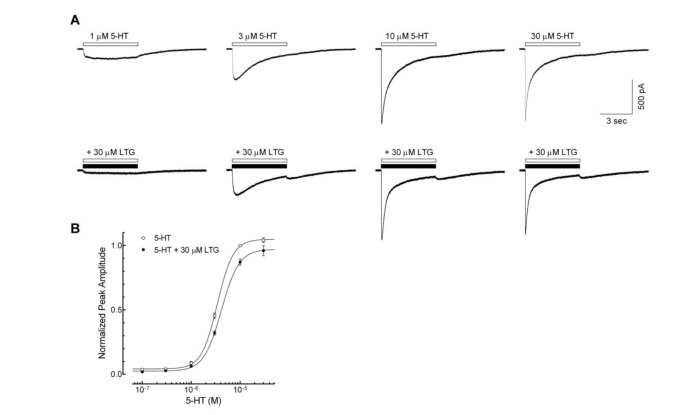 | Fig. 2Competitive inhibition of lamotrigine on the 5-HT3 receptor currents.(A) Representative current traces activated by 1, 3, 10, 30 µM of 5-HT alone (open bar) and co-application of 5-HT with 30 µM of lamotrigine (LTG, closed bar), near IC50 from figure 1C. (B) Concentration-response relationship of the peak amplitude of 5-HT3 receptor currents induced by 0.1, 0.3, 1, 3, 10, 30 µM of 5-HT in the absence (○, n=9) or presence of 30 µM of lamotrigine (●, n=9). Co-application of 30 µM of lamotrigine shifted the EC50 to the right (p<0.05, unpaired t-test) however, the maximum of peak currents, reached at 30 µM of 5-HT, were not significantly different (104.1±1.9% of 10 µM of 5-HT currents for 30 µM 5-HT alone, and 96.1±4.0% for 5-HT with 30 µM LTG; p=0.0843, unpaired t-test). Data were normalized to the value of the peak current amplitudes induced by 10 µM of 5-HT alone, which was taken as 1. Each data represents mean±S.E.M.
|
In order to determine whether the lamotrigine also affects the closed state of the 5-HT3 receptor, cells were pretreated with 30 µM lamotrigine for 1 min prior to the co-application of 3 µM 5-HT with lamotrigine, and compared to 3 µM 5-HT and 30 µM lamotrigine co-applications without pretreatment of lamotrigine (Fig. 3A). Following a 1 min pretreatment, no differences were observed in the inhibition of peak amplitudes by the co-application of 5-HT and lamotrigine after 1 min pretreatment (50.4±1.2% of 5-HT only) when compared to the co-application without pretreatment of lamotrigine (50.6±1.8%) (Fig. 3B, n=8, p=0.8586, paired t-test). These results indicate that lamotrigine is unlikely to bind to the closed state of the receptor but readily binds to the open or active state.
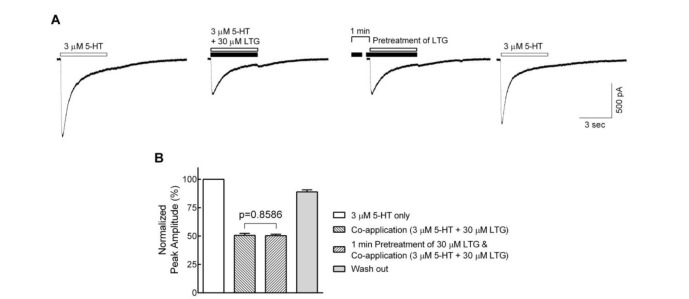 | Fig. 3Effects of lamotrigine on the closed state of the 5-HT3 receptor.(A) Sample traces show currents evoked by 3 µM 5-HT alone (first), lamotrigine (LTG) co-application without (second) and with (third) 1 min pretreatment of lamotrigine, and 5-HT alone after wash out of lamotrigine for 1 min (fourth). (B) Bar graphs show the averaged peak amplitudes normalized to 3 µM 5-HT alone. There were no significant differences between lamotrigine co-application with and without lamotrigine 1 min pretreatment (n=8, p=0.8586, paired t-test). Data were normalized to the value of the peak current amplitudes induced by 3 µM of 5-HT alone, which was taken as 100%. Each data represents mean±S.E.M.
|
To address, in detail, the effects of lamotrigine on the 5-HT3 receptor open state, we next applied lamotrigine (1~300 µM) on 5-HT (10 µM) and 5-hydroxyindole (5-HI, 1 mM)-induced currents (Fig. 4). Our previous report showed that 1 mM 5-HI blocked the desensitization of 10 µM 5-HT-induced currents without changes in peak amplitude [24], which remained 5-HT3 receptor to open or activated states. The currents activated by 10 µM 5-HT with 1 mM 5-HI were decreased following subsequent application of lamotrigine in a concentration-dependent manner. A concentration of 300 µM lamotrigine was sufficient to cause a complete blockade of the currents (Fig. 4A). The IC50 value of lamotrigine for the inhibition of open state of the 5-HT3 receptor was 36.6±2.2 µM with a Hill coefficient of 0.5±0.1 (Fig. 4B, n=9).
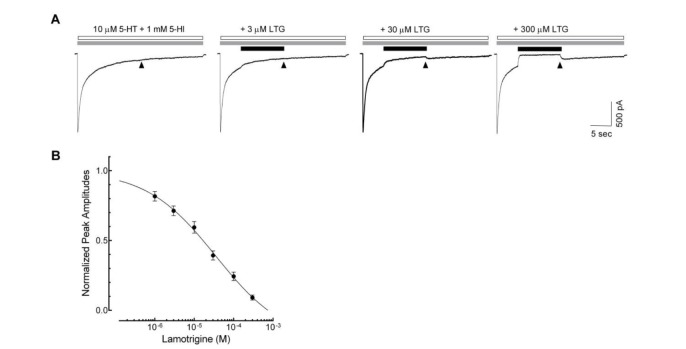 | Fig. 4Open channel blockade of lamotrigine on 5-HT3 receptor.(A) Sample traces show the 5-HT (open bar, 10 µM) and 5-HI (gray bar, 1 mM)-evoked currents and the effects of subsequent treatment of lamotrigine (LTG) on these current (closed bar). The residual currents (time indicated by ▲) after the application of lamotrigine were analyzed for the evaluation of inhibitory effects. (B) Concentration–response relationship of the lamotrigine (1, 3, 10, 30, 100 and 300 µM) on 5-HT3 receptor currents evoked by the co-application of 5-HT (10 µM) and 1 mM of 5-HI (n=9). Data were normalized to the value of the residual currents measured at the indicated timing in the 5-HT3 receptor currents induced by 10 µM of 5-HT and 1 mM of 5-HI, which was taken as 1. Each data represents mean±S.E.M.
|
Effects of lamotrigine on 5-HT3 receptor deactivation and desensitization
To examine if lamotrigine could alter 5-HT3 receptor deactivation, exposure to the external solution in the presence or absence of 30 µM lamotrigine, followed immediately after a brief application of 5-HT for 10 msec (Fig. 5A). A high 5-HT concentration (10 µM) was used to induce more profound channel deactivation following activation. The decay of 5-HT3 receptor currents induced by application of 10 µM 5-HT for 10 msec were fitted to a double exponential function and analyzed the fast and slow component of time constants for current decay. As shown in Fig. 5B, the presence of lamotrigine (30 µM) after 10 msec application of 5-HT slowed the current decay. The slow decay time constant was increased from 1640.6±74.3 to 1961.9±100.9 msec (n=8, p<0.05, paired t-test). However, the time constant for fast current decay was not changed by lamotrigine (322.2±36.7 msec for 5-HT alone and 312.1±47.3 msec for lamotrigine washing, n=8, p=0.6343, paired t-test). These results suggest that lamotrigine attenuates the deactivation of 5-HT3 receptors after channel opening.
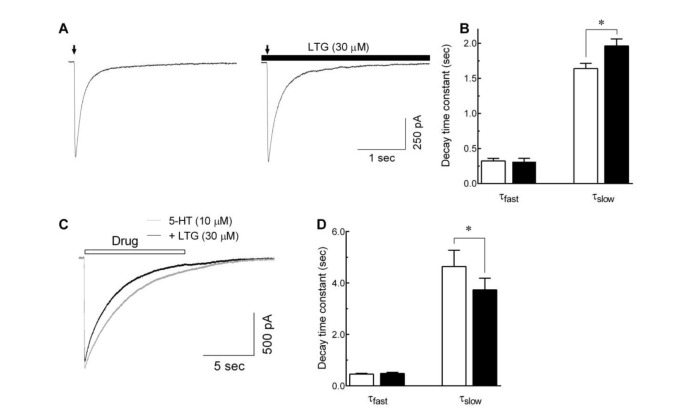 | Fig. 5Effects of lamotrigine on 5-HT3 receptor deactivation and desensitization.(A) Representative traces show currents evoked by 5-HT (10 µM, 10 msec, indicated by arrow) in the absence (left) and presence (right) of lamotrigine (LTG, 30 µM, closed bar). (B) The bar graph shows the averaged effect of lamotrigine on the fast (τfast) and slow (τslow) component of current decays after a brief application of 5-HT to evaluate the effect of lamotrigine on the 5-HT3 receptor deactivation (n=8, *p<0.05, paired t-test). (C) Superimposed current traces obtained by the long application (10 sec) of 10 µM 5-HT alone (gray trace) and co-application of 5-HT with 30 µM of lamotrigine (black trace). (D) Averaged bar graph shows the effects of lamotrigine on the τfast and τslow of current decays after long application of 5-HT to elucidate the effect of lamotrigine on the 5-HT3 receptor desensitization (n=8, *p<0.01, paired t-test). Each data represents mean±S.E.M.
|
The effect of lamotrigine on the 5-HT3 receptor desensitization was also studied using a long application of 5-HT to induce the receptor desensitization with or with lamotrigine, then analyzed current decay time constants. Fig. 5C shows the superimposed current traces induced by 10 µM of 5-HT (10 sec) with or without 30 µM of lamotrigine. The current decay during application of 5-HT was fitted to a double exponential function, and accelerated by co-application of lamotrigine. As shown in Fig. 5D, the time constant for fast current decays were not significantly changed by lamotrigine (455.2±28.2 msec for 5-HT alone and 482.1±40.6 msec for lamotrigine co-application, n=8, p=0.415, paired t-test), however the time constant for the slow component of current decays were decreased from 4640.0±632.8 to 3732.0±454.8 msec (n=8, p<0.01, paired t-test). These results suggest that lamotrigine accelerates the 5-HT3 receptor desensitization after receptor activation.
Voltage-independence of lamotrigine on 5-HT3 receptor inhibition
To evaluate the voltage-dependence of lamotrigine-induced inhibitory effects, 5-HT3 receptor currents were recorded in the presence or absence of lamotrigine at different holding potentials (–50~+30 mV). Lamotrigine decreased 5-HT-induced currents over the entire voltage range tested (Fig. 6A). Fig. 6B shows a plot of 5-HT3 receptor currents, induced by 3 µM of 5-HT and normalized to the currents at –50 mV of holding potential, against tested holding potentials in the presence or absence of lamotrigine (30 µM). Current-voltage relationships for peak amplitudes were almost linear, and calculated reversal potentials by linear regression were 3.4±0.5 mV and 3.5±0.7 mV in the absence and presence of lamotrigine, respectively. The reversal potential of 5-HT-induced currents was not changed by the co-application of lamotrigine (n=7, p=0.8076, paired t-test). The fractional blockade was calculated at the different holding potentials, and inhibitory effects of lamotrigine over all tested membrane potential ranges were similar in the presence of lamotrigine (Fig. 6C). These results indicate that the inhibitory actions of lamotrigine did not depend on voltage.
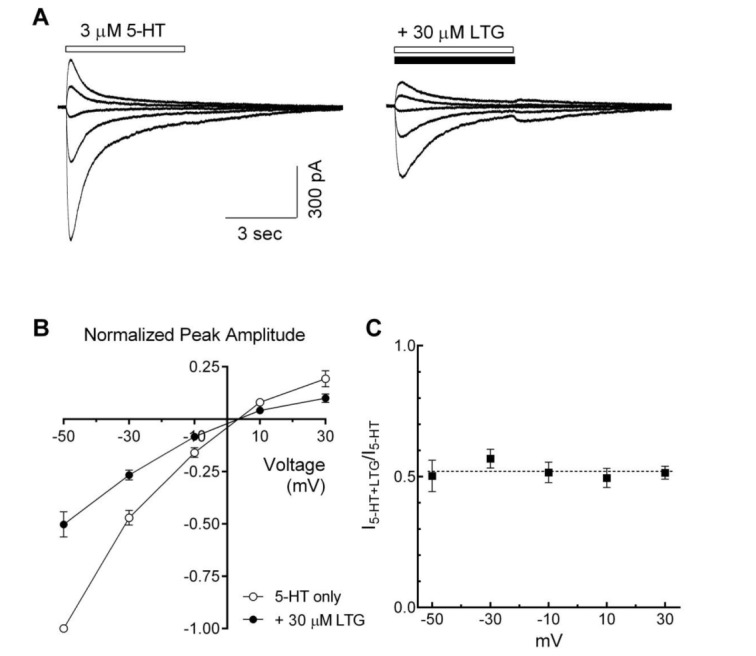 | Fig. 6Voltage-independent inhibition of the 5-HT3 receptor currents by lamotrigine.(A) Superimposed traces show the 5-HT3 receptor currents evoked by 5-HT alone (3 µM, open bar, left) and co-application with lamotrigine (LTG, 30 µM, closed bar, right) at various holding potentials (from −50 mV to +30 mV, 20 mV interval). (B) Averaged data show the I~V relationship in the absence (○) and the presence of lamotrigine (●) (n=7). Data were normalized to the value of the peak amplitudes induced by 5-HT (3 µM, −50 mV) alone, which was set as a −1. (C) Averaged data show a fractional block of lamotrigine (I5-HT+LTG/I5-HT) as a function of holding potential. Each data represents mean±S.E.M.
|
Go to :
DISCUSSION
In the present study, we investigated the inhibitory actions of lamotrigine, an antiepileptic drug, on 5-HT3 receptors naturally expressed in NCB-20 neuroblastoma cells. Our results suggest that lamotrigine inhibits 5-HT3 receptor function predominantly by blocking channel opening, as substantiated by a lamotrigine-induced lowering of the peak amplitude accompanied with the reduction in the rise slope of currents, an indicator of activation of 5-HT3 receptor [25], in concentration-dependent manner. Similar effects were obtained in DA experiments, under conditions were the channels are more likely to be in their open states without profound desensitization [26]. Thus, we suggest lamotrigine-induced inhibition of 5-HT3 receptor function occurs during the receptor activation phase, i.e., channel open. This observation is supported by our finding that the pretreatment of lamotrigine for 1 min did not exert a significant effect on the 5-HT3 receptor currents induced by co-application of 5-HT and lamotrigine, which suggesting the possibility of lamotrigine binding to closed state of 5-HT3 receptors, and thereby block subsequent opening could be excluded. To further investigate the interaction of lamotrigine with the 5-HT3 receptor during the open state of the receptor, experiments were conducted in the presence of 5-HI. In a previous report we showed that 1 mM 5-HI efficiently slowed 5-HT3 receptor desensitization generated by 10 µM 5-HT without any effect on peak amplitudes [24]. Application of lamotrigine in the presence of 5-HT and 5-HI inhibited 5-HT3 receptor currents in a concentration-dependent manner. These results also suggest that lamotrigine preferentially works in the open states of 5-HT3 receptor and then inhibits the currents. In a series of these experiments, the calculated IC50 values of lamotrigine on 5-HT3 receptor currents showed little variance in a range of 20~40 µM. These results suggest that lamotrigine exerts 5-HT3 receptor blocking through an open channel blocker.
Lamotrigine was also observed to alter the deactivation and desensitization properties of 5-HT3 receptor channels, i.e. the slow time constants for current decays by the 5-HT3 receptor deactivation were attenuated and the slow time constants for current decays by the 5-HT3 receptor desensitization were accelerated by lamotrigine. As with many ligand-gated ion channels, channel deactivation and desensitization are correlated with the opening of the ion channels–for example, if more channels are activated, they will be more strongly deactivated and desensitized. In other words, if the degree of channel activation is increased, the rate of deactivation and desensitization is accelerated in an agonist concentration-dependent manner [2527]. Therefore, the attenuation of 5-HT3 receptor deactivation and the acceleration of receptor desensitization by lamotrigine in our experiment could be explained by secondary changes following inhibition of channel opening. However, a direct effect of lamotrigine on the deactivation and desensitization steps of the 5-HT3 receptor could not be ruled out, because it has been reported that some drugs modulate 5-HT3 receptor function directly acting on the receptor deactivation or desensitization process [2829]. Thus, further studies elucidating the effect of lamotrigine on receptor deactivation and desensitization are needed.
In our study, lamotrigine caused an inhibition in peak amplitudes in a voltage-independent manner. The voltage-dependency of a drug effect is considered as evidence for a mechanism of open channel blocking in the voltage-gated ion channels as well as the ligand-gated ion channels, including 5-HT3 receptors. For example, diltiazem acted as an open channel blocker on 5-HT3 receptors and caused a voltage dependency [30]. However, lamotrigine is a basic drug with pKa5.7 [31] and predominates in its uncharged form at physiological pH. Therefore, it should be considered that if the major mechanism of action of lamotrigine on 5-HT3 receptors is thought to involve the uncharged form of the drug, lamotrigine should block the currents in a voltage independent manner, even though it works as an open channel blocker on the 5-HT3 receptors. These results suggest that lamotrigine could bind to the 5-HT3 receptor voltage independently during activation and inhibits ion channel opening. This interpretation should be tested further, because our findings that the peak amplitude decreases accompanied with rise slope reduction (Fig. 1), no significant effects of 1 min pretreatment of lamotrigine (Fig. 3), and inhibition of open states of 5-HT3 receptor by lamotrigine (Fig. 4), are all suggesting the open channel blocking mechanism of lamotrigine action. It has been reported that fluoxetine inhibited the 5-HT3 receptor function with open channel blocking mechanism, but it showed voltage independency in its inhibition [32].Therefore, lamotrigine could act as an open channel blocker with voltage-independency.
5-HT3 receptors modulate the release of various neurotransmitters such as dopamine, GABA and glutamate in the central nervous system [333435], and are implicated in complex neuronal functions [1836]. Reports for the antagonist of 5-HT3 receptors indicate these receptors play important roles in neuropsychotropic actions such as schizophrenia [3738]. In addition, lamotrigine blocks voltage-gated Na+ channel, which is believed to mediate its antiepileptic activity [39], resulting in blockade of the release of excitatory neurotransmitters [40]. Furthermore, other reports suggest that lamotrigine has a potential role in neuropsychiatric disorders [2241]. Taken together with these reports, our results suggest that the 5-HT3 receptor blocking by lamotrigine could be a potential mechanism of action in the clinical use of this drug to treat psychiatric and neurologic disorders.
In summary, we showed that lamotrigine inhibited 5-HT3 receptor activation and 5-HT3 receptor-induced currents. Lamotrigine decreased the amplitudes of 5-HT3 receptor-mediated currents during the activation phase of the channel with changes in channel deactivation and desensitization properties. Therefore, lamotrigine blocks 5-HT3 receptor-mediated currents by weakly binding to the open state of the receptors. Taken together, these results suggest that lamotrigine might contribute as a therapeutic agent for psychiatric and neurologic disorders, acting on the 5-HT3 receptors.
Go to :
 XML Download