

 PDF
PDF ePub
ePub Citation
 Print
Print


INTRODUCTION
Selective serotonin reuptake inhibitor (SSRI) is thought to be safer than tricyclic antidepressant (TCA) in the risk of cardiovascular causes, because TCA is known to induce QT prolongation of the electrocardiogram and the associated arrhythmogenic risk in vivo [1234]. One of the SSRIs, paroxetine (Fig. 1) has the most potent activity for an inhibition of the 5-HT uptake transporter [56]. Furthermore, it has been reported that the paroxetine has fewer side effects and lower toxicity than TCA [78]. Therefore, paroxetine may be an attractive drug for treatment of patients suffering from the cardiovascular adverse effects of TCA. However, accumulating evidence indicates paroxetine has various additional effects, especially on several ion channels in a SSRI-independent manner. For example, paroxetine has been shown to act as a potent Na+ channel blocker [91011]. It has been also reported that paroxetine inhibits G protein-activated inwardly rectifying K+ channel [12] and TREK K+ channel [13]. These results suggest that paroxetine may have an effect on cardiovascular system, which is highly regulated by various ion channels. Recently we have reported that paroxetine blocks human ether-a-go-go-related gene (hERG), suggesting paroxetine-induced cardiotoxicity [14]. Therefore, it is needed to study the effects of paroxetine on the other cardiac ion channels.

Kv1.5 underlies the ultrarapid delayed rectifier outward K+ currents that are observed naturally in atrium of heart, whereas they appear to be absent from ventricle [1516]. Kv1.5 play an important role in determining the length of cardiac action potentials and, therefore, have been the targets of antiarrhythmic drugs [17]. Because of its rapid activation and little inactivation, Kv1.5 can contribute to repolarization of atrial action potentials. Dysfunction of Kv1.5 results in a prolongation of cardiac action potentials, which eventually leads to cardiac arrhythmias with serious morbidity [151819].
Here we show, with whole-cell patch-clamp technique, that paroxetine acts as an open channel blocker of Kv1.5 expressed in Chinese hamster ovary (CHO) cells. As the Kv1.5 play a crucial role in controlling the duration of cardiac action potentials and hence the atrial rhythm, our data imply that paroxetine may have detrimental side effects on cardiac system by inhibiting Kv1.5.
Go to : 
METHODS
Cell culture and transfection
CHO cells expressing Kv1.5 derived from rat brain were used for electrophysiological recordings [20]. Kv1.5 cDNA [16] was transferred into the plasmid expression vector pCR3.1 (Invitrogen Corporation, San Diego, CA, USA). CHO cells were transfected with Kv1.5 cDNA using FuGENE™6 reagent (Boehringer Mannheim, Indianapolis, IN, USA). The transfected cells were cultured in Iscove's modified Dulbecco's medium (Invitrogen Corporation) supplemented with 10% fetal bovine serum, 2 mM glutamine, 0.1 mM hypoxanthine, 0.01 mM thymidine, and 300 µg/ml G418 (A.G. Scientific, San Diego, CA, USA), in 95% humidified air-5% CO2 at 37℃. The cultures were passaged every 4~5 days with a brief trypsin-EDTA treatment followed by seeding onto glass coverslips (diameter: 12 mm, Fisher Scientific, Pittsburgh, PA, USA) in a Petri dish. After 12~24 h, the cell-attached coverslips were used for electrophysiological recordings.
Electrophysiology
Kv1.5 currents were recorded from CHO cells, with a whole-cell patch-clamp technique [21] at room temperature (22~23℃). The micropipettes fabricated from glass capillary tubing (PG10165-4; World Precision Instruments, Sarasota, FL, USA) with a double-stage vertical puller (PC-10; Narishige, Tokyo) had a tip resistance of 2~3 MΩ when filled with the pipette solution. Whole-cell currents were amplified with Axopatch 200B amplifier (Molecular Devices, Sunnyvale, CA, USA), digitized with Digidata 1440A (Molecular Devices) at 5 kHz and low-pass filtered with four-pole Bessel filter at 2 kHz. Capacitive currents were canceled and series resistance was compensated at 80% with the amplifier, while leak subtraction was not used. The generation of voltage commands and acquisition of data were controlled with pClamp 10.1 software (Molecular Devices) running on an IBM-compatible Pentium computer. Recording chamber (RC-13, Warner Instrument Corporation, Hamden, CT, USA) was continuously perfused with bath solution (see below for composition) at a rate of 1 ml/min.
Solutions and drugs
The intracellular pipette solution for whole-cell recordings contained 140 mM KCl, 1 mM CaCl2, 1 mM MgCl2, 10 mM HEPES, and 10 mM EGTA, and was adjusted to pH 7.3 with KOH. The bath solution for whole-cell recordings contained 140 mM NaCl, 5 mM KCl, 1.3 mM CaCl2, 1 mM MgCl2, 20 mM HEPES and 10 mM glucose, and was adjusted to pH 7.3 with NaOH. Paroxetine (Fig. 1; Sigma Chemical Co., St. Louis, MO, USA) was dissolved in ethanol at 30 mM and further diluted into the bath solution. Final concentration of ethanol in the bath solution, which was less than 0.1%, had no effect on Kv1.5 currents (Data not shown).
Data analysis
Data were analyzed with Origin 7.0 (OriginLab Corp., Northampton, MA, USA) and Clampfit 10.1 software (Molecular Devices). A model of interaction kinetics between drug and channel was based on a first-order blocking scheme as previously described [22]. This scheme allowed us to obtain IC50 and Hill coefficient (n) by fitting concentration dependence data to the following equation: in which I (%) is the percent inhibition of current (I (%)=[1- Idrug/Icontrol]×100) at test potential and [D] represents various drug concentrations. The steady-state activation curve was fitted with the Boltzmann equation: where k represents the slope factor, V the test potential, and V1/2 the potential at which the conductance was half-maximal. We obtained an activation time constant by fitting the latter 50% of activation (i.e., rise from 50% to 100% of peak amplitude) with a single exponential function. Since the drug-channel interaction was based on the first-order scheme, the binding (k+1) and unbinding (k-1) rate constants were obtained from the following equations:
in which τD is the drug-induced time constant. The drug-induced time constant and deactivation time constant were determined by fitting with the sum of the exponentials: in which τ1, τ2, and τn are the time constants; A1, A2, and An are the amplitudes of each component of the exponential; and B is the baseline value.
To investigate the voltage dependence of Kv1.5 inhibition by the drug, the relative current was plotted as a function of the membrane potential. The resultant percent inhibition data between 0 and +50 mV were fitted with a Woodhull equation [23]: where KD(0) represents the apparent affinity at 0 mV, z the charge valence of the drug, d the fractional electrical distance, F Faraday's constant, R the gas constant, and T the absolute temperature. A value of 25.4 mV was used for RT/F at 22oC in the present study. Equation 6 can be modified to get a linear transformation as follows:
Results were expressed as mean±S.E.M. Student's t-test and analysis of variance (ANOVA) were used for statistical analysis with a confidence level of p<0.05.
Go to :
RESULTS
Concentration-dependent and reversible inhibition of Kv1.5 by paroxetine
Fig. 2A shows the superimposed-original Kv1.5 current traces obtained by a 250-ms depolarizing pulse from -80 to +50 mV under control conditions and in the presence of various concentrations of paroxetine. Under control conditions, the current showed typical characteristics of Kv1.5: rapid activation and very slow inactivation, as described previously [20]. The dominant time constant of activation under control conditions was 1.67±0.31 ms (n=7) with a 250-ms depolarizing pulse from -80 to+50 mV. Bath-applied paroxetine reduced the Kv1.5 currents in a concentration-dependent manner. The paroxetine-induced inhibition of Kv1.5 currents was characterized by an acceleration in the apparent rate of current decay in a concentration-dependent manner. In the presence of 10 µM paroxetine, the time constant of activation was 1.59±0.23 ms (n=7), which indicates that the activation kinetics were not significantly modified by paroxetine. The paroxetine-mediated suppression of end-pulse current is more pronounced than that of peak current. As shown in Fig. 2B, dose-dependency of the end-pulse or peak currents was analyzed quantitatively. A nonlinear least-squares fit of dose-response plots with the Hill equation yielded an IC50 value of 4.11±0.22 µM and a Hill coefficient of 0.98±0.06 (n=5) for the end-pulse currents and an IC50 value of 13.47±1.15 µM and a Hill coefficient of 0.67±0.05 (n=5) for the peak currents. The paroxetine-mediated inhibition of Kv1.5 currents is reversible upon wash-out of the drug (Fig. 2C). The end-pulse currents reduced by 10 µM paroxetine was reversed to 83.6±7.7% of predrug baseline (n=5) after 2-min wash-out.
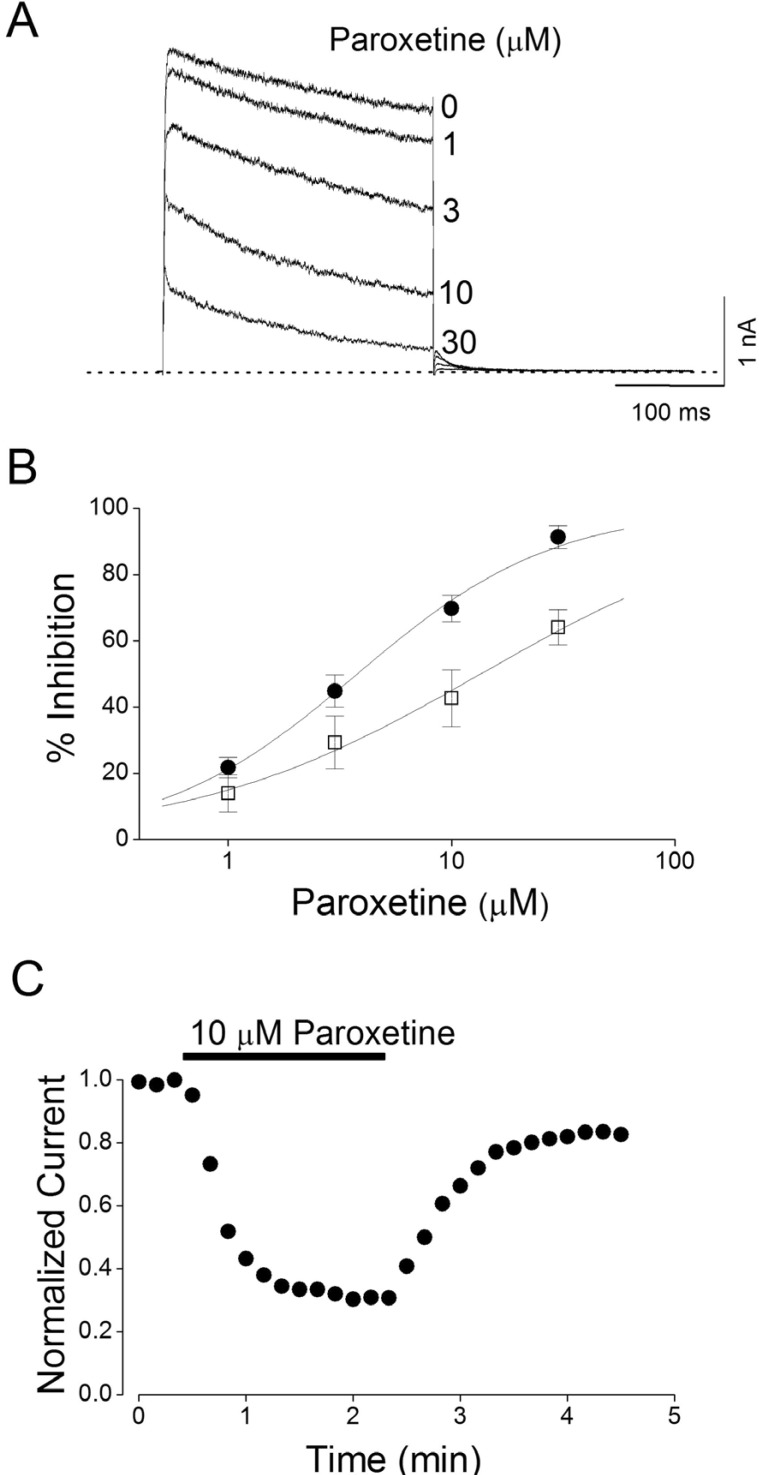 | Fig. 2Concentration-dependent and reversible inhibition of Kv1.5 by paroxetine.(A) Superimposed current traces were produced by applying 250-ms depolarizing pulses from a holding potential of -80 to +50 mV followed by a 250-ms repolarizing pulse to -40 mV every 10 s in the absence and presence of 1, 3, 10, and 30 µM paroxetine, as indicated. The dotted line represents zero current. (B) Concentration-dependent curve of inhibition by paroxetine. Current amplitudes of Kv1.5 measured at the end of the depolarizing pulses (closed circle) and peak current (open square) were used and the respective percentage inhibitions were plotted against various concentrations of paroxetine. The solid line is fitted to the data points by the Hill equation. Data are expressed as mean±S.E.M. (C) Representative time course for inhibition in the presence of 10 µM paroxetine. The current amplitudes were measured at the end of a 250-ms depolarizing pulses from a holding potential of -80 to +50 mV every 10 s in the presence of 10 mM paroxetine and normalized to the first current amplitude and the normalized data were plotted as a function of time.
|
Voltage-dependent inhibition of Kv1.5 by paroxetine
Fig. 3 shows the effect of 10 µM paroxetine on current-voltage (I~V) relations. Under control conditions, the Kv1.5 current activated at pulses greater than -30 mV, and the steady-state I~V relationship showed a sigmoidal shape at potentials between -30 and 0 mV (Fig. 3A and C). The inhibition of Kv1.5 currents by 10 µM paroxetine was observed in the whole voltage range over which Kv1.5 was activated (Fig. 3B and C). By plotting percent inhibition (see MATERIALS AND METHODS) versus potential, a high degree of inhibition with a strong voltage dependence was observed between -20 and 0 mV, which involved the voltage range of channel opening (Fig. 3D). Between 0 and +50 mV, despite Kv1.5 being fully activated at this voltage range, inhibition continued to increase with a shallow voltage dependence: 58.7±2.1% inhibition at 0 mV, and 75.8±3.2% at +50 mV (n=5, p<0.05). Given the assumption that paroxetine interacts intracellularly with Kv1.5, we investigated this effect by a linear curve fitting of the data at potentials positive to 0 mV, using a linear transformation of Woodhull equation (see MATERIALS AND METHODS). The solid line in Fig. 3D represents a fitted curve which yielded δ=0.32±0.07 (n=5).
 | Fig. 3Voltage dependence of paroxetine-induced inhibition of Kv1.5 currents.The Kv1.5 currents were produced by applying 250-ms pulses between -60 and +50 mV in 10-mV increments followed by a 250-ms repolarizing pulse to -40 mV every 10 s, from a holding potential of -80 mV under control conditions (A), and after the addition of 10 µM paroxetine (B). The dotted lines in (A) and (B) represent zero current. (C) Resultant I~V relationships taken at the end of the test pulses in the absence (open circle) and presence (closed circle) of 10 µM paroxetine. (D) Percentage current inhibition (closed square) from data in (C) was plotted against the membrane potential. For potentials positive to 0 mV, the data of percentage current inhibition was recalculated by using ln{(IControl-IParoxetine)/IParoxetine} (closed triangle) and replotted against membrane potential. The voltage dependence was linear fitted with equation 7 (see MATERIALS AND METHODS), shown by the solid line with the indicated values for the equivalent electrical distance (δ=0.32±0.07, n=5). The dotted line represents the activation curve of Kv1.5 under control conditions, which was obtained from a deactivating tail current amplitude at -40 mV after 250-ms depolarizing pulses to potentials between -60 to +50 mV in steps of 10 mV from a holding potentials of -80 mV and thereafter normalization using equation 2 (see MATERIALS AND METHODS).
|
Time-dependent inhibition of Kv1.5 by paroxetine
As shown in Fig. 4A, paroxetine accelerated the decay of Kv1.5 current in a concentration-dependent manner. With a double exponential fitting to the traces of current decay at each concentration of paroxetine, two time constants were obtained. The fast time constant for Kv1.5 current inhibition (τD) was taken as an approximation of the time course of the drug-channel interaction kinetics, whereas the slow time constant was considered to represent the slow and partial inactivation during the test pulse, which is an intrinsic property of the Kv1.5 current [24]. As shown in Fig. 4B, a plot of the reciprocal of τD at +50 mV versus different concentrations of paroxetine yielded a binding rate constant (k+1) of 4.9±0.7 µM-1s-1 and an unbinding rate constant (k-1) of 16.1±1.4 s-1 (n=6). The theoretical K
D value derived by k-1/k+1 yielded 3.3 µM, which is close to the experimental IC50 value of 4.11 µM for paroxetine obtained from the concentration-response curve shown in Fig. 2.
 | Fig. 4Concentration-dependent kinetics of Kv1.5 inhibition by paroxetine.(A) Superimposed Kv1.5 current traces were elicited by applying 250-ms depolarizing pulses from a holding potential of -80 to +50 mV every 10 s in the presence of paroxetine (1, 3, 10, and 30 µM). The dotted line represents zero current. (B) The drug-induced time constants (τD) were obtained by a selection of the fast time constant from a double exponential fitting to the decaying traces of Kv1.5 currents. The inverse of τD obtained at +50 mV was plotted versus paroxetine concentrations. The solid line represents the least-squares fit of the data to the relation 1/τD=k+1[D]+k-1. A binding rate constant (k+1) and an unbinding rate constant (k-1) were obtained from the slope and intercept values of the fitted line. Data are expressed as mean±S.E.M.
|
To further investigate the time-dependent inhibition of Kv1.5 by paroxetine, deactivation kinetics of Kv1.5 current was studied. Fig. 5A shows representative superimposed tail currents under control conditions and with 10 µM paroxetine, recorded with a 250-ms repolarizing pulse at -40 mV, after a 250-ms depolarizing pulse of +50 mV from a holding potential of -80 mV. These currents were well fitted to a single exponential function. Under control conditions, the tail current declined quickly with a time constant of 16.2±2.0 ms (n=4) and was nearly completely deactivated during a 250-ms repolarizing pulse of -40 mV. In the presence of 10 µM paroxetine, the initial peak amplitude of the tail current was reduced, and the subsequent decline in the current was slower (48.8±10.3 ms, n=4), resulting in the tail crossover phenomenon. Fig. 5B summarizes the time constants obtained at repolarizing pulses of -40 mV. Paroxetine significantly increased the deactivation time constants of Kv1.5 at repolarizing pulses of -40 mV (n=4, p<0.05).
 | Fig. 5Effects of paroxetine on deactivation kinetics of Kv1.5.(A) Tail currents were induced at a 250-ms repolarizing pulses of -40 mV after a 250-ms depolarizing pulse of +50 mV from a holding potential of -80 mV in the absence and presence of 10 µM paroxetine. The dotted lines represent a zero current. Tail crossover phenomenon (indicated by the arrow) observed by superimposing the two tail currents. (B) Deactivation time constants (τ) obtained from (A). The deactivation time constants (τ) were obtained from a single exponential fitting to the decaying traces of Kv1.5 currents. The symbol * indicates a statistically significant difference (n=4, p<0.05 versus control data). Data are expressed as mean±S.E.M.
|
Use- and frequency-dependent inhibition of Kv1.5 by paroxetine
Fig. 6A shows the original current traces in the absence or presence of a 2-min exposure to 10 µM paroxetine, obtained after applying 20 repetitive 125-ms depolarizing pulses of +50 mV from a holding potential of -80 mV at 1 and 2 Hz. Fig. 6B shows the normalized current amplitudes at 1 and 2 Hz in the absence and presence of 10 µM paroxetine during application of the pulse trains. Under control conditions, the peak amplitude of the Kv1.5 current decreased slightly by 6.8±1.8% (n=4) at 1 Hz and by 12.9±3.3% (n=4) at 2 Hz. In the presence of 10 µM paroxetine, the peak amplitude of Kv1.5 decreased progressively in an use-dependent manner by 36.1±3.9% (n=4) at 1 Hz and by 50.5±4.6% (n=4) at 2 Hz. For an analysis of a frequency-dependent inhibition of Kv1.5 by paroxetine without contamination of the decline of the current under control conditions, the relative currents (IParoxetine/IControl) at 1 and 2 Hz were plotted (Fig. 6C). The frequency-dependent inhibition of Kv1.5 currents were detected at two frequencies, 1 and 2 Hz. These results suggest that paroxetine-induced inhibition of Kv1.5 current is highly use-dependent.
 | Fig. 6Effects of repetitive depolarization on paroxetine-induced inhibition of Kv1.5 currents.(A) Original current traces under control conditions and in the presence of 10 µM paroxetine obtained by applying 20 repetitive 125-ms depolarizing pulses of +50 mV from a holding potential of -80 mV at 1 and 2 Hz. The dotted lines represent a zero current. (B) Plot of normalized current at 1 and 2 Hz under control conditions (open circle and open triangle, n=4) and in the presence of 10 µM paroxetine (closed circle and closed triangle, n=4) as a function of the number of pulses. Peak amplitudes of the current from every pulse were normalized to the peak amplitudes of current obtained from the first pulse. (C) Relative current (IParoxetine/IControl) plotted at 1 (open square) and 2 Hz (closed square) from (B) as a function of the number of pulses. Data are expressed as mean±S.E.M.
|
Go to :
DISCUSSION
The present study shows the effects of paroxetine on the Kv1.5 expressed in CHO cells, using the patch-clamp technique. The inhibition of Kv1.5 by paroxetine is characterized by a concentration-dependent acceleration of the apparent rate of current decay. These results are similar to those presented with various open channel blockers such as bisindolylmaleimide for rat Kv1.5 [20], and zatebradine, loratadine, propafenone and 5-hydroxy-propafenone for human Kv1.5 [252627]. In this study, the characteristics of the paroxetine-induced inhibition of Kv1.5 suggest that paroxetine preferentially interacts with the open state of Kv1.5 based on the following lines of evidence. 1) Paroxetine accelerated the rate of Kv1.5 current decay during a depolarizing pulse. 2) At the onset of depolarizing pulses, paroxetine had no effect on the initial time course of channel activation indicating that paroxetine does not bind to the closed or resting state of Kv1.5. 3) The inhibition induced by paroxetine was voltage-dependent and increased steeply in the voltage range of channel activation. 4) Paroxetine slowed the deactivation time course, resulting in a tail crossover phenomenon. This latter phenomenon suggests an interaction between paroxetine and the open state of Kv1.5 [20252628]. 5) The actions of paroxetine in inhibiting Kv1.5 were use-dependent, with effects enhanced at higher rates of channel activation. This is consistent with the actions of paroxetine on the open state of Kv1.5 [2026].
The inhibition produced by paroxetine was voltage-dependent and increased steeply between -20 and 0 mV, which correspond with the voltage range for channel opening. An additional low degree of inhibition was detected in the voltage range positive to 0 mV despite Kv1.5 being fully activated at this voltage range. This weak but significant voltage-dependent inhibition was considered the consequence of the effects of the transmembrane electrical field on the interaction between paroxetine and Kv1.5. At an intracellular pH of 7.3, paroxetine is mainly positively charged because the drug is a weak base with a pKa=10.32 [29]. Given the assumption that paroxetine interacts intracellularly with Kv1.5, the positively charged drug appears to move into the transmembrane electric field from the inside. Inhibition should then increase at more depolarizing potentials because of electrostatic repulsion between the charge and the potentials, over the voltage range where the channels are fully activated. The δ value of 0.32 for the shallow voltage dependence indicates that the positively charged paroxetine senses 32% of the applied transmembrane electrical field as referenced from the intracellular side. This value is bigger to the δ values of 0.16~0.19 obtained in previous experiments with open channel blockers of Kv1.5 [25273031]. Thus, this result suggests that the interaction site between paroxetine and Kv1.5 seems to exist deeper relative to the intracellular side than that between other open channel blockers and Kv1.5 channels.
On the basis of pharmacokinetics of paroxetine, the therapeutic plasma concentrations of paroxetine is reported to be 0.08~0.15 µM in human depressed patients [32]. In the present study, the IC50 value (4.11 µM) of paroxetine for blocking Kv1.5 is higher than therapeutic plasma concentrations. However, in this study, the effects of paroxetine on Kv1.5 were examined in a CHO cell line. The phospholipid composition of the cell may be different from human native cardiac myocytes and the differences of membrane composition may affect paroxetine-induced Kv1.5 blockade. And also, drug concentrations in tissues may be higher than in plasma due to its high lipophilicity and affinity for adipose tissues. Therefore, it is possible that in this study, the extent of the blocking effects of paroxetine on Kv1.5 under physiological conditions may be underestimated. That is, the paroxetineinduced block of Kv1.5 channel could be clinically relevant in the upper range of therapeutic plasma concentrations that are observed in treatment with paroxetine for depressed patients. Finally, in cardiomyocytes, it is most likely that paroxetine may lead to cardiac disorder through block of Kv1.5 channel resulting in a significant prolongation of the action potential or affecting cardiac excitability. However, we cannot completely rule out the possibility that the effect of paroxetine on Kv1.5 expressed in cell line may be different from human native cardiac myocytes. And also, open channel blocker of Kv1.5 channel can be developed as a potential antiarrhythmic drug (class III) [223334]. That is, paroxetine may be beneficially used to treat depressed patients who have arrhythmic disease. Thus, in the further study, it is highly required whether paroxetine can induce the prolongation of the action potential and arrhythmic or antiarrhythmic effects in the native cardiac myocytes or animal heart.
In conclusion, the present study has described, for the first time, the effects of paroxetine on the Kv1.5 channel expressed in Chinese hamster ovary cells. Detailed study of the interaction kinetics between paroxetine and Kv1.5 suggests that paroxetine is an open-channel blocker for Kv1.5 in a concentration-, voltage-, time-, and use-dependent manner. Thus, much caution about arrhythmogenic risk is required when using paroxetine in the treatment with depressed patients who are suffering from a cardiovascular disease.
Go to :
 XML Download