

 PDF
PDF ePub
ePub Citation
 Print
Print


INTRODUCTION
Tonicity responsive enhancer binding protein (TonEBP), also known as nuclear factor of activated T cells 5 (NFAT5), is a member of the Rel family of transcription factors that include NF-κB and NFAT [1]. TonEBP expression and activation has been shown to be involved in kidney development and maintenance, proliferation and differentiation of immune cells, and inflammatory responses [2]. Several studies have suggested that TonEBP may also be important for other processes such as differentiation and migration. TonEBP regulates cardiomyogenesis through the coordinated expression of Wnt ligands and antagonists [3]. Myoblasts expressing an inhibitory form of TonEBP showed impaired migration and differentiation, which were rescued by addition of cysteine-rich angiogenic inducer 61 (Cyr61), a target of TonEBP in skeletal muscle cells [4]. TonEBP also regulates chondrocyte differentiation through the regulation of SPY (sex determining region Y)-box 9 (Sox9) expression [5].
Obesity resulting from excessive accumulation of white adipose tissue is closely related to metabolic syndromes such as diabetes, hyperlipidemia, and hypertension [678]. White fat mass is determined by the number and size of adipocytes [910]. Adipocyte differentiation primarily occurs before and during puberty but continues throughout the lifespan to replace lost adipocytes [1112]. Adipocyte differentiation can be divided into two broad stages. The determination phase results in the conversion of stem cells to preadipocytes. The committed cells undergo terminal differentiation manifested by formation of lipid droplets as well as the expression of adipocyte specific proteins [1314]. 3T3-L1 mouse preadipocytes are broadly used as an adipocyte differentiation in vitro model [15]. Upon stimulation with differentiation factors containing insulin, dexamethasone, and 1-methyl 2-isobutylxanthine (IMBX), growth-arrested 3T3-L1 cells reenter the cell cycle, a process referred to as mitotic clonal expansion (MCE), resulting in terminal differentiation into mature lipid-filled adipocytes.
In this study, we showed that sustained expression of TonEBP inhibits MCE as well as the insulin signaling pathway resulting in adipogenic suppression. This suppressive effect of TonEBP on adipogenesis is not effective after induction of differentiation.
Go to : 
METHODS
Antibodies and other reagents
Insulin, dexamethasone, 3-isobutyl-1-methylxanthine (IBMX), Oil Red O, poly-L-lysine, and 3-(4,5-dimethylthiazol-2-yl)-2,5-diphenyltetrazolium bromide (MTT) were purchased from Sigma Aldrich (St. Louis, MO). TRIzol reagent and Lipofectamine 2000 were from Invitrogen (Waltham, MA). Antibodies against PPARγ, IRS-1, and Akt were from Cell Signaling Technology (Danvers, MA). Anti-FABP4 antibody was from R&D systems (Minneapolis, MN). Anti-phospho-IRS-1 (Tyr1229) antibody was from MERCK Millipore (Darmstadt, Germany). Anti-phospho-Akt (Ser473) and secondary antibodies were from Santa Cruz Biotechnology (Dallas, TX). Anti-GAPDH antibody was from BETHYL Laboratories (Montgomery, TX).
Cell culture and adipocyte differentiation
3T3-L1 preadipocytes were cultured in Dulbecco's modified Eagles medium (DMEM, Welgene, Daegu, Korea) containing 10% bovine calf serum (Welgene) under a humidified atmosphere of 5% CO2 at 37℃. Confluent cells were maintained in DMEM containing 10% fetal bovine serum (Hyclone, Logan, UT) for two more days and then induced to differentiate (designated at day 0) using differentiation factors (IDI) of 1 µg/ml insulin, 1 µM dexamethasone, and 0.5 mM IBMX as previously described [16].
Transfection
The target sequence of Dicer-substrate small interference RNA (siRNA) for TonEBP was CCAGUUCCUACAAUGAUAACACUGA. Scrambled siRNA was purchased from Integrated DNA Technologies (DS ScrambledNeg, Coralville, IA) and used as the negative control. 3T3-L1 cells were transfected with TonEBP or scrambled siRNA for 24 h using Lipofectamine 2000 according to manufacturer's instructions, and then used for adipocyte differentiation.
Construction and adenovirus infection
Adenovirus expressing full length TonEBP was produced using 293A cells and the Gateway system, which contains pENTR/CMV-FLAG entry vector, pAd/PL-DEST destination vector, and LR clonase (Invitrogen). 3T3-L1 cells were infected with adenovirus expressing β-galactosidase or TonEBP in the presence of 0.5 µg/ml poly-L-lysine at a multiplicity of infection (MOI) of 100 according to the method of Orlicky et al. [17].
Immunoblotting
Cells were lysed with RIPA buffer (20 mM Tris-HCl, pH 7.5, 150 mM NaCl, 1 mM EDTA, 1 mM EGTA, 1% NP-40, 1% sodium deoxycholate, 2.5 mM sodium pyrophosphate, 1 mM β-glycerophosphate, 1 mM Na3Vo4, 1 µg/ml leupeptin) and the insoluble materials were removed by centrifugation at 12,000 g for 20 min at 4℃. Total cell lysates were separated by SDS-PAGE and then transferred to a nitrocellulose membrane. Nonspecific binding was blocked using 5% non-fat milk in TTBS. The membrane was incubated with primary antibodies followed by secondary antibodies conjugated to horseradish peroxidase in blocking solution. Antibody-reactive proteins were detected using a chemiluminescence assay kit (Thermo Fisher Scientific, Waltham, MA).
Oil Red O staining
Cells were washed with PBS and fixed with 4% formaldehyde for 1 h at room temperature. Lipid droplets in adipocytes were stained and photographed using freshly made 0.6% Oil Red O solution [18]. Cells were washed three times with 60% isopropanol and intracellular lipid contents were quantified by extracting Oil Red O with 100% isopropanol for 10 min. Absorbance was measured at 490 nm.
Quantitative RT-PCR
Total RNA was isolated using TRIzol reagent and subsequently analyzed by qRT-PCR using QuantiMix Probe One-Step Kit (PhileKorea, Seoul, Korea) and the Step One instrument (Applied Biosystems). The primer and probe sequences were as follows: (1) TonEBP: forward, 5'-CGAAATACAACTCCCTGCAAAG-3'; reverse, 5'-CCTCAGCTTCAATATTCCAACAC-3'; probe, 5'-/6FAM/TAGCAACAA/ZEN/CATGACACTGGCGGT/IABkFQ/-3' (2) GAPDH: forward, 5'-AATGGTGAAGGTCGGTGTG-3'; reverse, 5'-GTGGAGTCATACTGGAACATGTAG-3'; probe, 5'-/6-FAM/TGCAAATGG/ZEN/CAGCCCTGGTG/IABkFQ/-3'. All primers and probes were purchased from Integrated DNA Technologies. The relative mRNA expression levels were calculated according to the comparative CT method using GAPDH mRNA as a reference.
MTT assay
3T3-L1 cells infected with adenovirus were induced to differentiate for 2 days and subsequently incubated in 0.5 mg/ml MTT solution for 3 h. The formazan, converted dye, was solubilized in DMSO and quantitated by measuring the absorbance at 570 nm on a microplate reader (TECAN, Mannedorf, Switzerland).
Statistical analysis
All experiments were repeated independently at least three times. Data are presented as the mean±SEM. Statistical significance was determined by the Student's t test.
Go to :
RESULTS
TonEBP expression was decreased during adipocyte differentiation in 3T3-L1 cells
To examine TonEBP expression during adipocyte differentiation, 3T3-L1 cells were treated with differentiation factors. The degree of adipocyte differentiation was determined by the expression of fatty acid binding protein 4 (FABP4), a gene known to be increased in differentiated adipocytes. TonEBP protein was decreased from day 1 and maintained at a low level during the differentiation process thereafter (Fig. 1A and 1B). TonEBP mRNA was reduced at day 1 but was also maintained at a low level (Fig. 1C).
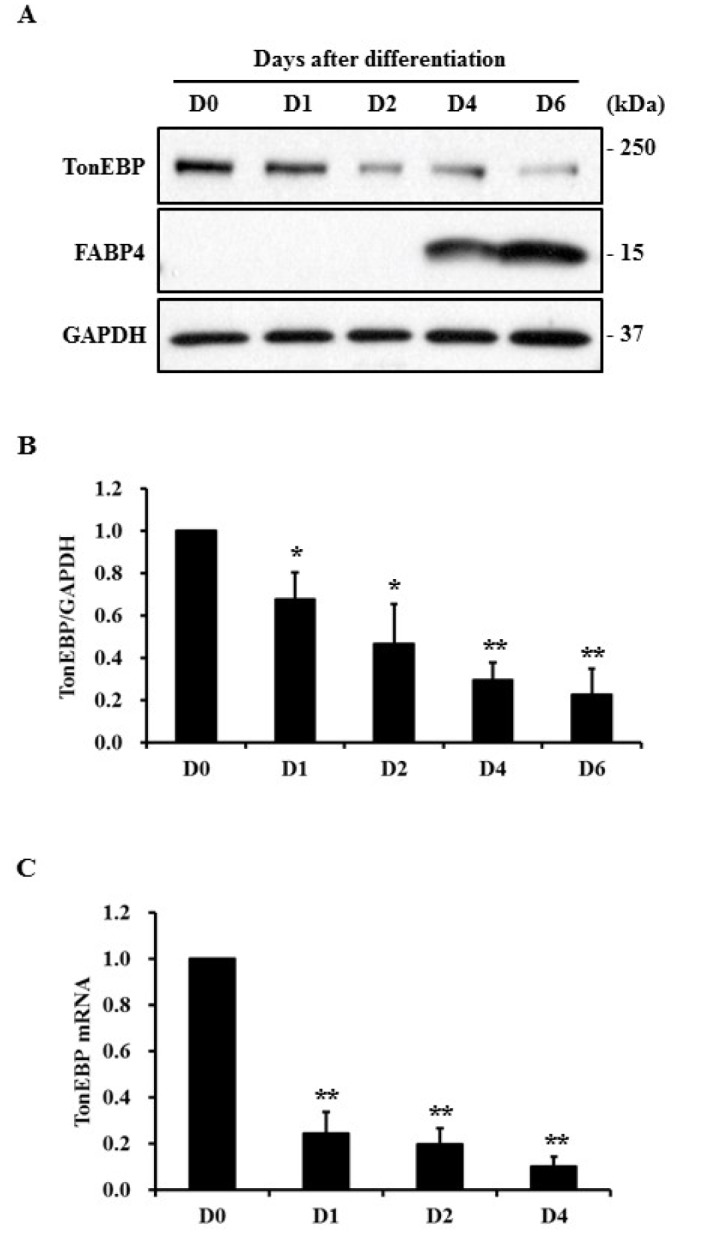 | Fig. 1Expression of TonEBP during adipocyte differentiation.3T3-L1 preadipocytes were induced to differentiate into adipocytes. (A) Total cell lysates were prepared at indicated times and protein expression was analyzed by immunoblotting. (B) TonEBP expression (A) was normalized to that of GAPDH and then presented as a relative value based on D0. (C) Expression of TonEBP mRNA at indicated times was measured by quantitative RT-PCR and presented as a relative value to D0. GAPDH mRNA expression was used as a reference. Values are mean±SEM. *p<0.05, **p<0.01 compared with D0 for each group (n≥3).
|
TonEBP suppressed adipocyte differentiation
To investigate the effect of TonEBP on adipocyte differentiation, 3T3-L1 preadipocytes were infected with recombinant adenovirus expressing TonEBP or transfected with TonEBP specific siRNA, and then subjected to adipogenic induction (Fig. 2A, 3A). Formation of lipid droplets, which was visualized and quantified by staining with Oil Red O, and FABP4 expression were used to assess adipogenesis. Lipid droplet formation and FABP4 expression were respectively reduced to 29% and 15% at day 6 in TonEBP-expressed cells compared to control cells expressing β-galactosidase (Fig. 2).
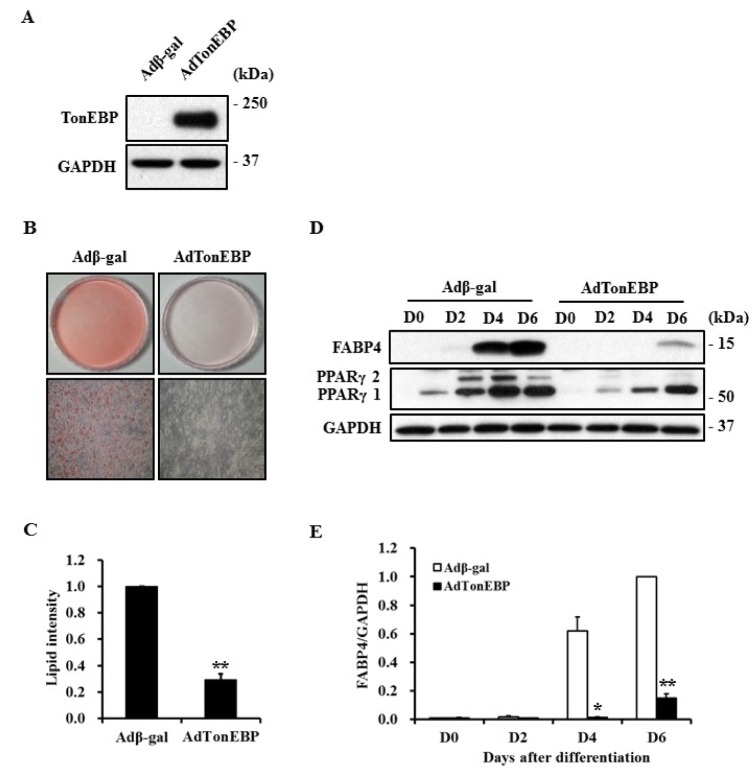 | Fig. 2Suppression of adipocyte differentiation by TonEBP.3T3-L1 cells were infected with recombinant adenovirus expressing β-galactosidase or TonEBP and then induced to differentiate into adipocytes. Expression of TonEBP (A) or adipogenic proteins (D) was analyzed by immunoblotting. (B) The degree of adipocyte differentiation was visualized by staining lipid droplets with Oil Red O at D6. (C) Lipid droplets shown in (B) were extracted with isopropyl alcohol and quantified as a relative value to Adβ-gal. (E) The quantity of FABP4 shown in (D) was normalized to that of GAPDH and then presented as a relative value to D6 of Adβ-gal. Values are mean±SEM. *p<0.05, **p<0.01 compared to Adβ-gal for each group (n=3).
|
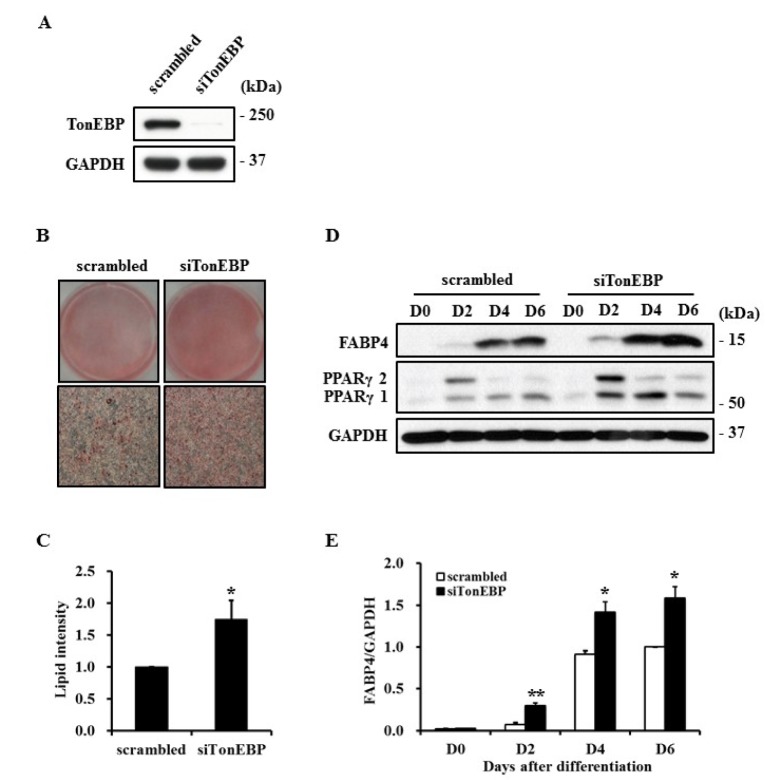 | Fig. 3Promotion of adipocyte differentiation by TonEBP knockdown.3T3-L1 cells were transfected with scrambled or TonEBP siRNA and then induced to differentiate into adipocytes. Expression of TonEBP (A) or adipogenic proteins (D) were analyzed by immunoblotting. (B) The degree of adipocyte differentiation was visualized by staining lipid droplets with Oil Red O at D6. (C) Lipid droplets shown in (B) were extracted with isopropyl alcohol and quantified as a relative value to scrambled siRNA. (E) The quantity of FABP4 shown in (D) was normalized to that of GAPDH and then presented as a relative value to D6 of scrambled siRNA. Values are mean±SEM. *p<0.05, **p<0.01 compared to scrambled siRNA for each group (n≥3).
|
Peroxisome proliferator activated receptor gamma (PPARγ) plays a major regulatory role in adipogenesis and its expression is controlled during differentiation [19]. As shown in Fig. 2D, expression of PPARγ1 and PPARγ2 were suppressed in TonEBPexpressed cells. However, knockdown of TonEBP using siRNA promoted expression of FABP4 and PPARγ as well as lipid droplet formation, suggesting the importance of TonEBP in the adipogenic process (Fig. 3).
TonEBP suppressed early responses to differentiation
In order to determine the mechanism of TonEBP, undifferentiated or differentiating 3T3-L1 cells were infected with adenovirus as indicated in Fig. 4A. TonEBP expression was similarly maintained until day 6, regardless of infection time (Fig. 4B). Lipid droplet formation and FABP4 expression were clearly suppressed by the overexpression of TonEBP before induction of differentiation. However, TonEBP expression had no effect on adipogenesis after the initiation of differentiation (Fig. 4C & D).
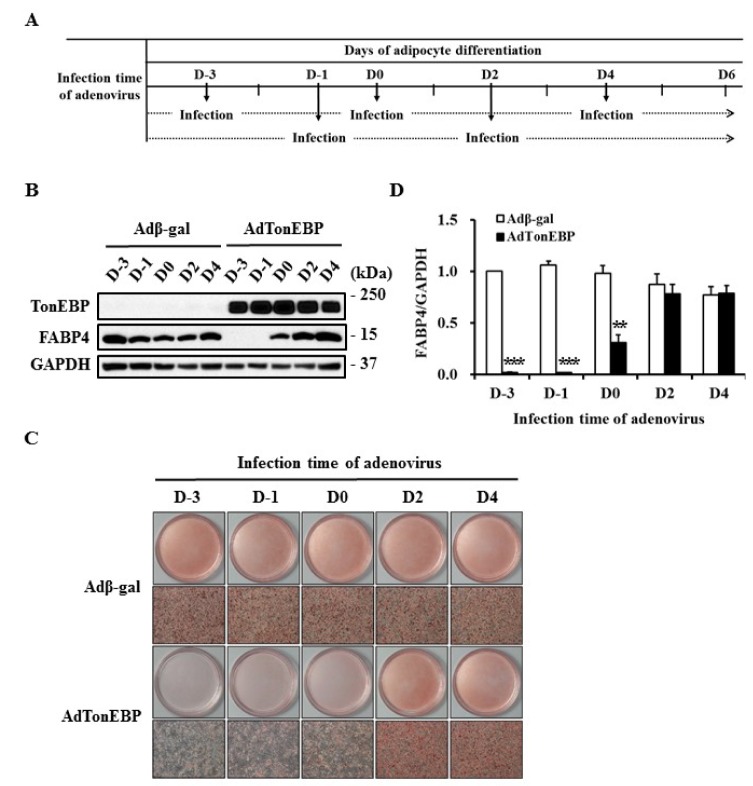 | Fig. 4Limited anti-adipogenic property of TonEBP in the early stages of adipocyte differentiation3T3-L1 cells were treated with differentiation factors at D0 for adipogenesis. Recombinant adenoviruses were infected at indicated times as described in (A). (B) Expression of each protein was analyzed by immunoblotting. (C) The degree of adipocyte differentiation was visualized by staining lipid droplets with Oil Red O at D6. (D) The quantity of FABP4 shown in (B) was normalized to that of GAPDH and then presented as a relative value to D-3 of Adβ-gal. Values are mean±SEM. **p<0.01, ***p<0.001 compared to Adβ-gal for each group (n=6).
|
Induction of the insulin signaling pathway and MCE occurs in the early phase of adipogenesis and is required for the differentiation of 3T3-L1 preadipocytes to adipocytes. Cell number was increased by 1.5-fold 2 days after induction of differentiation in control cells. In contrast, MCE did not occur in TonEBP expressed cells (Fig. 5A). Adipogenic stimuli induced phosphorylation of insulin receptor substrate (IRS-1) and Akt 10 min after stimulation, which was sustained for up to 60 min. However, TonEBP expression markedly inhibited these phosphorylation events in 3T3-L1 cells. These results suggest that TonEBP may play an important role in the early response to differentiation.
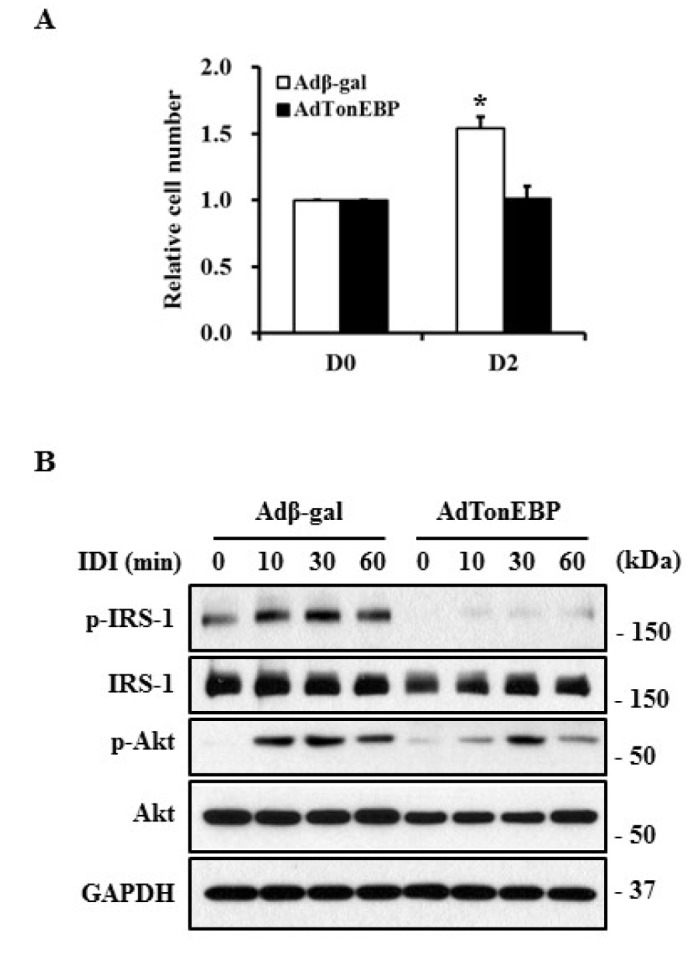 | Fig. 5Suppression of MCE and insulin signaling with TonEBP overexpression.3T3-L1 cells infected with recombinant adenoviruses were treated with differentiation factors (IDI) for the indicated times. (A) Cell number was determined via MTT assay and presented as a relative value to DO. (B) The protein levels of phosphorylated IRS-1 (p-IRS-1), IRS-1, phosphorylated Akt (p-Akt), and Akt in these cells were detected by immunoblotting using specific antibodies. The experiment was repeated three times with similar results.
|
Go to :
DISCUSSION
TonEBP was initially identified as a tonicity-regulated transcription factor involved in the protection of cells from hypertonic stress [2021]. However, several later studies suggested that TonEBP might also be implicated in aspects of cell physiology such as proliferation, differentiation, survival, and migration. In this study, we demonstrate that TonEBP expression was reduced in early differentiation and this is required for 3T3-L1 cells to differentiate into adipocytes (Fig. 1, 2, 3). However, the overexpression of TonEBP had no effect on adipogenesis after the initiation of differentiation (Fig. 4). These results suggest that TonEBP plays a crucial role in suppressing the initial signal that induces the differentiation of adipocytes.
Upon the addition of differentiation factors, growth-arrested 3T3-L1 preadipocytes reenter the cell cycle in a process referred to as mitotic clonal expansion (MCE). This is required for the sequential expression of transcription factors and terminal differentiation [2223]. The insulin-activated Akt pathway is also known to play a critical role in adipogenesis [2425]. When the insulin receptor was disrupted, adipogenesis and adipose development was also impaired in vitro and in vivo, respectively [2627]. Our data showed that TonEBP expression inhibited MCE and insulin signaling (Fig. 5). Although TonEBP association with the cell cycle has not been reported, TonEBP affected insulin signaling in adipocytes isolated from animals and differentiated adipocytes from 3T3-L1 cells [28]. These results suggest that TonEBP may regulate adipogenesis though the control of insulin sensitivity and cell cycle regulation.
Mesenchymal stem cells can be differentiated into a variety of cell types including myocytes, chondrocytes, osteocytes, and adipocytes through the regulation of transcription factors and signaling cascades [29]. Several signaling pathways demonstrate an inverse relationship between adipogenesis and others, although there are signaling cascades with positive relationships. Among them, activation of the Wnt signaling pathway suppressed adipogenesis through the inhibition of GSK-3 activity but promoted myogenesis, chondrogenesis, and osteogenesis [3031]. TonEBP was also reported to promote differentiation during skeletal muscle regeneration and chondrocyte differentiation, unlike in adipogenesis [28]. TonEBP is a well-known transcription factor that controls gene expression in response to hypertonicity. However, some reports demonstrate that TonEBP can control gene expression without hypertonic stimulation [2]. Wnt3a was expressed in a TonEBP-dependent manner during cardiomyogenic differentiation [3]. We also observed that more than a hundred genes, including wnt5a and wnt7b, are regulated by TonEBP in isotonic MEF cells (data not shown). Therefore, investigation of TonEBP target genes in undifferentiated cells and the underlying mechanisms involved in differentiation need to be conducted.
Go to :
 XML Download