

 PDF
PDF ePub
ePub Citation
 Print
Print


INTRODUCTION
Atrial fibrillation (AF) is the most common cardiac arrhythmia and it increases the risk of stroke, heart failure, dementia, and mortality [1]. One of the effective treatments for controlling AF is radiofrequency catheter ablation (RFCA) [2]. Although pulmonary vein isolation (PVI) is mainly operated to control AF, PVI-only ablation often fails to control AF for some substrate, especially patients with persistent AF [23]. In 2004, Nademanee et al. [4] reported that left atrial (LA) ablation targeting complex fractionated atrial electrograms (CFAE) was effective for terminating sustained AF. However, recent systematic studies show that clinical outcomes of CFAE-guided LA ablation for longstanding persistent AF are variable [56]. The limitations of CFAE-guided AF ablation are its subjectivity, and the spatiotemporal variation of CFAE, which makes it difficult to identify the exact target sites for CFAE-guided ablation and to study the electrophysiological mechanisms of CFAE [78]. Although these limitations have been somewhat overcome by clinically reproducible 3-dimensional (3D) mapping [910], CFAE may be affected by the direction and configuration of the bipolar catheter at the recording sites on the endocardial surface. Although it was reported that catheter orientation impacts electrogram morphology [1112], its effects on the CFAE map has not yet been studied. Therefore, we hypothesize that the direction and inter-electrode distance of the bipolar catheter affects the 3D-CFAE map. Because it is technically challenging to reproduce a CFAE map by changing the catheter direction and electrode configurations in a dynamic fibrillation state, we tested this hypothesis in a patient-specific in-silico homogeneous model of the LA. The purpose of this study is to test the spatial reproducibility of CFAE maps for varying catheter directions and inter-electrode distances.
Go to : 
METHODS
3D atrial fibrillation modeling
The study protocol adhered to the Declaration of Helsinki and was approved by the Institutional Review Board of Yonsei University Health System. An included patient provided written informed consent for Yonsei AF Ablation Cohort (clinicaltrials. gov NCT02138695). We simulated AF in a homogeneous in-silico human LA model of an 83-year old female patient with persistent AF who underwent RFCA, as published previously [13]. The LA geometry (triangular mesh with 400,000 nodes) was constructed from computed tomography data by using the NavX system. (St. Jude Medical Inc., Minnetonka, MN, USA). Cellular ionic currents were calculated using the Courtemanche et al. human atrial myocyte model [14], and electrical wave conduction in tissue was modeled by the following partial differential equation [15]:
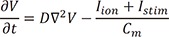
where V is the transmembrane potential, D is the diffusion coefficient that represents gap junctional coupling, Iion and Istim are the total transmembrane ionic current and stimulus current, respectively, and Cm=100 pF is the membrane capacitance of a human atrial myocyte. The diffusion coefficient was adjusted to reproduce a conduction velocity of 0.4 m/s. To initiate AF, we used a series of localized stimulations that mimics an experimental ramp pacing protocol [16]. Cells located near the LA high septum were stimulated at cycle lengths of 200, 190, and 180 ms consecutively. We applied the Runge-Kutta method with an adaptive time step of Δt=0.005~0.05 ms and the generalized finite difference scheme on the LA surface mesh [17]. The code was parallelized using CUDA.
Configuration of virtual bipolar catheter and calculation of CFAE cycle length
To generate the virtual bipolar electrogram, we designed virtual bipolar catheter based on the currently utilized clinical catheter (Conventional catheter: distal electrode 3.2×2.0 mm, proximal electrode 1.5×2.0 mm, inter-electrode distance 4.75 mm; Fig. 1A) [18]. Also, we adopted a recently developed mini recording electrode catheter (Mini-catheter), which has a smaller electrode size (1.0×1.0 mm) and shorter inter-electrode distance (2.5 mm) than the conventional one (Fig. 1B). We defined the catheter direction as the angle (θ) measured from a reference line, which is the intersection of the transverse plane and the tangent plane, to the catheter orientation (Fig. 1C). At each point of the LA, we configured the virtual bipolar catheter through 16 uniformly distributed orientations (θ=0, 22.5,......, 337.5°).
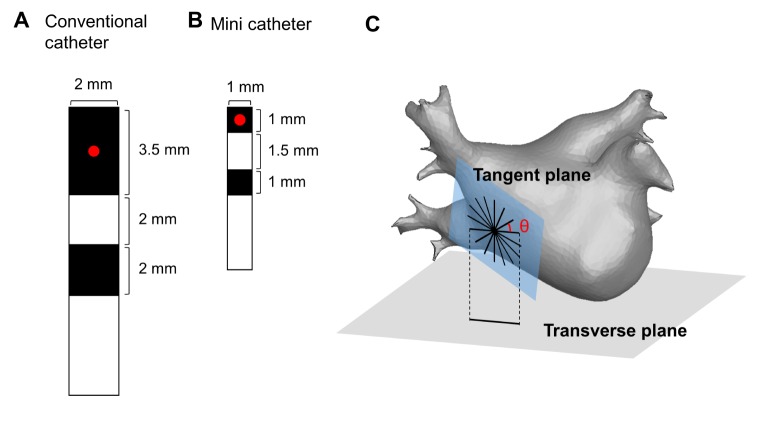 | Fig. 1Design and configuration of the virtual bipolar catheter(A) Design of the conventional bipolar catheter (conv-cath). (B) Design of the mini catheter (mini-cath). The recording site (red point) is defined as the center of the distal electrode. (C) Configuration of the virtual bipolar catheter for 16 different orientations at each point of the tangent plane on the left atrial surface.
|
The virtual bipolar electrogram was computed by subtracting the average of the extracellular potential from proximal and distal electrodes. We approximated the extracellular potential φe by the following equation [19]:
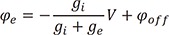
where gi and ge are the intracellular and extracellular conductivity, respectively, V is the transmembrane potential, and φoff is the offset potential [20]. The signal was band-pass filtered at 30~200 Hz. CFAE-cycle length (CL) was calculated by measuring the time intervals between consecutive deflections during a 6-second bipolar electrogram. Deflections were identified by a maximum-negative slope. To prevent multiple counting of a single deflection and far-field effects, a refractory period of 40 ms and duration of 15 ms were set [13].
At each point of the LA, 6-second bipolar electrograms were simultaneously recorded for 16 different catheter configuration (θ=0, 22.5, ......, 337.5°) and those CFAE-CLs were calculated. Furthermore, for each θ=0, 22.5, ......, 337.5°, we generated color-coded CFAE-CL map from CFAE-CLs measured at a fixed catheter direction θ (briefly called a θ-CFAE map).
Comparison of electrograms and CFAE maps
To evaluate the influence of the catheter direction on the bipolar electrogram, we compared morphology and CFAE-CL of the electrograms recorded at different catheter directions. For each point of the LA, "morphological similarity index" was defined by the mean of inner product between two normalized electrogram signals, following the equation [21]:
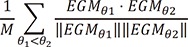
where M is the number of (θ1, θ2) pairs (16C2=16×15/2=120) and EGMθ1, EGMθ2 are bipolar signal vectors recorded at the different catheter directions θ1 and θ2, respectively. The morphological similarity index is closer to 1 when the morphology of the electrograms is less influenced by catheter directions. Additionally, at each point of the LA mesh, we calculated the "coefficient of variation of CFAE-CLs" by dividing the SD of 16 CFAE-CLs by the average of 16 CFAE-CLs.
Additionally, we compared 16 different θ-CFAE maps. We performed point-to-point linear correlation analysis of CFAECLs for all pairs of θ1-CFAE and θ2-CFAE maps. Furthermore, to study changes in the distribution of CFAE sites (CFAE-CL <120 ms), the "ratio of consistent CFAE sites", defined as the percentage of common CFAE sites in θ-CFAE map, was calculated for each θ-CFAE map.
All data from the conventional catheter were compared with those of the mini catheter.
Clinical mapping of CFAE map
Intracardiac bipolar electrograms were recorded for 6 second using Prucka CardioLab Electrophysiology system (General Electric Health Care System Inc., Milwaukee, WI, USA). All signals were exported at sampling rate of 2.0 kHz and bandpass filtered from 32 to 300 Hz. CFAE-CL was calculated as the average time duration between consecutive deflections, which were identified by downstroke morphology between the localmaximum and the local-minimum. We set a refractory period of 40 ms to avoid multiple detections of a single deflection event. Also, an electrogram width of 15 ms was set to exclude the detection of the far-field event [22].
Statistical analysis
All data are presented as the mean value±SD. The linear correlation analyses between two CFAE maps (16C2=16×15/2=120 pairs) were performed with a Bonferroni correction. A total of 120 pairwise Pearson correlation coefficients were compared between the conventional and mini catheters using a Fisher z-transformation. The coefficient of variation of CFAE-CLs was compared using McKay's approximation. Mann-Whitney U tests were utilized to compare the morphological similarity index and consistent CFAE ratio between the conventional and mini catheters.
Go to :
RESULTS
CFAE-CL variation depending on bipolar catheter orientations
At each of the 400,000 points of the LA surface, we recorded 6-second bipolar electrograms for 16 different catheter directions and then calculated the morphological similarity indices and coefficient of variations of CFAE-CL among them. Depending on the catheter orientations facing the fibrillating wavefront, there was morphological variation in the electrogram on the LA surface and changing CFAE-CL at the same sites of the distal electrode. The morphological similarity index of the electrogram was 0.32±0.09 and the coefficient of variation of CFAE-CL was 11.5±0.7% when the electrograms were recorded by conventional catheter configuration at 400,000 nodes (Fig. 2).
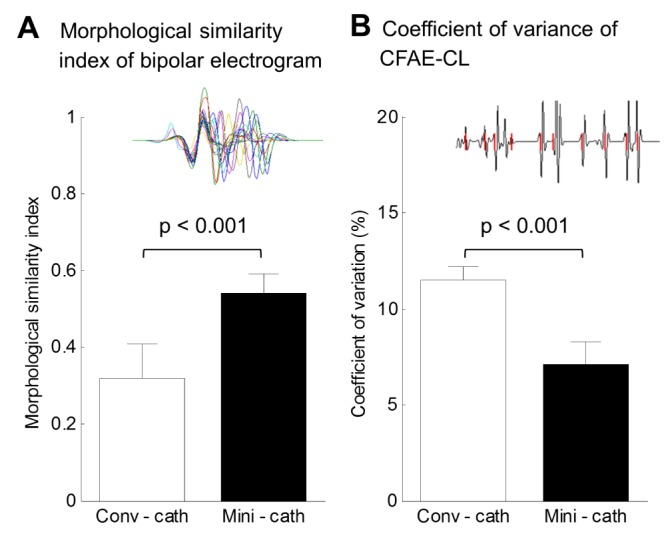 | Fig. 2Morphological similarity index and coefficient of variation of CFAE-CL among virtual bipolar electrograms of 16 different directions.(A) Morphological similarity index of bipolar electrogram between conventional catheter (conv-cath) and mini catheter (minicath). (B) Coefficient of variation of complex fractionated atrial electrogram-cycle length (CFAE-CL) between conv-cath and mini-cath. Both indices were calculated at each of the 400,000 nodes of the left atrial surface, and those from conv-cath were compared to mini-cath (p<0.001). Mean and SD are presented.
|
CFAE obtained using the mini-catheter is less influenced by catheter orientations
Depending on the configuration of the virtual bipolar electrode, the morphologies of the electrograms were different between the conventional catheter (inter-electrode distance 4.75 mm, Fig. 3) and mini-catheter (inter-electrode distance 2.5 mm, Fig. 4). The morphological similarity index of the mini catheter (0.54±0.05) was higher than that of the conventional catheter (0.32±0.09, p<0.001); that is, the mini catheter produced less morphological variation with changing catheter directions (Fig. 2A). Depefnding on the catheter directions, the coefficient of variation of CFAE-CL recorded by the virtual mini catheter (7.1±1.2%) was significantly lower than that recorded by the virtual conventional catheter (11.5±0.7%, p<0.001). Therefore, the mini catheter produced less variable CFAE-CL than the conventional catheter with varying the catheter orientation (Fig. 2B).
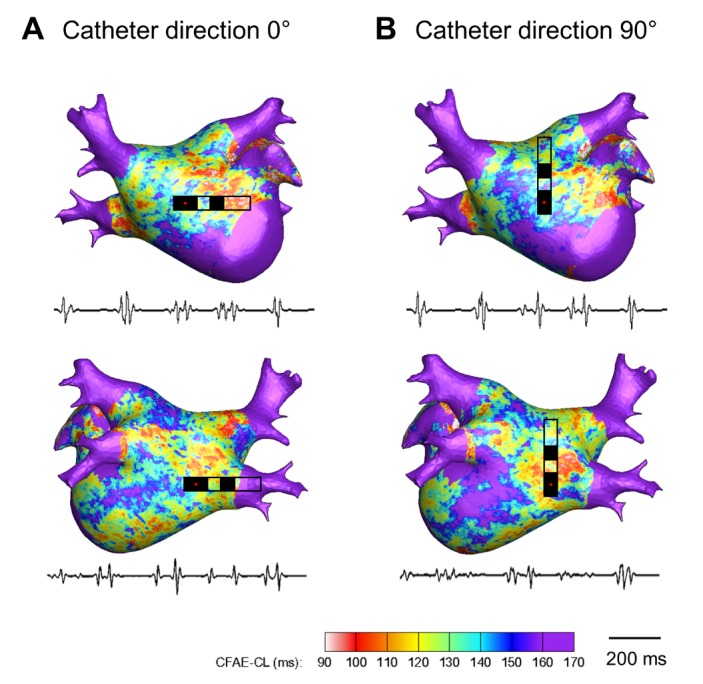 | Fig. 3Color-coded CFAE-CL map recorded by the conventional catheter (3.5mm tip, inter-electrode distance 4.75mm) at different catheter directions (θ=0° and 90°).(A) CFAE-CL map at catheter direction of θ=0°. (B) CFAE-CL map at catheter direction of θ=90°. Onesecond recordings of virtual bipolar electrograms at the tip of the distal electrode are presented.
|
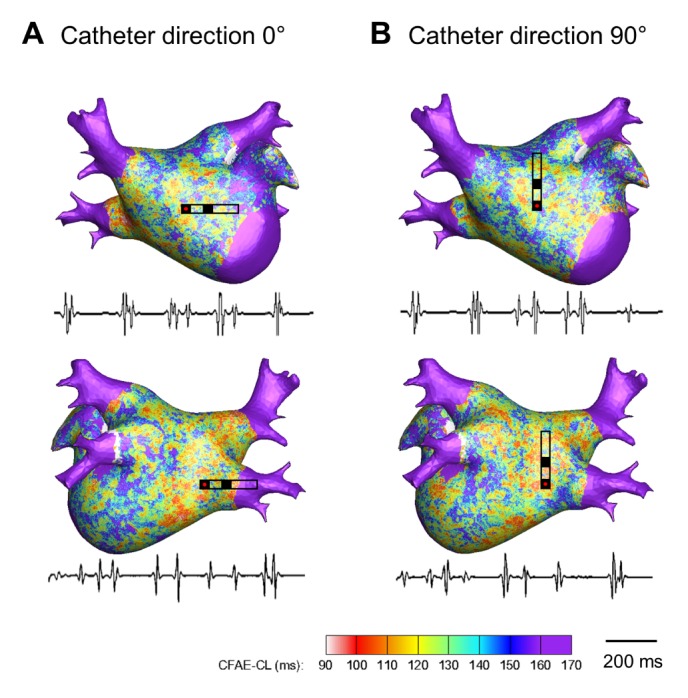 | Fig. 4Color-coded CFAE-CL map recorded by the mini catheter (1.0 mm tip, inter-electrode distance 2.5 mm) at different catheter directions (θ=0° and 90°).((A) CFAE-CL map at catheter direction of θ=0°. (B) CFAE-CL map at catheter direction of θ=90°. One-second recordings of virtual bipolar electrograms at the tip of the distal electrode are presented.
|
Spatial correlations and consistency of CFAE area
The 16 different θ-CFAE maps were compared by pairwise linear correlation analysis of the CFAE-CLs as shown in Fig. 5. Catheter orientation dependent CFAE maps obtained by the conventional catheter show weak correlations with each other (r=0.3055±0.2194, p<0.001), but a moderate correlation was observed in the mini catheter cases (r=0.6074±0.0733, p<0.001). By comparing the correlation coefficients between the conventional and mini catheters, the CFAE maps acquired for different catheter directions show higher correlations with the mini catheter than the conventional catheter (p<0.001). For the conventional catheter, 22.3±1.4% of the CFAE sites (CFAE-CL< 120 ms) of each of the θ-CFAE maps were consistent regardless of the catheter direction. However, the ratio of consistent CFAE sites was 38.3±4.6% for the mini catheter, which was significantly larger than that of the conventional catheter (p<0.05).
 | Fig. 5Analysis of the reproducibility of the CFAE map depending on the catheter direction.(A) Point-to-point linear correlation of CFAE-CL between the 0°-CFAE map and the 90°-CFAE map. (B) Pairwise correlation coefficients (r) between the θ1-CFAE and θ2-CFAE maps. The mean r values were 0.3055 ± 0.2194 (p<0.001) and 0.6074±0.0733 (p<0.001) for the conventional catheter (conv-cath) and mini catheter (mini-cath), respectively.
|
Additionally, the regional distribution of the CFAE acquired by the virtual mini-catheter was similar to those by virtual conventional catheter or clinically acquired CFAE distribution (Fig. 6). For both conventional catheter and mini catheter, about one thirds of the total CFAE sites were located in the pulmonary veins and the septum, consistent to clinically acquired CFAE map. However, we did not perform statistical analysis with this single patient's data.
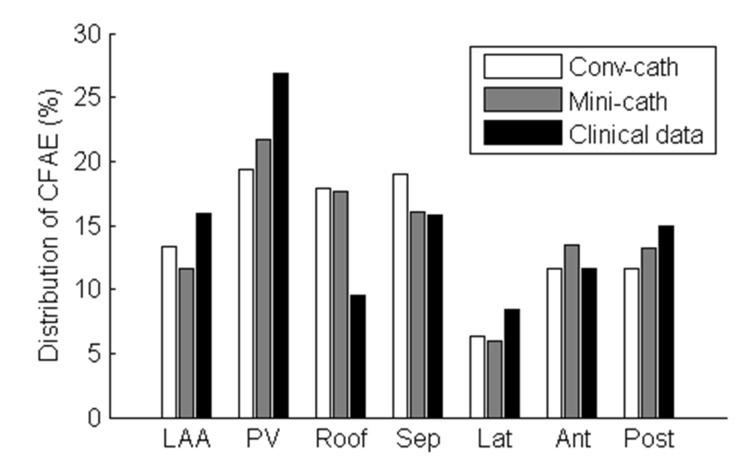 | Fig. 6Regional distribution of the CFAE area in the virtual CFAE map and the clinical CFAE map.The distribution of the consistent CFAE sites (CFAE-CL<120 ms) was calculated. LAA, left atrial appendage; PV, pulmonary veins; Roof, roof wall; Sep, septal wall; Lat, lateral wall; Ant, anterior wall; Post, posterior wall.
|
Go to :
DISCUSSION
In the current study, we conducted a computer simulation with a homogeneous human 3D-LA model to evaluate the consistency of the CFAE electrogram and its distribution depending on catheter orientation and configuration. Directions and interelectrode distances of the virtual bipolar catheter significantly affected the characteristics of the electrogram and the location of the CFAE with moderate spatial consistency. The narrowly spaced virtual bipolar catheter was less influenced by catheter direction than the conventional catheter.
CFAE in AF catheter ablation
In 1997, Konings et al. [23] first mentioned CFAE in an intraoperative mapping of human AF. Nademanee et al.[4] reported catheter based CFAE mapping and ablation in 2004. Nademanee and other groups reported excellent clinical outcomes of CFAE-guided LA ablation; termination or organization of sustaining AF in 66% to 96% [424], which indicates that the CFAE locus plays a role in AF maintenance. However, electrogram guided ablation is quite subjective, and the clinical outcomes of CFAE ablation in other reports varied greatly, with the sinus rhythm maintenance rates ranging between 54% and 74% [6]. Takahashi et al. [24] reported that only 17% of the CFAE areas were related to the termination of AF. Therefore, a limitation of CFAE-guided AF ablation is that it cannot differentiate CFAE with an active driver or passive wave-breaker. We previously reported that the distribution of CFAE is variable depending on the degree of electroanatomical remodeling [22]. CFAE can be affected by temporal phenomena caused by autonomic activity, electrical remodeling, or anatomical substrates [2225].
Mechanism and spatial reproducibility of CFAE
The mechanism of CFAE is not fully understood. According to recent clinical studies, a fractionated electrogram is related to a wavebreak or a high frequency focal reentrant source termed a rotor [26], which are thought to be major maintenance mechanisms of AF [27]. Additionally, simulation studies show that phase singularity points of electrical waves or slow conduction zones produced by micro-fibrosis can produce a fractionated electrogram [1828]. Many investigators have found that CFAE shows high temporal stability[10], but some recent studies show that CFAE-CL varies temporally [78]. The dynamic nature of the CFAE might be attributed to the dynamic change of fibrillation waves or meandering of the focal AF driver [829]. Although 3D-CFAE maps provide a relatively objective CFAE area [910] keeping the spatiotemporal reproducibility [78], a bipolar electrogram is highly affected by the direction and size of the electrodes [1112]. Therefore, we tested the reproducibility of the CFAE map depending on catheter direction and electrode configuration. We used a homogenous in-silico atrial model to show simple and purely electrophysiological CFAE, excluding anatomical or histological factors and autonomic activity. In this study, the CFAE-CLs varied significantly depending on the catheter directions, and the CFAE sites were consistent at 22.3% of sites. Since the proximal electrode detects a different wavefront during recording of the bipolar electrogram, it may produce a variation of a CFAE-CL depending on the catheter directions. However, the mini catheter produced less CFAE-CL variation and greater CFAE spatial stability for varying catheter orientations. This may be because the mini electrode and short inter-electrode distance may reduce the detection of far field events and have an advantage in recording the local small dynamics of the electrical wave.
Role of simulation modeling of AF
Generally, the roles of in-silico computational modeling are 1) to detect very minimal transient changes that are difficult to be noticed by experiments [1330], 2) to simplify or complicate the conditions by changing multiple parameters [31], or 3) to conduct virtual interventions that carry some risk or irreversible changes to predict the outcomes [32]. Cardiac arrhythmia might be a perfect candidate for a simulation study; it is difficult to predict the catastrophic clinical events, its management has limited efficacy and safety, and it is very complicated and affected by many factors.
On the other hand, there has been enormous progress in AF ablation skill, technique, mapping system, and catheter design, but the recurrence rate of AF is still substantial. Therefore, patient-specific computer simulation may also enable operators to choose the best ablation design for each patient [1333]. In our research, we generated high-density CFAE maps recorded by 16 different catheter directions simultaneously to verify the reproducibility of the 3D-CFAE map and the usefulness of the mini catheter.
Limitations
In our in-silico LA model, regional tissue heterogeneity, fiber orientation, fibrotic tissue, and autonomic neural effects were not considered. However, we could detect and analyze purely electrophysiological CFAE with this homogenous in-silico atrial model. Although the right atrium was not included in our simulation to reduce the computational complexity, these limitations do not alter the main findings of the present study. It has been known that the LA contains the main drivers for AF maintenance [3435]. To compute the bipolar electrogram, we applied the simplified method which was already validated by Potse et al. [19], however, the more accurate methods [3637] may provide more realistic electrogram.
Go to :
CONCLUSIONS
Catheter orientations and electrode configurations affect bipolar electrograms and CFAE distribution in this homogeneous in-silico LA model. However, there was moderate spatial correlation of CFAE-CLs for different catheter directions. The narrowly spaced bipolar catheter was less influenced by catheter direction than the conventional catheter.
Go to :
 XML Download