

 PDF
PDF ePub
ePub Citation
 Print
Print


INTRODUCTION
Leptin, an adipokine predominantly produced by adipose tissue, acts as a biomarker molecule for obesity, since elevated circulating level of leptin is closely associated with the increased body mass index and adipose mass [1]. In addition to its critical metabolic role, leptin is also closely associated with incidence of cancer development [234]. Upon binding with its receptor (Ob-Rb), leptin induces activation of various signal transduction, including JAK/STAT, MAPK and PI3K pathways [5], most of which are involved in the proliferation of cancer cells. Leptin treatment also resulted in suppression of apoptosis in cancer cells via increasing expression of the genes related with cell survival, including survivin and BCL2 [4], and induction of autophagy [6].
p53, originally reported as a potent tumor suppressor, is well known to play an important role in apoptosis induction in cells undergoing DNA damage and loss of p53 function has been considered as one of the most common causes in cancer development [7]. In response to cellular stress and/or DNA damage, p53 is activated and induces a number of downstream target genes, which eventually leads to the varied range of biological processes to prevent tumorigenesis [8]. In addition, p53 has been recently shown to inhibit tumorigenesis via direct interaction and subsequent inhibition of the various anti-apoptotic molecules [910], indicating that tumor suppressing effects of p53 can be also mediated through transcription-independent mechanisms. Interestingly, in contrast to its well-known tumor suppressing effects, p53 has been recently shown to act as an active mediator for pro-survival signaling pathways. For example, p53 has been shown to contribute to the increased survival of many cancer cell types in the face of chronic starvation via autophagy induction [11] and protect cancer cells from UV-induced apoptosis via direct binding with c-Jun-N-terminal kinase [12]. Furthermore, close to physiological levels of the wild-type p53 endorses cell survival and specifies that p53 gives rise to an anti-apoptotic phenotype [13]. Collectively, these previous reports indicate that the biological function of p53 in the modulation of tumor growth would be depending on cellular contexts and/or growth environments, although the underlying mechanisms determining the fate of p53 as a pro- or anti-survival signaling are mostly beyond our understanding.
The cellular expression level of p53 can be regulated by a number of different mechanisms. In addition to the transcriptional regulation, ubiquitination and proteasomal degradation plays a crucial role in controlling the cellular p53 level. Deubiquitinating enzymes are the essential component responsible for preventing ubiquitination, thus stabilizing the target proteins. Ubiquitin specific protease 2 (USP2), a deubiquitinating enzyme, has been shown to regulate expression of many genes connected to the regulation of cell number in various types of cancer cells [141516]. We have previously shown that leptin treatment induces increase in USP2 expression in hepatic and breast cancer cells, which plays a critical role in the cell cycle progression induced by leptin [17]. While it has been shown that USP2 is involved in the regulation of cancer growth and leptin induces USP2 expression, the functional role of USP2 in leptin-induced p53 expression has not been explored.
Based on previous reports, it is well established that leptin induces tumor growth and p53 signaling plays an important role in the regulation of cancer cell growth. However, the role of p53 signaling in leptin-induced tumor growth has not been explored. In the present study, to better understand the molecular mechanisms underlying leptin-induced tumor growth, we investigated the effect of leptin on p53 expression and further its functional role in growth of cancer cells by leptin. Herein, we demonstrated for the first time that p53 signaling contributes to leptin-induced tumor growth via modulation of cell cycle progression and suppression of apoptosis in hepatic and breast cancer cells. Moreover, we also showed that induction of USP2 plays a pivotal role in leptin-induced increase in p53 expression.
Go to : 
METHODS
Materials
Reagents used for the cell culture were obtained from HyClone laboratories (South Logan, UT, USA). Recombinant mouse leptin was purchased from Sigma-Aldrich (St. Louis, MO, USA). Cell viability (MTS assay) and Caspase-3/7 activity assay kits were gained from Promega Corporation (Madison, WI, USA). Cell cycle test plus DNA reagent kit was acquired from BD (San Jose, CA, USA). Antibodies against p53, Bax, Cyclin D1, USP2 and β-actin were procured from Cell Signaling (Beverly, MA, USA). Antibody against ubiquitin, a mouse monoclonal antibody raised against amino acids 1-76 representing full length Ub of bovine origin, was obtained from Santa Cruz Biotechnology (Santa Cruz, CA, USA). All other chemicals were obtained from Sigma-Aldrich (St. Louis, MO, USA) unless stated elsewhere.
Cell culture
Human hepatoma (HepG2) and breast cancer cell line (MCF-7) were purchased from American Type Culture Collection (ATCC) (Rockville, MD, USA). HepG2 cells were cultured in Dulbecco's Modified Eagle Medium (DMEM) supplemented with 10% FBS, 1% penicillin–streptomycin and 0.1% amphotericin. MCF-7 cells were cultured in DMEM supplemented with 10% FBS and 1% penicillin–streptomycin. Cells were cultured at 37℃ and 5% CO2 in an incubator with a humidified atmosphere.
Cell viability assay (MTS assay)
For the determination of cell viability, MTS assay was performed essentially as described previously [18]. Briefly, cells were seeded at the density of 4×10⁴ cells per well in 96-well plates. After treatment with leptin indicated in the figure legends, cells were then incubated with MTS (3-(4, 5-dimethylthiazol-2-yl)-5-(3-carboxymethoxyphenyl)-2-(4-sulfophenyl)-2H-tetrazolium) solution (20 µl) for 2 h at 37℃. The resultant cell viability was determined by measuring absorbance at 490 nm using Versamax microplate reader (Sunnyvale, CA, USA).
Caspase-3/7 activity assay
Caspase-3/7 activity was assessed by using Caspase-Glo 3/7 assay kit (Promega Corporation) essentially as described previously [19]. In brief, cells were seeded at the density of 4×10⁴ cells per well in 96-well plate and treated with leptin as indicated in the figure legends. Caspase-3/7 activity was assessed by measurement of luminescence generated from the cleavage of luminogenic substrate Ac-DEVD-pNA with a micro-plate reader (Fluostar Optima, BMG Labtech, Germany).
RNA isolation, reverse transcription (RT) and quantitative PCR (qPCR)
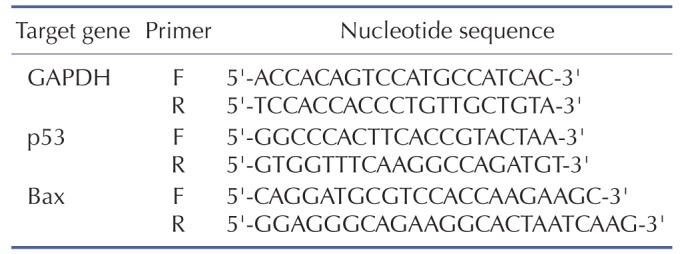
For the measurement of mRNA levels of genes of interest, total RNAs were isolated using Qiagen lysis solution (Qiagen, MD, USA). One microgram of mRNA was reverse transcribed for the preparation of cDNA and real time-PCR amplification was then performed with a Roche Light Cycler 2.0 (Mannheim, Germany) using absolute qPCR SYBR green capillary mix AB gene system (Thermo Scientific, UK) at 95℃ for 15 min followed by 40 cycles at 95℃ for 15 s, 60℃ for 30 s and 72℃ for 30 s as described previously [20]. GAPDH was used as an internal control. The primer sequences used for the amplification of target genes are listed in Table 1.
Preparation of cellular extracts and Western blot analysis
For the measurement of protein expression level of genes of interest, total cellular extracts were prepared using RIPA lysis buffer containing halt protease inhibitor cocktail (Thermo Scientific, Rockford, IL, USA). For immunoblot analysis, 30 µg of solubilized protein was separated by SDS–PAGE and transferred to PVDF membrane. The membrane was then blocked with 5% skimmed milk, incubated with the respective primary antibodies (all antibodies are diluted 1:1,000 in 3% BSA) for overnight and then incubated with secondary antibodies conjugated with horseradish peroxidase. Chemiluminescent images of the blots were finally obtained using Fujifilm LAS-4000 mini (Fujifilm, Tokyo, Japan). The membranes were then stripped and reprobed with β-actin as internal loading control. To determine the expression level of the genes of interest in Xenograft in vivo experiment, tumor lysates were prepared from the Xenograft mice as described previously [6] and followed the rest of the procedures.
Transient transfection with small interfering RNA (siRNA)
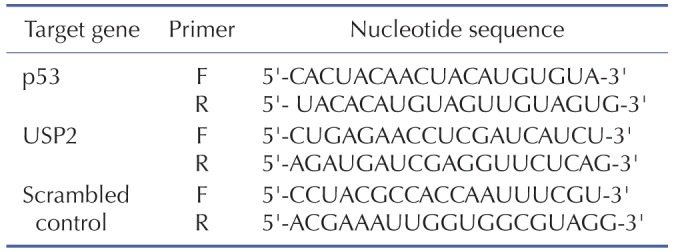
Cells were transfected with corresponding siRNA of target genes or scrambled control siRNA with Hiperfect transfecting reagent (Qiagen) as described previously [21]. Gene silencing efficiency was assessed by Western blot analysis after 48 h of transfection. siRNA duplexes used for this study were chemically synthesized by Bioneer (Daejeon, South Korea) and are listed in Table 2.
Cell cycle analysis
Cell cycle analysis was performed using Cycle test plus DNA reagent kit (BD, USA) according to the manufacturer's instructions. Cells were seeded at the density of 2×10⁵ cells per 35 mm dish. After the required treatment with leptin, buffer solutions (solution A and solution B) were sequentially added according to the instruction. Finally, solution C (Propidium iodide, 200 µl) was added and incubated for 10 min in the dark. DNA content of the stained cells was then analyzed by a flow cytometer (BD, FACSVerse) and distribution of cells in each cell cycle phase was determined using Flow Jo X software.
Immunoprecipitation and immunoblot analysis
The level of ubiquitinated p53 in HepG2 cells was determined by immunoprecipitation and immunoblot analysis as described previously [17]. HepG2 cells were seeded at the density of 2×10⁶ cells in 100 mm dish. After overnight incubation, cells were treated with leptin for the indicated time duration and total proteins were then extracted with lysis buffer containing 150 mM NaCl, 1% NP-40, 50 mM HEPES, 1 mM PMSF, 5 mM EDTA, 0.5 mM DTT. The total cell lysates were incubated with 25 µl of Pierce Protein G Agarose (Thermo Scientific, Rockford, IL, USA) for 1 h at 4℃ on a rocker. The protein G agarose was removed by centrifugation at 5,000 g for 5 min. Five hundred microgram of protein lysates was incubated with p53 antibody in the ratio of 1:200 for overnight to form the immune complex. The complexes were then incubated with Protein G Agarose (25 µl) for 4 h at 4℃. After centrifugation at 5,000 g for 3 min, the bead pellet was washed with IP lysis buffer for three times. For denaturation, the pellet was suspended in denaturation buffer (60 µl) and heated at 100℃ for 5 min. After elution of the denatured protein, the protein samples were separated by SDS-PAGE electrophoresis, transferred onto the PVDF membrane, incubated with anti-ubiquitin antibody and finally visualized by chemiluminescent substrate as described earlier.
Preparation of Xenograft model
To investigate the effect of leptin on the expression of p53 and USP2 in vivo, HepG2 tumor Xenograft model was prepared and tumor lysates were prepared essentially as described previously [6], as per the guideline issued by Yeungnam University Research Committee. In brief, for the establishment of Xenografts, HepG2 cells (1×10⁷ cells) were injected subcutaneously into the rear flanks of four weeks old male BALB/c nude mice. After two weeks of initial implantation, animals were randomly divided into two groups (n=5 per group). Leptin was injected intraperitoneally every 36 h for the duration of treatment. After four weeks of the treatment, the mice were sacrificed, and tumor lysates were prepared and subjected to further analysis.
Statistical analysis
Values are presented as mean±SEM of at least three independent experiments. Data were analyzed by one-way analysis of variance and Tukey's multiple comparison tests using GraphPad prism software version 5.01 (La Jolla, CA, USA). Differences between groups were considered to be significant at p<0.05.
Go to :
RESULTS
Leptin increases expression of p53 in hepatic and breast cancer cells
To determine the involvement of p53 signaling in leptin-induced growth of cancer cells, we first investigated the effect of leptin on p53 expression in human hepatic (HepG2) and breast cancer (MCF-7) cells. As shown in Fig. 1, leptin treatment induced increase in p53 protein expression in a dose- and time-dependent manner in HepG2 cells (Fig. 1A and 1B). Similarly, leptin also significantly enhanced p53 protein expression in MCF-7 cells (Fig. 1E and 1F). However, mRNA level of p53 was not significantly affected by leptin treatment in HepG2 (Fig. 1C and 1D) and MCF-7 cells (Fig. 1G and 1H). Collectively, these results suggest that leptin enhances p53 expression in cancer cells via post-transcriptional mechanisms.
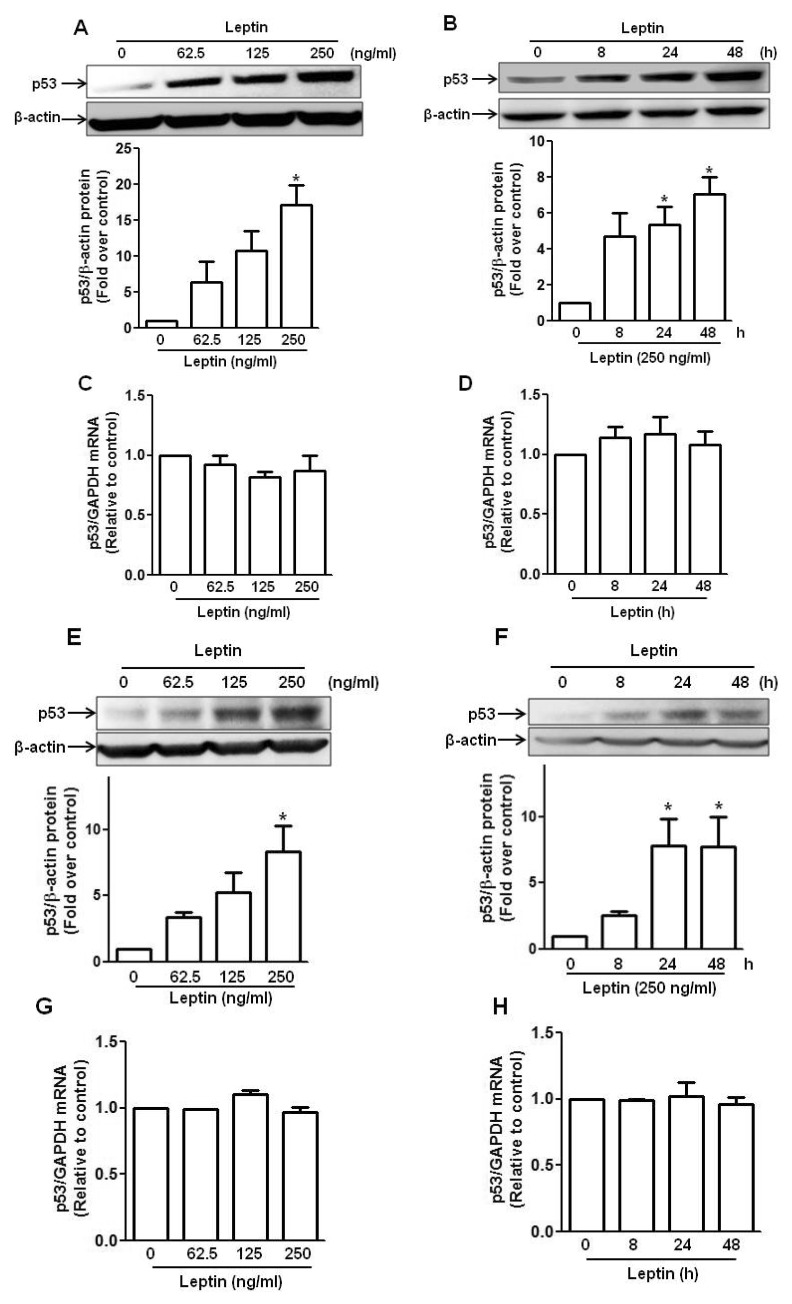 | Fig. 1Effect of leptin on the expression of p53 in hepatic and breast cancer cells.(A, B, C and D) HepG2 cells were treated with indicated concentration of leptin for 48 h (A and C) or 250 ng/ml of leptin for indicated time periods (B and D). (E, F, G and H) Similarly, MCF-7 cells were treated with indicated concentration of leptin for 48 h (E and G) or 250 ng/ml of leptin for indicated time periods (F and H). Protein expression level of p53 was determined by Western blot analysis as described in materials and methods (A, B, E and F). (Upper panel) Representative images of three independent experiments are shown along with β-actin as an internal loading control. (Lower panel) Quantitative analysis of p53 expression was performed by densitometric analysis and presented as mean±SEM (n=3). *p<0.05 compared with control group. (C, D, G and H) Messenger RNA level of p53 was determined by qRT-PCR analysis normalized to GAPDH. Data are expressed as mean±SEM of three to six independent experiments. *p<0.05 compared to the control group.
|
Leptin increases expression of p53 and USP2 in HepG2 tumor Xenograft model
Following the increased expression of p53 in vitro condition, we next confirmed the effect of leptin on p53 expression in vivo using HepG2 tumor Xenograft model in BALB/c nude mice. As shown in Fig. 2A, leptin treatment significantly elevated p53 protein expression in tumor Xenograft consistent with in vitro observations. Next, for investigating the mechanisms underlying leptin-induced p53 expression, we examined the effect of leptin on the ubiquitination in p53, since ubiquitination has been considered as a principal mechanism for the regulation of p53 expression [22] and, in addition, we observed that leptin treatment increased p53 expression through post-transcriptional regulation (Fig. 1). We have previously shown that leptin increases expression of ubiquitin specific protease 2 (USP2), a deubiquitinating enzyme, in hepatic and breast cancer cells [17]. Herein, we confirmed the effect of leptin on USP2 expression in vivo model. As shown in Fig. 2B, treatment with leptin significantly increased USP2 expression in HepG2 tumor bearing mice, which is similar to the results from in vitro experiments [17].
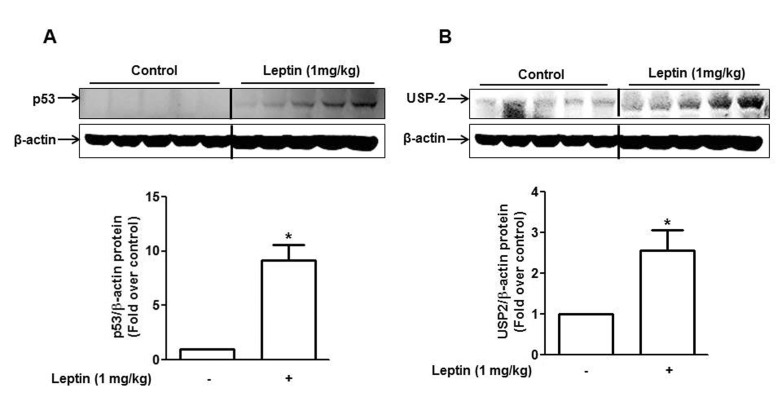 | Fig. 2Effect of leptin on the expression of p53 and USP2 in HepG2 Xenograft tumor model.BALB/c nude mice (4 weeks old male) were subcutaneously injected with HepG2 cells into the rear flanks. After two weeks of initial implantation, mice were randomly divided into two groups (control and leptin-treated group, n=5 per group). Leptin (1 mg/kg) was given intraperitoneally every 36 h for 4 weeks. p53 (A) and USP2 (B) protein expression were measured by Western blot analysis as described in materials and methods. Quantitative analysis of the p53 and USP2 expression was performed by densitometric analysis. Values are presented as mean±SEM (n=5). *p<0.05 compared to the mice not treated with leptin.
|
Leptin increases expression of p53 via suppression of ubiquitination in cancer cells
Next, to verify the functional role of USP2 in leptin-induced p53 expression, cancer cells were transfected with siRNA targeting USP2 or control scrambled siRNA, followed by treatment with leptin. Interestingly, leptin-induced increase in p53 expression was significantly suppressed by gene silencing of USP2 in both HepG2 and MCF-7 cells (Fig. 3A and 3B), suggesting the crucial role of USP2 and probably modulation of ubiquitination in leptin-induced p53 expression. To further examine the effect of leptin on ubiquitination of p53, ubiquitinated p53 level was measured by immunoprecipitation with anti-p53 antibody followed by immunoblotting with anti-ubiquitin. As shown in Fig. 3C, leptin treatment significantly decreased the level of ubiquitinated p53 in HepG2 cells as expected. Finally, to further delineate that leptin increases p53 expression through suppression of ubiquitination, we examined whether treatment with proteasomal activator prevents leptin-induced p53 expression. Pretreatment with betulinic acid, a pharmacological activator of proteasome, prevented leptin-induced p53 expression in HepG2 cells (Fig. 3D). All these results collectively imply the critical role of USP2 and ubiquitination in the modulation of p53 expression by leptin in cancer cells.
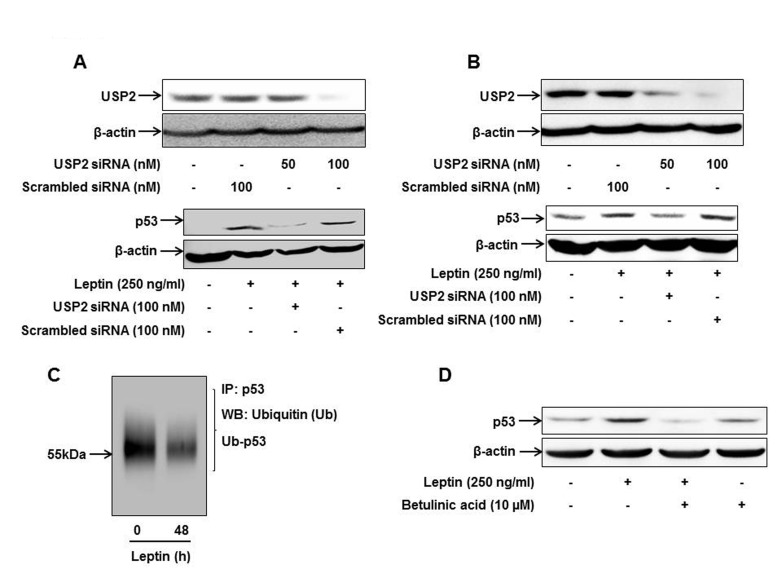 | Fig. 3Role of USP2 in leptin-induced p53 expression in cancer cells.HepG2 cells (A) and MCF-7 cells (B) were transfected with siRNA targeting USP2 or scrambled control siRNA followed by leptin treatment. (Upper panel) Transfection efficiency was determined after 48 h of transfection by Western blot analysis. (Lower panel) p53 protein expression was measured by Western blot analysis as described previously. (C) After treatment with leptin (250 ng/ml, 48 h), ubiquitinated p53 level was analyzed by immunoprecipitation using anti-p53 antibody and further immunoblotting with anti-ubiquitin antibody as described in the materials and methods. (D) HepG2 cells were pretreated with betulinic acid; an activator of proteasome, for 2 h followed by treatment with leptin for additional 48 h. p53 expression level was determined by Western blot analysis. Images are representative of three independent experiments that showed similar results.
|
p53 signaling is involved in leptin-induced cancer cell growth
To further validate that p53 signaling is implicated in leptin-induced growth of cancer cells, cells were transfected with siRNA targeting p53 and the cell number was determined by MTS assay. As depicted by Fig. 4, gene silencing of p53 significantly suppressed leptin-induced increase in cancer cell viability in both HepG2 (Fig. 4A) and MCF-7 (Fig. 4B) cells, while no significant effect was observed by transfection with scramble control siRNA, indicating the potential role of p53 signaling in leptin-induced cancer cell growth.
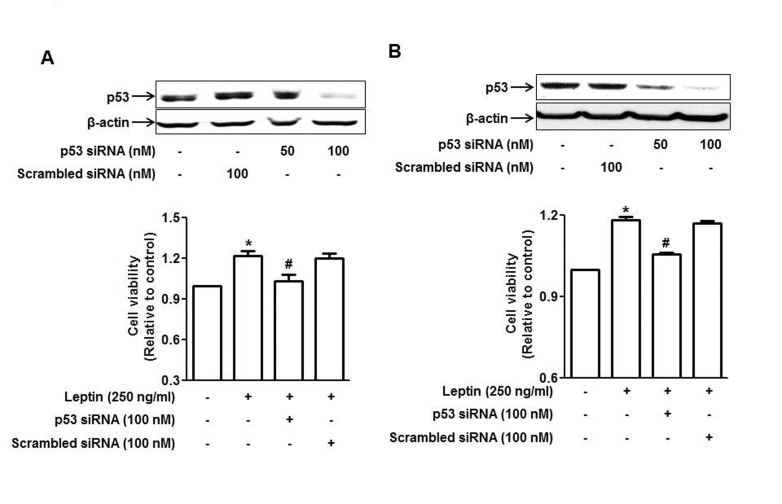 | Fig. 4Involvement of p53 signaling in leptin-induced growth of cancer cells.HepG2 cells (A) and MCF-7 cells (B) were transfected with siRNA targeting p53 or scrambled control siRNA followed by incubation with leptin for 48 h. (Upper panel) Transfection efficiency was determined after 48 h of transfection by Western blot analysis. (Lower panel) Cell viability was assessed by MTS assay as described in materials and methods. Values presented are the results of three independent experiments and are expressed as mean±SEM. *p<0.05 compared to the control group; #p<0.05 compared to the cells treated with leptin, but not transfected.
|
p53 signaling is involved in the suppression of apoptosis induced by leptin in HepG2 cells
The extent of cancer cell growth is regulated by apoptosis and cell proliferation. To further analyze the mechanisms how p53 signaling is implicated in leptin-induced growth of cancer cells, we first examined the role of p53 in the modulation of apoptosis by leptin. As shown in Fig. 5A, leptin treatment decreased caspase-3/7 activity in HepG2 cells consistent with previous reports. Interestingly, gene silencing of p53 restored suppression of caspase-3/7 activity, implying the involvement of p53 signaling in anti-apoptotic effects of leptin. To further elucidate the mechanisms underlying suppression of apoptosis, we examined the role of p53 in the regulation of Bax expression, a key inducer of intrinsic apoptotic pathway. As shown in Fig. 5B, leptin treatment decreased expression level of Bax consistent with previous reports. However, transfection with p53 siRNA almost completely restored suppression of Bax expression by leptin, indicating the role of p53 signaling in leptin-induced suppression of apoptosis via modulation of Bax expression in hepatic cancer cells.
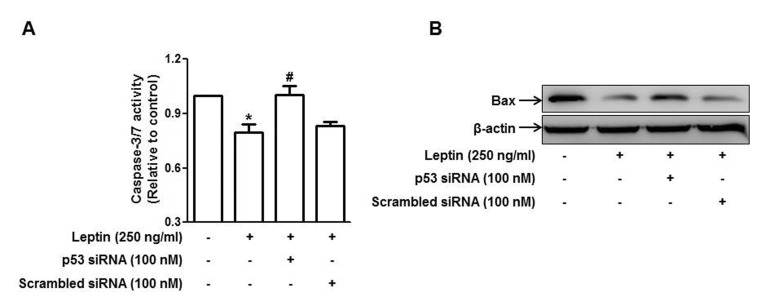 | Fig. 5Role of p53 signaling in leptin-induced suppression of apoptosis in HepG2 cells.Cells were transfected with siRNA targeting p53 or scrambled control siRNA followed by incubation with indicated concentration of leptin for 48 h. (A) Caspase-3/7 activity was assessed as described in materials and methods. Values are expressed as mean±SEM (n=3). *p<0.05 compared to the control group; #p<0.05 compared to the cells treated with leptin, but not transfected. (B) Bax protein expression was determined by Western blot analysis as described in materials and methods. Images are the representative of three independent experiments that showed similar results.
|
Cell cycle progression by leptin is mediated by p53 signaling in HepG2 cells
The growth of cancer cells can be also determined by the rate of cell proliferation, as well as the degree of apoptosis. We next examined if p53 signaling is also involved in leptin-induced proliferation of hepatic cancer cells. As shown in Fig. 6, treatment of HepG2 cells with leptin caused cell cycle progression showing the significant increase in the number of cells at S-phase, while the number of cells in G0-G1 phase decreased consistently with previous reports. However, knocking down of p53 gene inhibited leptin-induced cell cycle progression (Fig. 6A), indicating that p53 signaling plays a role in the regulation of cell cycle in cancer cells treated with leptin. To further elucidate the mechanism(s) underlying modulation of cell cycle by leptin and p53, we examined expression of the genes regulating cell cycle. As shown in Fig. 6B, transfection with p53 siRNA resulted in prevention of leptin-induced increase in the expression of cyclin D1, which interacts with cyclin dependent kinase 4/6 (CDK4/6) and induces G1/S phase transition. We further examined if leptin and p53 modulate expression of other cell cycle regulator, including cyclin E, which interacts with cyclin dependent kinase 2 (Cdk2). However, leptin treatment did not significantly affect expression of cyclin E (data not shown). These results indicate that cyclin D1, rather than cyclin E, would be a target molecule for the progression of cell cycle by leptin in hepatic cancer cells.
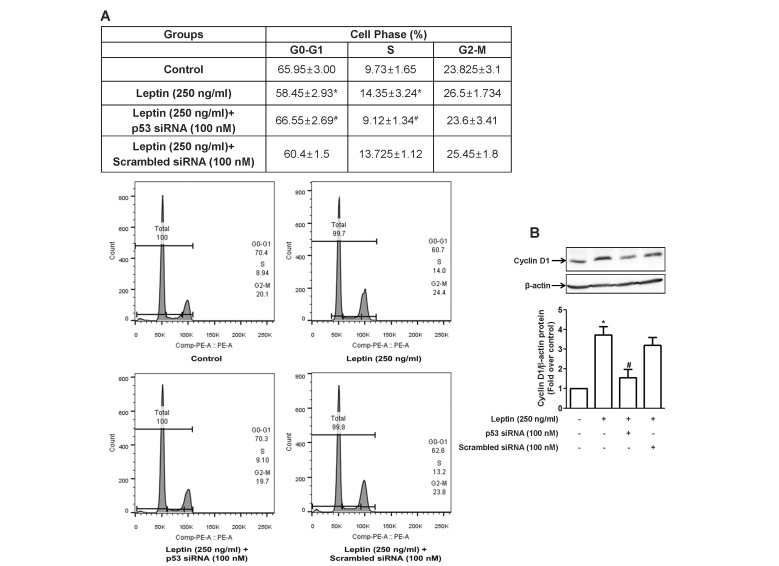 | Fig. 6Role of p53 signaling in leptin-induced cell cycle progression in HepG2 cells.Cells were transfected with siRNA targeting p53 or scrambled control siRNA followed by incubation with indicated concentration of leptin for 48 h. (A) Cell cycle was analyzed using flow cytometer as described in materials and methods. (Upper panel) Values are the percentage of the cells in each of the cell cycle phases and are expressed as mean±SEM (n=5). (Lower panel) Images are the representative image of the five independent experiments which showed similar results. (B) Cyclin D1 protein expression level was determined by Western blot analysis. (Upper panel) Representative images of three independent experiments are shown along with β-actin for internal loading control. (Lower panel) Quantitative analysis of p53 protein expression was performed by densitometric analysis and presented as mean±SEM (n=3). *p<0.05 compared to the control cells; #p<0.05 compared to the cells treated with leptin, but not transfected with siRNA.
|
p53 signaling is implicated in autophagy induction by leptin
Autophagy is a self-digestive process, which removes damaged intracellular organelles and/or proteins via autophagosome-lysosome machinery. While autophagy was originally reported as a distinct type of cell death and therefore associated with tumor suppression, accumulating recent evidences have demonstrated that autophagy can act as a cytoprotective and cell survival mechanism depending upon the cellular contexts [23]. In particular, a recent study has reported that autophagy induction contributes to leptin-induced growth of hepatic cancer cells [6]. In the present study, we investigated the role of p53 signaling in leptin-induced autophagy activation. As indicated in Fig. 7, leptin treatment induced increase in the expression of the genes related with autophagy, including microtubule-associated protein 1 light chain 3 (LC3), Atg5 and Beclin-1 consistent with previous reports. Interestingly, knock-down of p53 gene by transfection with siRNA targeting p53 substantially prevented leptin-induced increase in Atg5 and Beclin-1 expression and LC3 II accumulation, suggesting the potential role of p53 signaling in autophagy induction by leptin.
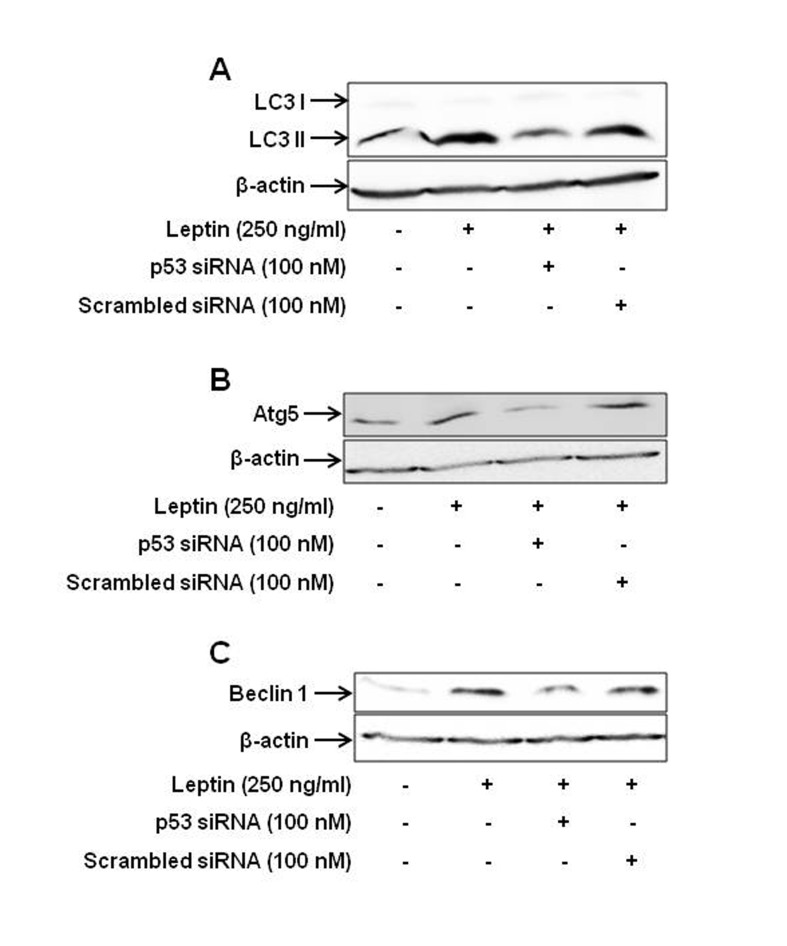 | Fig. 7Role of p53 signaling in leptin-induced increase in the expression of the genes related with autophagy.HepG2 cells were transfected with siRNA targeting p53 or scrambled control followed by incubation with leptin (250 ng/ml) for 48 h. Protein expression level of LC3 II (A), Atg5 (B) and Beclin-1 (C) was determined by Western blot analysis as indicated in the materials and methods. Images are the representative of three separate experiments that showed similar results.
|
Go to :
DISCUSSION
Epidemiological studies demonstrated the strong co-relationship between obesity and incidence of cancer. One of the plausible mechanism for the association of obesity with cancer is the abnormal physiological function of adipose tissue leading to insulin resistance, chronic inflammation and altered secretion of adipokines [24]. Of the various adipokines, enhanced plasma level of leptin is closely associated with development and growth of cancer [2526]. Previous reports have indicated that leptin-induced tumor growth is mediated via modulating both apoptosis and progression of cell cycle. For example, leptin induces proliferation of cancer cells by inducing expression of the genes implicated in cell cycle progression and/or suppressing expression of the genes acting as an inhibitor of cell cycle [27]. Leptin has been also shown to suppress apoptosis by down-regulating pro-apoptotic genes [24]. However, the detailed molecular mechanism(s) underlying cancer progression by leptin is still largely unknown. In the present study, we have demonstrated that leptin treatment induces increase in p53 expression in both hepatic and breast cancer cells via modulation of ubiquitination. Furthermore, p53 signaling contributes to leptin-induced tumor growth through cell cycle progression and suppression of apoptosis.
Since its first discovery more than 30 years ago [28], p53 has long been considered as a potent tumor suppressor gene. It has been shown that p53 plays a critical role in suppressing development and/or progression of tumor via broad range of responses, including DNA repair, regulation of cell cycle and apoptosis induction [29303132]. In addition, mutation and loss of p53 function is one of the most common features in various different types of cancers. However, over the past years, accumulating evidences have also clearly demonstrated that many tumors retain wild type p53 expression and wild type p53 engages in the pro-survival pathways. For example, p53 signaling has been shown to impart increased survival rate of cancer cells via autophagy induction [11] and prevent UV-induced apoptosis in cancer cells via direct binding and inhibition of JNK [12]. In addition, a number of previous studies have further demonstrated the anti-apoptotic functional properties of p53 in certain types of experimental conditions [29], indicating that the role of p53 in the regulation of tumor growth would be determined by cellular context, growth environment and the type of stimulus used, although what factor(s) determine the functional role of p53 in cancer regulation is still largely unknown. In particular, p53 has been shown to exhibit pro-survival effects under mild stressful condition [293334] and low and close to physiological level of the wild-type p53 endorses cell survival [34]. On the other way, mutation of p53 gene generates totally opposite biological responses to the wild-type in the modulation of cancer development and growth [35]. Many tumor-associated mutant p53 proteins not only lose tumor suppressive functions of wild-type p53, but also gain new oncogenic functions, including promoting angiogenesis, metastasis, anti-apoptosis and metabolic changes, which are defined as mutant p53 gain-of-function [8]. In the present study, we have used HepG2 hepatic and MCF-7 breast cancer cells. Previous studies have demonstrated the wild type nature, but not mutation, of p53 in HepG2 and MCF-7 cell line [363738], indicating that tumor promoting effects of p53 signaling observed in this study would not be due to p53 gain-of-function.
Cell cycle is essential for the growth of the cells and, undoubtedly, dysregulation of the cell cycle is the important factor in driving the progression of cancer. It has been well reported that p53 inhibits formation of tumor via cell-cycle arrest in G1 phase after DNA damage via multiple mechanisms, including transcriptional up-regulation of p21WAF1/CIP1, which acts as an inhibitor of cyclin dependent kinases [394041]. Conversely, other studies have indicated that such a connection between the up-regulation of p53 and G1 arrest is not absolute in tumor cells [42434445], and p53 can be involved in the progression of cell cycle in certain types of experimental condition [46]. Interestingly, data presented in this study demonstrated that p53 signaling was involved in leptin-induced cell cycle progression, as well as suppression of apoptosis, in hepatic cancer cells. We have previously shown that leptin treatment induces cell cycle progression from G1 to S phase in hepatic and breast cancer cells, in which cyclin D1 was involved [17]. In the present study, genetic ablation of p53 prevented leptin-induced increase in cyclin D1 expression (Fig. 6B), confirming the potential role of cyclin D1 in the regulation of cell cycle by leptin and p53 signaling. To the best of our knowledge, this is the first report demonstrating the involvement of p53 signaling in leptin-induced cyclin D1 expression, Herein, we observed that p53 signaling seems to be involved in leptin-induced cyclin D1 expression. However, at this stage, only limited information regarding the molecular mechanisms for the regulation of cell cycle progression by p53 is available and further studies are now required to provide insights into the mechanisms underlying.
p53 signaling generates biological responses via a number of different mechanisms. Although, at this stage, we could not identify detailed mechanisms how p53 signaling induces tumor growth, we hypothesized that p53 signaling plays a role in leptin-induced tumor growth via autophagy induction. Autophagy, a self-digestive process mediated by lysosome-autophagosome machinery, has been shown to modulate cancer growth with complicated manner(s) depending upon the cellular contexts. While autophagy was originally reported as a tumor suppressive mechanism in the initial stage of cancer development [47], there has been an increasing evidence that cancer cells utilize autophagy for adjusting the stressful condition [4748]. We have previously shown that leptin treatment induces autophagy in hepatic and breast cancer cells [6], which plays a crucial role in the suppression of caspase-3 activity and Bax expression by leptin. In the current study, we found that gene silencing of p53 suppressed leptin-induced increase in expression of the genes related with autophagy, including LC3II, Atg5 and Beclin-1 (Fig. 7), indicating a crucial role of p53 signaling in leptin-induced autophagy induction. These results are in accordance with the previous report demonstrating that p53 mediates cell survival via autophagy induction in colorectal cancer cells under prolonged starvation [11]. In fact, it is well known that Bax acts as a target molecule of p53 in mediating apoptosis of cancer cells. However, in certain experimental conditions, p53 has been shown to inhibit expression of Bax in generating anti-apoptotic effects, which was mainly mediated via 14-3-3σ induction [49]. The 14-3-3 proteins are a family of signaling regulatory molecules which control the function of various proteins involved in apoptosis and cell cycle [2950]. Samuel et al., reported that p53 signaling was involved in the expression of 14-3-3σ, which further inhibited the expression of Bax [49]. With this in mind, it would be interesting to examine the role of 14-3-3σ in p53 signaling and regulating Bax expression on leptin treatment for the future study.
The cellular level of p53 is determined via multiple mechanisms. In the present study, we observed that leptin increased p53 protein expression (Fig. 1A, 1B, 1E and 1F) without significant effect on mRNA level (Fig. 1C, 1D, 1G and 1H), implying the post-transcriptional regulation for p53 expression by leptin. There is a growing appreciation that ubiquitinated p53 undergoes proteasomal degradation [51] and ubiquitination is a key mechanism for the maintenance of cellular p53 level. The destruction of protein substrates can be prevented by deubiquitinating enzyme prior to proteasomal degradation. Herein, we found that ubiquitin-specific protease 2 (USP2), a deubiquitinating enzyme, plays a crucial role in leptin-induced p53 expression via suppression of ubiquitination and further preventing proteasomal degradation (Fig. 3). To the best of our knowledge, this is the first report to demonstrate the functional role of USP2 in the modulation of p53 expression. Although USP-2 is well known to regulate a number of biological functions, the mechanisms underlying USP2 expression are still largely unknown. To elucidate the underlying mechanisms, we examined the involvement of MAPK signaling, since MAPK is one of the key signaling mechanisms responsible for mediating various biological functions induced by leptin. Interestingly, we observed that pretreatment with inhibitor of ERK, JNK or p38 MAPK significantly suppressed leptin-induced USP2 expression (data not shown), indicating the involvement of MAPK signaling in leptin-induced USP2 expression. However, detailed mechanisms underlying USP2 expression are not clearly understood. Future studies are now required to clarify the mechanisms underlying USP2 expression by leptin.
In conclusion, we have examined the potential role of p53 signaling in leptin-induced growth of cancer cells and its underlying mechanisms. Data presented have indicated that p53 signaling would play a role in leptin-induced tumor growth via cell cycle progression and suppression of apoptosis. Furthermore, we also demonstrated the involvement of USP2, a deubiquitinating enzyme, in leptin-induced increase in p53 expression, implying that inhibition of proteasomal degradation contributes to the enhanced p53 cellular level. Based on these findings, in addition to the well-known tumor suppressive effect of p53, we demonstrate that p53 signaling is a novel mechanism for leptin-induced development and progression of cancer. The dual nature of p53 would contribute to understand the cancer biology and development of promising strategies for the treatment of cancer. Further studies are now required to validate our findings in appropriate in vitro and in vivo model.
Go to :
 XML Download