

 PDF
PDF ePub
ePub Citation
 Print
Print


INTRODUCTION
Mesenchymal stem cells (MSCs) can be isolated from various tissues, including bone marrow, periosteum, trabecular bone, synovium, skeletal muscle, and adipose tissues [1]. MSCs show self-renewal capacity and long-term viability and can differentiate into various cell types, including adipogenic, osteogenic, chondrogenic, and myogenic lineages [123]. Proliferation and multilineage differentiation of MSCs is determined by various extracellular hormones and cytokines circulating in peripheral tissues [123]. A better understanding of MSC differentiation might reveal new pathways that can be exploited to develop strategies for regenerative medicine. During MSC differentiation, formation of multi-molecular complexes, which is initiated by adaptor proteins in most cases, is a crucial step [4].
Activities of insulin-like growth factor-1 (IGF-1) are mediated by IGF-1 receptor (IGF-1R), a member of tyrosine kinase family of growth factor receptors containing 2 extracellular α-subunits and 2 membrane-spanning β-subunits that constitute an intracellular tyrosine kinase [5]. IGF-1 controls the mass of adipose tissue by regulating adipogenesis [6]. Adipose tissue is the organ for storage of energy. In particular, adipose tissue plays an pivotal role as the active endocrine organ through the secretion of adipokines including leptin, adiponectin, IL-6 and TNF-α [7], indicating that the understanding of adipogenic differentiation of MSCs is important. IGF-1-associated signaling pathways are important in MSC biology [8]. Adaptor proteins play crucial roles in MSC activation. Binding of IGF-1 to the specific cell surface receptor results in the recruitment of receptor domains and triggers intracellular signaling cascades that lead to gene expression [45689].
Lnk contains a pleckstrin homology domain, an Src homology 2 (SH2) domain, and potential tyrosine phosphorylation sites, which are similar to those present in APS and SH2B. Lnk belongs to a family of adaptor proteins implicated in the integration and regulation of multiple signaling events [10]. In the immune system, Lnk regulates B cell production by negatively regulating pro-B-cell expansion [11]. Lnk also acts as a negative regulator of stem cell factor (SCF)-c-Kit signaling pathway [1213]. Lnk is positively regulated by IGF-1 in T cells from CHO, suggesting that it functions as both a positive and negative regulator of receptor tyrosine kinase signaling [14]. However, the physiological significance of this association is unknown. Therefore, we determined whether IGF-1R–Lnk complex regulated IGF-1-induced adipogenic differentiation of MSCs; in addition, we evaluated the role of Lnk in adipogenesis. In this study, we provide in vivo and in vitro evidence that Lnk plays a pivotal role in the modulation of MSC differentiation and regulates the adipogenesis of MSCs through the IGF-1/Akt/PPAR-γ pathway.
Go to : 
METHODS
Animals
The study included 8- to 10-week-old male BALB/cA-nu/nu, C57BL6, and Lnk–/– mice (kindly provided by Dr. Takaki, University of Tokyo) that were maintained under a 12-/12-h light/dark cycle in accordance with the regulations of Pusan National University. The mice were fed standard laboratory chow and water ad libitum. Study protocols were in agreement with the guidelines of the Institutional Animal Care and Use Committee of Pusan National University, Pusan, Korea (IACUC090017).
In vitro expansion of mouse adipose tissue-derived MSCs
Adipose tissue was obtained from C57BL6 mice (Jackson Laboratory, ME, USA, http://www.jax.org). The mice were kept in isolated cabinets under pathogen-free conditions and were fed autoclaved food and water ad libitum. Before collecting the adipose tissue, the mice were killed by performing cervical dislocation. Adipose tissue was excised from the epiploon, cut into small pieces, digested, and filtered. Cells obtained were cultured at 37℃ in a humidified atmosphere of 95% air and 5% CO2.
Induction of adipogenic differentiation
Wild-type and Lnk–/– MSCs were seeded (density, 3.7×10⁴ cells/cm2) in 12-well culture dishes containing a complete culture medium and were cultured for 2~3 days. Adipogenic differentiation was induced for 4~14 days by replacing the culture medium with an adipogenic medium (10% fetal bovine serum [FBS], 1 µM dexamethasone, 0.5 mM/ml 3-isobutyl-1-methylxanthine, and 200 µM indomethacin in α-MEM). Adipogenic differentiation was assessed using oil red O stain, which is an indicator of intracellular lipid accumulation.
Induction of osteogenic differentiation
Wild-type and Lnk–/– MSCs were seeded (density, 7.4×10³ cells/cm2) in 12-well culture dishes containing the complete culture medium and were cultured for 1 day. Osteogenic differentiation was induced for 21 days by replacing the culture medium with an osteogenic medium (10% FBS, 0.1 µM dexamethasone, 0.5 mM/ml ascorbate-2-phosphate, and 10 mM β-glycerophosphate in α-MEM). Osteogenic differentiation was assessed using alizarin red S stain (Sigma, St Louis, MO, USA), which is an indicator of mineralization.
Induction of chondrocyte differentiation
Chondrocyte differentiation was induced using Mouse Mesenchymal Stem Cell Functional Identification Kit (R&D systems, Inc., Minneapolis, MN, USA), according to the manufacturer's instructions.
Ex vivo adipogenic differentiation assay
In all, 1×10⁷ PKH-76-labeled cells were subcutaneously injected into BALB/cA-nu/nu mice. After 10 days, skin around the injected area was excised and was fixed overnight with 4% formaldehyde in phosphate-buffered saline at 4℃. Tissue fragments were embedded in paraffin and were frozen in liquid nitrogen. For histological analysis, 7-µm sections were cut using a microtome (Microm, Germany). These sections were first stained with hematoxylin and then with oil red O and were visualized under a bright-field or fluorescence microscope (Axiovert 200; Carl Zeiss, Germany).
Quantitative reverse transcription-polymerase chain reaction
For performing quantitative reverse transcription-polymerase chain reaction (RT-PCR), total RNA was isolated from cultured wild-type and Lnk–/– MSCs by using TRIzol (Thermo Fisher Scientific, Waltham, MA, USA), according to the manufacturer's instructions. The total RNA was reverse transcribed into single-stranded cDNA by using a reverse transcription kit (ELPIS, Daejeon, Korea). The cDNA obtained was used as a template for performing quantitative PCR with SYBR Green PCR Master Mix (Applied Biosystems, Carlsbad, CA, USA). Mean cycle threshold values from quadruplicate measurements were used to calculate gene expression, and gene expression levels were normalized using those of an internal control (β-actin).
Primer sequences
Sequences of primers used in RT-PCR are as follows: β-actin sense, 5'-aacaccccagccatgtacg-3'; β-actin antisense, 5'-atgtcacgcacgatttccc-3'; Lnk sense, 5'-acagccaacagagctgaggt-3'; Lnk antisense, 5'-cgttctcctatcccactgga-3'; FABP4 sense, 5'-gacaggaaggtgaagagc-3'; FABP4 antisense, 5'-gtcagccctttcataacacattc-3'; LPL sense, 5'-aacaaggtcagagccaagag-3'; and LPL antisense 5'-ccatcctcagtcccagaaaag-3'.
Western blotting
Proteins (20 µg) present in cell lysates were resolved by performing sodium dodecyl sulfate-polyacrylamide gel electrophoresis (SDS-PAGE) on a 10% gel and were transferred onto nitrocellulose membranes. The membranes were washed with TBST (10 mM Tris-HCl [pH 7.6], 150 mM NaCl, and 0.05% Tween-20), blocked with 5% skimmed milk for 1 h, and incubated with appropriate primary antibodies at dilutions recommended by manufacturers. The membranes were then washed and incubated with horseradish peroxidase-conjugated goat anti-rabbit IgG or goat anti-mouse IgG secondary antibodies. Protein bands were visualized using an enhanced chemiluminescence kit (Amersham Biosciences, Buckinghamshire, UK). Immunoprecipitation For immunoprecipitation
Immunoprecipitation
For immunoprecipitation (IP), cells were lysed using lysis buffer (1% Triton X-100 in 50 mM Tris-HCl [pH 7.4] containing 150 mM NaCl, 5 mM EDTA, 2 mM Na3VO4, 2.5 mM Na4PO7, 100 mM NaF, 200 nM microcystin lysine–arginine, and protease inhibitors). Cell lysates (300 mg) obtained were mixed with 10 mg monoclonal antibodies against mouse IGF-1R. The samples were incubated for 4 h, mixed with Protein A/G PLUS-Agarose beads (Pierce, Rockford, IL, USA), and incubated for additional 12 h. The beads were washed 4 times, and bound proteins were released by boiling the beads in SDS-PAGE sample buffer for 5 min. The samples were analyzed by performing western blotting with goat anti-Lnk polyclonal antibody.
Retroviral infection of Akt1
Generation and infection of retroviral particles for the expression of Akt genes were performed as previously described [15]. Ecotropic BOSC23 packaging cells were provided from Dr. Warren S. Pear, The University of Pennsylvania. Briefly, ecotropic BOSC cells were transiently transfected with pVSV-G and pCgp pantropic retroviral packaging constructs and pMIGR1-Akt/PKB retroviral. Cell-free viral supernatants were harvested at 24 h and used to infect MSCs derived from Lnk knockout mice. pMIGR-Akt/PKB contains kinase as well as green fluorescent protein (GFP) separated by an internal ribosome entry site, and thus, relative expression was assessed by GFP expression.
Statistical analysis
Data are presented as mean±standard error of mean (SEM). All the experiments were assessed using analysis of variance. Differences with p<0.05 were considered significant.
Go to :
RESULTS
Lnk promotes the adipogenic differentiation of MSCs
To evaluate the properties of murine adipose tissue-derived MSCs, we examined their chondrogenic, osteogenic, and adipogenic differentiation potentials. In vitro differentiation assays showed that both the types of MSCs could differentiate into chondrocytes, adipocytes, and osteoblasts, thus confirming the multipotent differentiation potential of these cells (Fig. 1A~1D). Interestingly, wild-type MSCs showed greater potential for adipogenic differentiation than Lnk–/– MSCs (Fig. 1C). Expression kinetics of Lnk during adipogenic differentiation were determined by performing quantitative RT-PCR at each time point. Lnk expression significantly increased after 7 days of differentiation (Fig. 1B), suggesting that Lnk regulated the adipogenic differentiation of MSCs.
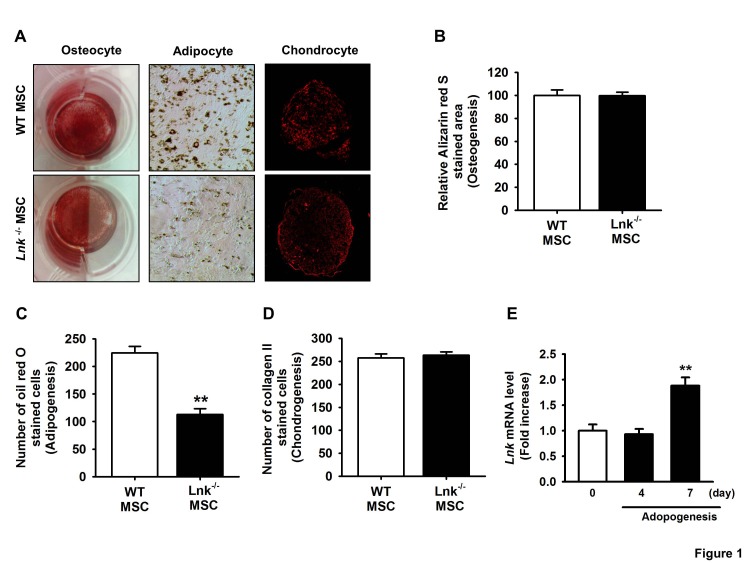 | Fig. 1Differentiation of adipose tissue-derived mesenchymal stem cells.(A) Wild-type (WT) and Lnk–/– mesenchymal stem cells (MSCs) were differentiated in vitro into chondrocytes, osteocytes, and adipocytes. (B) Osteocyte differentiation was quantified as the relative Alizarin red S stained area. Values represent the mean±standard error of mean (SEM). (C) Adipocyte differentiation was quantified as the number of oil red O stained cells. Values represent the mean±SEM; **p<0.01 vs. WT MSC. (D) Chondrocyte differentiation was quantified as the number of collagen II stained cells. Values represent the mean±SEM. (E) Lnk mRNA expression during adipocyte differentiation in wild-type MSCs was measured by performing quantitative reverse transcription-polymerase chain reaction (RT-PCR). Values are expressed as mean±SEM; **p<0.01 vs. values obtained after 4 days.
|
Lnk is required for ex vivo adipogenic differentiation
The function of Lnk in adipogenic differentiation was assessed by performing the ex vivo adipogenic differentiation assay. Wild-type and Lnk–/– MSCs were labeled with PKH-67 (green fluorescence). The 2 types of labeled MSCs were injected in wild-type mice, and the injected cells were identified using a fluorescence microscope. Subcutaneous injection of wild-type and Lnk–/– MSCs in nude mice resulted in significant adipogenic differentiation, as indicated by oil red O staining (Fig. 2A). However, Lnk–/– MSCs showed lower ex vivo adipogenic differentiation potential than wild-type MSCs (Fig. 2B).
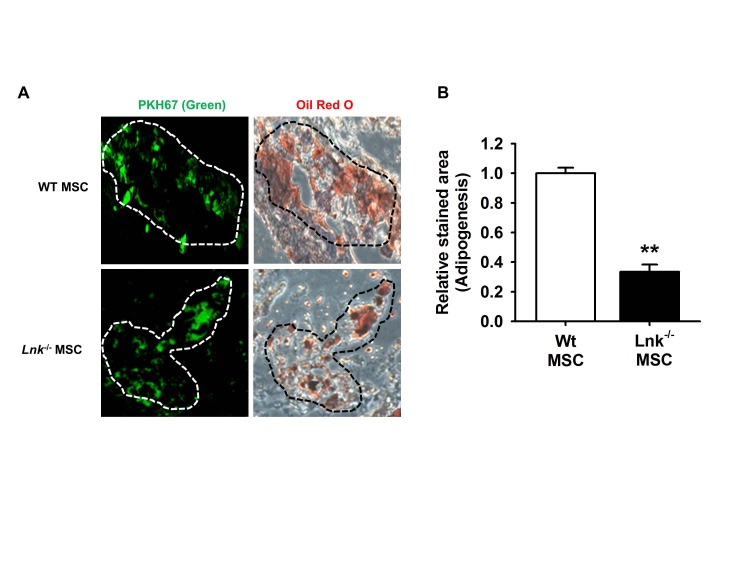 | Fig. 2In vivo adipogenic differentiation of adipose tissue-derived MSCs.(A) Wild-type (WT) or Lnk–/– MSCs were labeled with PKH-67 (green fluorescence), injected subcutaneously into nude mice, and allowed to differentiate for 10 days. Tissue sections showing green fluorescence were stained with hematoxylin or oil red O. Dotted lines indicate PKH-67- or oil red O-stained sites. (B) Adipocyte differentiation was quantified as the relative oil red O stained area. Values represent the mean±standard error of mean (SEM); **p<0.01 vs. WT MSC.
|
IGF-1-induced IGF-1R–Lnk dissociation and Akt/mTOR pathway activation
We performed IP assays to determine the involvement of IGF-1R–Lnk interaction and IGF-1-induced signaling pathways in the adipogenic differentiation of MSCs. Fig. 3A clearly shows IGF-1-induced direct ligand-dependent dissociation of the IGF-1R–Lnk complex in wild-type MSCs. Interestingly, IGF-1-induced dissociation of the IGF-1R–Lnk complex promoted increased phosphorylation of Akt and mTOR in wild-type MSCs. Importantly, Lnk–/– MSCs showed markedly decreased phosphorylation of Akt and mTOR after IGF-1 stimulation (Fig. 3B and 3C). These results suggested that IGF-1 increased the phosphorylation of Akt and mTOR by promoting the dissociation of the IGF-1R–Lnk complex.
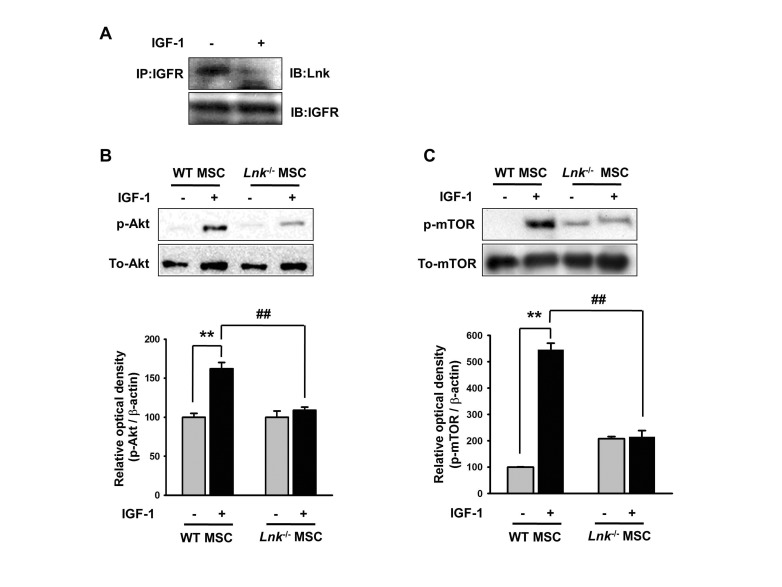 | Fig. 3Insulin-like growth factor-1-mediated dissociation of the insulinlike growth factor-1 receptor–Lnk complex promotes the phosphorylation of Akt/mTOR.(A) Wild-type MSCs were treated with insulin-like growth factor-1 (IGF-1) for 10 min. Coimmunoprecipitation was performed using antibodies against IGF-1 receptor (IGF-1R) and Lnk. (B and C) Wild-type MSCs were treated with IGF-1 for 10 min, and formation of phosphorylated Akt or mTOR was detected by performing western blotting. The lower panels denote the mean±SEM for each condition, as determined from densitometry relative to β-actin; **p<0.01 vs. wild-type MSCs not treated with IGF-1, ##p<0.01 vs. Lnk–/– MSCs treated with IGF-1.
|
Involvement of the Akt/mTOR/PPAR-γ pathway in IGF-1-induced adipogenic differentiation
IGF-1-induced increase in the adipogenic differentiation of wild-type and Lnk–/– MSCs was significantly decreased after treatment with an Akt inhibitor and rapamycin, a specific mTOR inhibitor (Fig. 4A and 4B). Analysis of the expression levels of pivotal transcription factors and their target adipogenic genes after 10 days of adipogenic differentiation showed that PPAR-γ expression was dramatically decreased in Lnk–/– MSCs compared with that in wild-type MSCs (Fig. 5A). Moreover, Lnk–/– MSCs showed lower expression levels of PPAR-γ target genes LPL and FABP4 (Fig. 5B and 5C). In addition, overexpression of Akt in Lnk–/– MSCs recovered adipogenesis and PPAR-γ expression (Fig. 6A and 6B). These results suggested that IGF-1 increased adipogenic differentiation through the Akt/mTOR/PPAR-γ pathway.
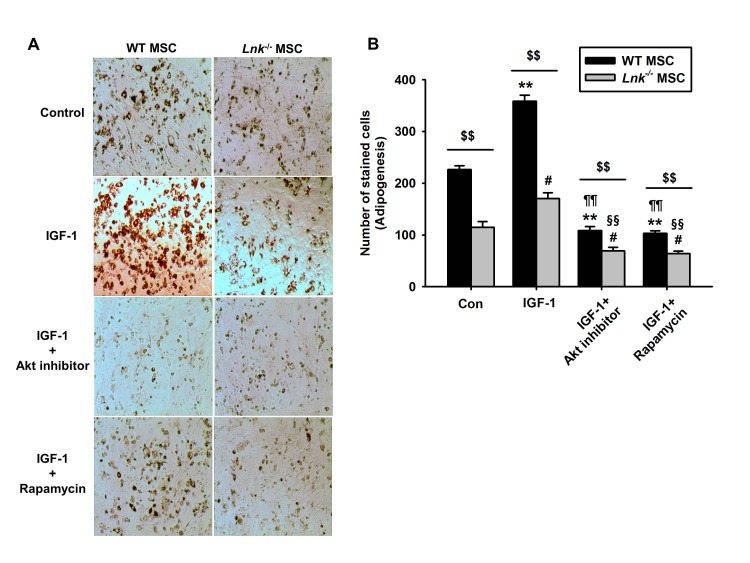 | Fig. 4Involvement of Akt and mTOR signaling in IGF-1-induced differentiation of MSCs.(A) Wild-type (WT) or Lnk–/– MSCs were treated with Akt inhibitor (10 nM) and rapamycin (1 nM). Adipocyte differentiation was induced by incubating the cells in an IGF-1-containing differentiation medium for 14 days and was assessed by staining with oil red O. (B) Adipocyte differentiation was quantified as the number of oil red O stained cells. Values represent the mean±standard error of mean (SEM); **p<0.01 vs. control WT MSC, #p<0.05 and ##p<0.01 vs. control Lnk–/– MSC, ¶¶p<0.01 vs. IGF-treated WT MSC, §§p<0.01 vs. IGF-treated Lnk–/– MSC, $$p<0.01 vs. Lnk–/– MSC treated with PBS (Control), IGF-1 (IGF-1), IGF pretreated with Akt inhibitor (IGF-1+Akt inhibitor), or IGF pretreated Rapamycin (IGF-1+Rapamycin), respectively.
|
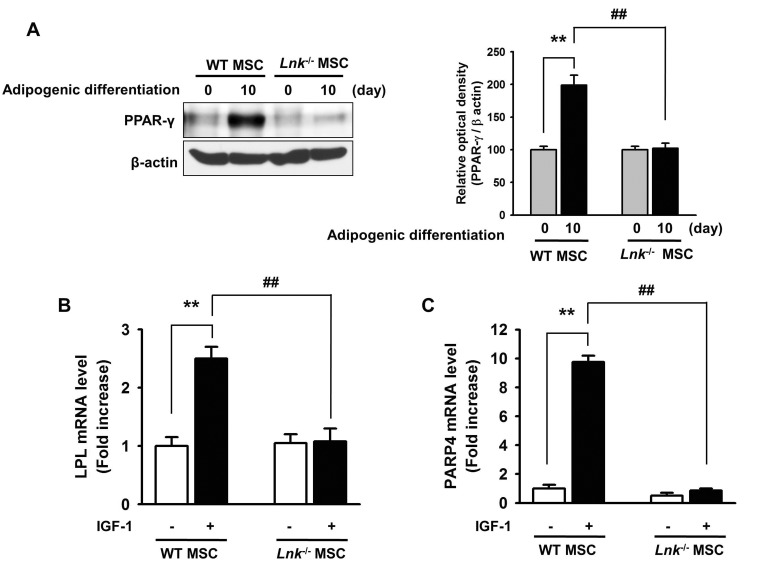 | Fig. 5Expression of PPAR-γ, LPL, and FABP4 during adipogenic differentiation.(A) Adipogenic differentiation of wild-type or Lnk–/– MSCs was induced by incubating the cells in an adipogenic differentiation medium for 10 days. PPAR-γ level was determined by performing western blotting. Bar graph denotes mean±SEM, as determined from densitometry relative to β-actin; **p<0.01 vs. wild-type MSCs (0 day), ##p<0.01 vs. Lnk–/– MSCs (10 day). (B and C) Wild-type or Lnk–/– MSCs were treated with or without 2 ng/ml IGF-1 for 4 days. LPL and FABP4 mRNA expression was quantified by performing quantitative RT-PCR. Values are expressed as mean±SEM; **p<0.01 vs. wild-type MSCs not treated with IGF-1, ##p<0.01 vs. Lnk–/– MSCs treated with IGF-1.
|
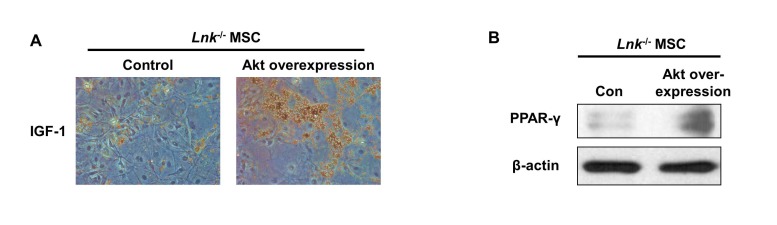 | Fig. 6Adipogenesis and PPAR-γ expression in Lnk–/– MSCs after overexpression of Akt.Akt overexpression in Lnk–/– MSCs were performed by retrovirus-mediated expression of Akt. (A) Adipocyte differentiation was induced by incubating normal or Akt overexpressed Lnk–/– MSCs in an IGF-1-containing differentiation medium for 14 days and was assessed by staining with oil red O. (B) Adipogenic differentiation of normal or Akt overexpressed Lnk–/– MSCs was induced by incubating the cells in an adipogenic differentiation medium for 10 days. PPAR-γ level was determined by performing western blotting.
|
Go to :
DISCUSSION
Interaction of cytokines with their receptors regulates the development and function of cells through specific signaling pathways. Signal-transducing adaptor proteins function as accessory proteins in various cellular processes, including cell survival, proliferation, and differentiation. These proteins have several binding sites through which they associate with their binding partners and trigger or repress various signaling pathways. Lnk adaptor protein (also called SH2B3) belongs to the SH2B family and functions as an important activator and/or inhibitor in hematopoietic, immune, and vascular systems [1016]. Lnk is involved in multiple signaling pathways such as SCF/SCF receptor (c-kit), thrombopoietin/thrombopoietin receptor, erythropoietin (EPO)/EPO receptor, platelet-derived growth factor (PDGF)/PDGF receptor, tumor necrosis, and integrin-associated signaling pathways. Lnk affects several effector targets, including phosphatidylinositol 3-kinase/Akt, p38 mitogen-activated protein kinase, extracellular signal-regulated kinase 1/2, Janus kinase, and signal transducers and activators of transcription [10]. In Drosophila, Lnk promotes the interaction between insulin receptor and Chico, a homologue of insulin receptor substrates. Other members of the SH2B family, such as APS and SH2-B, modulate IGF signaling by autophosphorylating and phosphorylating IGF-1R [1417]. Although many studies have investigated the Lnk adaptor protein, the effect of Lnk on the adipogenic differentiation of MSCs has not been clearly understood.
In this study, we used adipogenic differentiation of MSCs as a model to investigate whether IGF-1-induced dissociation of the IGF-1R–Lnk complex regulated the IGF-1/mTOR/PPAR-γ axis during adipogenesis. Our results support the hypothesis that Lnk functions as an intercellular adaptor protein for transducing insulin/IGF-1 and Akt/mTOR signals to induce adipogenic differentiation. We first observed that the mRNA expression of Lnk was significantly increased during adipogenic differentiation, suggesting a critical role of Lnk in adipogenesis. Interestingly, wild-type MSCs showed significantly higher adipogenic differentiation potential than Lnk–/– MSCs; however, no significant differences were observed between the 2 cell types with respect to their chondrogenic and osteogenic differentiation potentials. These results suggested that Lnk served as a positive regulator of adipogenesis in MSCs.
IGF-1 stimulates adipogenesis [18], and its ligands induce Akt/mTOR activation in MSCs [5]. Moreover, Akt/mTOR is essential for the differentiation of MSCs [19]. However, molecular mechanisms underlying signal transduction in these pathways are unclear. Therefore, we examined the potential role of Lnk in the conversion of IGF-1R tyrosine kinase signals into serine/threonine kinase signals through the Akt/PKB signaling pathway and found that Lnk interacted with IGF-1R. Results of co-IP experiments of Lnk and IGF-1R, which decreased upon interaction within IGF-1, strongly suggested that Lnk positively modulated IGF-1R-dependent signaling. The kinetics of IGF-1-induced mTOR phosphorylation are the same as those of Akt activation in wild-type and Lnk–/– MSCs. However, wild-types MSCs showed higher phosphorylation of Akt and mTOR than Lnk–/– MSCs. These findings indicate that IGF-1 stimulation decreases the levels of the IGF-1R–Lnk complex and induces a switch of IGF-1 receptor coupling away from the Akt/mTOR pathway.
PPAR-γ plays a crucial role in adipogenesis. Our data are consistent with previous observations that the Akt/mTOR pathway enhances the transcription and biological functions of PPAR-γ, thereby inducing it to promote adipogenesis [2021]. The results of the present study showed that PPAR-γ expression was dramatically decreased in Lnk–/– MSCs. In addition, expression of PPAR-γ target genes LPL and FABP4 was decreased in Lnk–/– MSCs. These findings indicate that Lnk facilitates the adipogenic differentiation of MSCs by increasing the expression levels of PPAR-γ and its target genes and by activating the IGF/Akt/mTOR axis.
Lnk has been mainly considered as a negative regulator of growth factor and cytokine-receptor signaling, such as SCF/Kit, TPO/Mpl, and EPO signaling pathway, resulting in the increase in cytokine-induced proliferation and migration [1016]. In addition, Lnk-deficient mice showed the increase in endothelial progenitor cell populations [22]. Conversely, Lnk-deficient mice showed the increase in B cell number, resulting in enlargement of lymph node and spleen [11]. Moreover, kidney of Lnk-deficient mice indicated higher levels of inflammation, oxidative stress, and glomerular injury than wild type mice [23]. These findings suggest that Lnk play a dual positive/negative role depending on tissues and cell types. This study revealed that Lnk regulates adipogenic differentiation of MSCs. However, phenotype change by decreasing adipogenesis is still unclear and further study for physiological and pathophysiological alteration by Lnk-mediated adipogenesis is needed. In conclusion, we showed that dissociation of the IGF-1R–Lnk complex upon IGF-1 stimulation activated the Akt/mTOR pathway, thereby inducing the adipogenic differentiation of MSCs by activating PPAR-γ-mediated adipogenic pathways. These findings provide important insights on regulatory mechanisms underlying the differentiation of various cell types in vitro and ex vivo, specifically during adipose tissue formation. Further investigation of this signaling axis may provide information on pathophysiological mechanisms underlying adipose tissue-associated disorders, including diabetes, obesity, and cancer.
Go to :
 XML Download