

 PDF
PDF ePub
ePub Citation
 Print
Print


INTRODUCTION
As a part of innate immunity, neutrophils play a vital role in host defense, inflammation and tissue injury [1]. Intracellular free-calcium concentration ([Ca2+]i) is an important intracellular signal that is accountable for a number of physiological processes [23]. In neutrophils, alterations in the [Ca2+]i have been considered as the main signaling event occurring on cell activation, resulting in NADPH oxidase activation, degranulation and a priming response to a variety of proinflammatory molecules [45].
In our preliminary experiment, we observed that human plasma (1%) induces [Ca2+]i increase in neutrophils. Because plasma obtained with 300 kDa cutoff filter still can effectively induces [Ca2+]i increase, while the activity of the one obtained with 100 kDa cutoff filter became much less, we presumed that plasma proteins with the molecular weight in the range between 100 and 300 kDa are responsible for this effect. As phosphodiesterase (PDE) is present in plasma and molecular weight of PDE is in the respective range, we just tried to examine the direct effect of PDE on [Ca2+]i in neutrophils, and observed a human neutrophil [Ca2+]i increasing activity of crude PDE 1 from Sigma (cat. no. P4506). However, this activity was not observed when neutrophils are exposed to another commercially available pure PDE I from Worthington Biochemical.
As PDE 1 from Sigma (cat. no. P4506) is actually dried crude venom of Crotalus atrox (C. atrox), we formulated this study to find out the causative molecule(s) present as a contaminant(s) in 'crude' PDE 1 from Sigma, which induces [Ca2+]i increase in human neutrophils. We identified Lys49-phospholipaseA2 (Lys49-PLA2 or K49-PLA2), a catalytically inactive protein that belongs to the phospholipase A2 family, by activity-driven three HPLC (reverse phase, size exclusion, reverse phase) steps followed by SDS-PAGE and LC-MS/MS.
Go to : 
METHODS
Materials
'Crude' phosphodiesterase 1, and SKF-96365 were obtained from Sigma-Aldrich Chemical (St Louis, MO, USA). Pure phosphodiesterase I was purchased from Worthington Biochemical Corporation (Lakewood, NJ, USA). Fluo-3 AM (acetoxymethyl ester) was from Invitrogen (Grand Island, NY, USA), 2-aminoetoxydiphenyl borate (2-APB)was from Calbiochem (San Diego, CA, USA), and protease inhibitor cocktail was from Roche Applied Science. Solvents and all other buffers and reagents used in this study were of analytical grade.
Isolation of K49-PLA2
Activity-driven isolation of K49-PLA2 was done using three steps of chromatography.
I: Semi-preparative reverse phase HPLC: Crude venom 100 mg was dissolved in 3 ml of 0.1% trifluoroaceticacid (TFA) and 5% acetonitrile (ACN) containing 1 mM protease inhibitor and 1 mM EDTA, followed by sonication for 5 minutes then centrifuged (13,000 rpm for 10 minutes) for removing insoluble materials. Supernatant was collected after centrifugation and separated on C-18 (20×150 mm) separation column eluted at 5 ml/min with a linear gradient of 0.1% TFA in water (solution A) and 0.1% TFA in 80% ACN (solution B) as described previously [6]. Protein was detected at 280 nm. Fractions were collected at 1-min interval followed by removing the organic solvent for 40 min in a speed vac (Genevac) evaporator system. 20 µl from each fraction was collected to determine the [Ca2+]i increasing activity in neutrophils. Fractionated samples were stored in –90℃ refrigerator.
II: Size exclusion: [Ca2+]i increasing fractions were lyophilized and combined from 10 separate reverse phase HPLC run. 5 mg of active fraction was dissolved in 200 µl and injected into a Waters Protein-Pak™60Å (7.8×300 mm) column in a fast protein liquid chromatography (FPLC) system (ETTAN LC) at a flow rate of 0.3 ml/minute for 70 min. Active fraction was separated using 0.02 M sodium phosphatebuffer (pH 6.2) on FPLC. The fractions were assayed for [Ca2+]i increasing activity in neutrophils.
III: Reverse phase: 5 mg of active fraction from size exclusion HPLC was separated by Agilent Prep-C18 scalar 5 µm (4.6×250 mm) column by using 0.1% TFA (solution A) and 0.1% TFA in 80% ACN (solution B) gradient for 60 min at 280 nm. Fractions were collected and assayed for [Ca2+]i increasing activity in neutrophils.
SDS-PAGE and in-gel protein digestion
Active fraction number 2 from reverse phase HPLC was run on a 14% SDS-PAGE gel under reduced condition. The gel was stained with Coomassie Brilliant Blue G-250 solution. Protein bands of interest were excised and digested in-gel with sequencing grade, modified trypsin (Promega, Madison, WI) as previously described [7]. In brief, each protein spot was excised from the gel, placed in a micro tube and washed 4~5 times (until the gel was clear) with 150 µl of 1:1 ACN/25 mM ammonium bicarbonate (ABC), pH 7.8 solution. The gel slices were dehydrated with 100% ACN and dried in a centrifugal vacuum concentrator. After reduction (incubation at 56℃ for 45 min with 10 mM DTT in 100 mM ABC) and alkylation (incubation at room temperature for 30 min at dark place with 55 mM iodoacetamide in 100 mM ABC), the gel slices were dried by 100% ACN and the centrifugal vacuum concentrator. And then rehydrated in 30 µl of 25 mM ABC containing 20 ng of trypsin. After incubation at 37℃ for 20 h, the liquid was transferred to a new micro tube. Tryptic peptides remaining in the gel matrix were extracted for 40 min at 30℃ with 20 µl of 50% (v/v) aqueous ACN containing 0.1% (v/v) formic acid. The combined supernatants were evaporated in the centrifugal vacuum concentrator and dissolved in 8 µl of 5 % (v/v) aqueous ACN solution containing 0.1% (v/v) formic acid for mass spectrometric analysis.
Identification of proteins by LC-MS/MS
The resulting tryptic peptides were separated and analyzed using reversed phase capillary HPLC directly coupled to a Finnigan LCQ ion-trap mass spectrometer (LC-MS/MS). Both of a 0.1×20 mm trapping and a 0.075×130 mm resolving column were packed with Vydac 218MS low trifluoroactic acid C18 beads (5 µm in size, 300Å in pore size; Vydac, Hesperia, CA, USA) and placed in-line. Following the peptides were bound to the trapping column for 10 min at with 5% (v/v) aqueous acetonitrile containing 0.1% (v/v) formic acid, the bound peptides were eluted with a 50 min gradient of 5~80% (v/v) ACN containing 0.1% (v/v) formic acid at a flow rate of 0.2 µl/min. For tandem mass spectrometry, a full mass scan range mode was m/z=450~2000 Da. After determination of the charge states of an ion on zoom scans, product ion spectra were acquired in MS/MS mode with relative collision energy of 55%. The individual spectra from MS/MS were processed using the TurboSEQUEST software (Thermo Quest, San Jose, CA, USA). The generated peak list files were used to query either MSDB database or NCBI using the MASCOT program (http://www.matrixscience.com). Modifications of methionine and cysteine (Carbamidomethyl, Deamidated, Oxidation), peptide mass tolerance at 2 Da, MS/MS ion mass tolerance at 1 Da, allowance of missed cleavage at 1, and charge states (+1, +2, and +3) were taken into account. Only significant hits as defined by MASCOT probability analysis were considered initially.
Preparation of human peripheral neutrophils
Neutrophils were purified from venous blood of healthy volunteer. In brief, venous blood was collected with peripheral venous puncture and immediately anti-coagulated with sodium heparin (10 U/ml). Then, neutrophils were isolated by density gradient centrifugation in Histopaque-1077, followed by dextran sedimentation. Residual erythrocytes were eliminated with hypotonic lysis. The purity of neutrophils counted by Diff-Quik staining was >95%. Eosinophils were found to be <5%. The viability of neutrophils stained with tryphan blue was >99%.
Lactate dehydrogenase (LDH) activity assay
Cytotoxicity was evaluated by the detection of LDH activity with cytotoxicity detection kit (Takara) according to the manufacturer's protocol as follows. Briefly, neutrophils were incubated with different concentrations of K49-PLA2 dissolved in HEPES physiologic salt solution (HEPES-PSS) (in mM) (NaCl 140, KCl 5, MgCl2 1, CaCl2 1, Glucose 10, HEPES 10) for 1 h. After centrifugation at 1,500 rpm, supernatant was collected from each sample. 50 µl of each sample was added to a 96-well plate. Then 50 µl of LDH reagent was added to each well and plate was incubated for 30 min at room temperature in dark, and then enzymatic reaction was stopped by adding 50 µl of the stop solution. Absorbance was read at 490 nm with fluorescence microplate reader (SPECTRAmax M2/e, Molecular Devices). Medium alone and medium from cells incubated with 0.1% (v/v) of Triton X-100 were used as reference controls for 0% and 100% cytolysis, respectively.
[Ca2+]i measurement
[Ca2+]i was measured using the fluorescent Ca2+ indicator Fluo-3 AM. Neutrophils were loaded with Fluo-3 AM (4 µM) in HEPES-PSS buffer for 1 h at 37℃. After washing with HEPES-PSS, Fluo-3 AM-loaded neutrophils were re-suspended in HEPES-PSS and plated on 96-well plates at a cell density of 3×10⁶ cells/ml, and then incubated at 37℃ for 10 min for cell stabilization. Different concentrations of crudePDE I or K49-PLA2 were applied following five minute-preread. Traces of [Ca2+]i in Fluo-3 AM-loaded neutrophils were measured with 490 nm/526 nm using fluorescence microplate reader (Spectramax M2/e, Molecular Devices). Fluorescent emission readings were recorded every 10 s. Raw fluorescence was subtracted with average fluorescence during 5 min before the addition of stimulus.
Statistical analysis
All the statistical data were analyzed with Graphpad Prism 5.0. All data were evaluated either by two-tailed Student's t-test or ANOVA and post hoc Bonferroni test. All data were presented as mean±SEM. p<0.05 was considered to indicate statistical significance.
Go to :
RESULTS
Effect of 'crude' PDE 1 and pure PDE I on [Ca2+]i increase in human neutrophils
We observed that PDE 1from Sigma (cat. no. P4506), which is actually crude dried venom of C. atrox (western diamondback rattlesnake), induces [Ca2+]i increase in human neutrophils in a concentration-dependent manner (Figs. 1A and B). High concentration (300 and 500 µU)-induced [Ca2+]i increase seems to have two phases (acute and sustained). It is to be noted that, although not so evident in Figs. 1A and 4A, just an addition of vehicle sometimes induced a slight transient [Ca2+]i increase (Figs. 1C, 4C, 6A, and 6C).
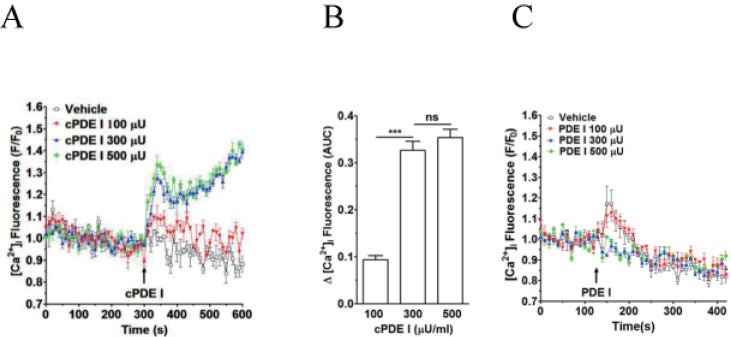 | Fig. 1Effect of crude PDE I (Sigma) and pure PDE I on [Ca2+]i increase in neutrophilsFluo-3 AM-loaded neutrophils were re-suspended in HEPES-PS buffer and plated on 96-well plates at a cell density of 3×10⁶ cells/ml, and then incubated at 37℃ for 10 minutes for cell stabilization. (A) CrudePDE I (100, 300 and 500 µU) was added at 300 s. (B) [Ca2+]i was shown as area under curve (AUC), which was calculated for 300 s (300~600 s). (C) Pure PDE I (100, 300 and 500 µU) was added at 300 s. Changes in [Ca2+]i were expressed as the relative fluorescence intensity of Fluo-3 AM over baseline fluorescence intensity (F/F0). Data points represent the mean±SEM of more than three independent experiments. ***p<0.001.
|
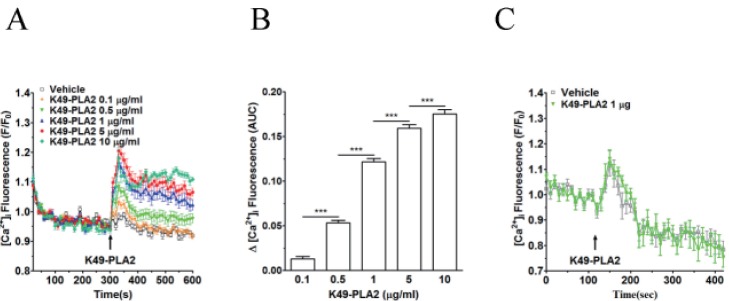 | Fig. 4Effect of K49-PLA2 on [Ca2+]i in neutrophils.(A) Fluo-3 AM-loaded neutrophils (3×10⁶ cells/ml) were suspended in HEPES buffer. K49-PLA2 (0.1, 0.5, 1, 5 and 10 µg/ml) were added at 300 s. (B) [Ca2+]i was shown as area under curve (AUC), which was calculated for 300 s (300~600 s). (C) Fluo-3 AM-loaded neutrophils (3×10⁶ cells/ml) were suspended in calcium-free HEPES buffer. K49P-LA2 (1 µg/ml) was added at 120 s. Changes in [Ca2+]i were expressed as the relative fluorescence intensity of Fluo-3 AM over baseline fluorescence intensity (F/F0). Data points represent the mean±SEM of more than three independent experiments. ***p<0.001.
|
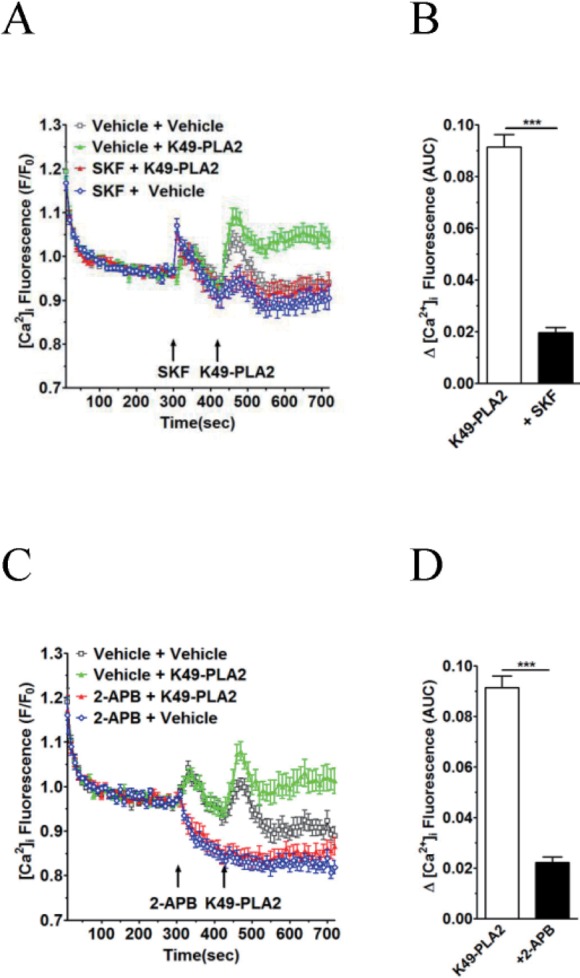 | Fig. 6K49-PLA2-induced [Ca2+]i increase is inhibited by TRP channel inhibitors 2-APB and SKF-96365 in neutrophils.(A and C) Fluo-3 AM-loaded neutrophils (3×10⁶ cells/ml) were suspended in HEPES. 2-APB (30 µM) and SKF-96365 (20 µM) were added for 2 min before the addition of K49-PLA2. (B and D) [Ca2+]i was shown as area under curve (AUC), which was calculated for 300 s (420~720 s). Changes in [Ca2+]i were expressed as the relative fluorescence intensity of Fluo-3 AM over baseline fluorescence intensity (F/F0). Data points represent the mean±SEM of more than three independent experiments. ***p<0.001.
|
As snake venom is a rich source of natural biomolecules such as peptides and proteins with specific biological activities [689], a question arose, whether this increase in [Ca2+]i in human neutrophils is due to PDE I or not. To address this question, weobtained pure PDE I from Worthington Biochemical, of which the source is also snake venom (C. adamanteus). We investigated whether this pure PDE I could induce [Ca2+]i increase in human neutrophils. Interestingly, pure PDE I was without effect at 1 to 500 µU/ml (Fig. 1C), indicating that the [Ca2+]i increasing factor(s) as a contaminant(s) in 'crude' PDE I from Sigma is responsible for this robust and sustained [Ca2+]i increase in human neutrophils.
Purification of causative factor(s)
As snake venom is rich in peptides and proteins [68910], we hypothesized that [Ca2+]i increasing substance(s) in crude PDE I from Sigma might be proteins or peptides. For activity-driven isolation of [Ca2+]i increasing substance(s), we used commercially available 'crude' PDE I (Sigma), and fractioned it in three HPLC steps. In the first semi-preparative reverse phase HPLC, 'crude' PDE I from sigma was fractionated on C-18 (20×150 mm) column to produce 24 fractions (Fig. 2A). All of these fractions were collected and assayed for [Ca2+]i increasing activity in human neutrophils. Among these 24 fractions, fractions 10~13 underlined by red line (Fig. 2A) induced [Ca2+]i increase in neutrophils (data not shown). The fraction 10 from semipreparative reverse phase was further separated by size exclusion HPLC using a Waters Protein-PakTM 60Å (7.8×300 mm) column to yield five fractions. Fraction 5 from this separation step (Fig. 2B) increased [Ca2+]i in neutrophils (data not shown), and was further fractionated by reverse-phase chromatography using an Agilent Prep-C18 scalar 5 µm (4.6×250 mm) column to four fractions (Fig. 2C). Among the four fractions tested for [Ca2+]i increasing activity, fraction 2 increased [Ca2+]i in neutrophils (data not shown).
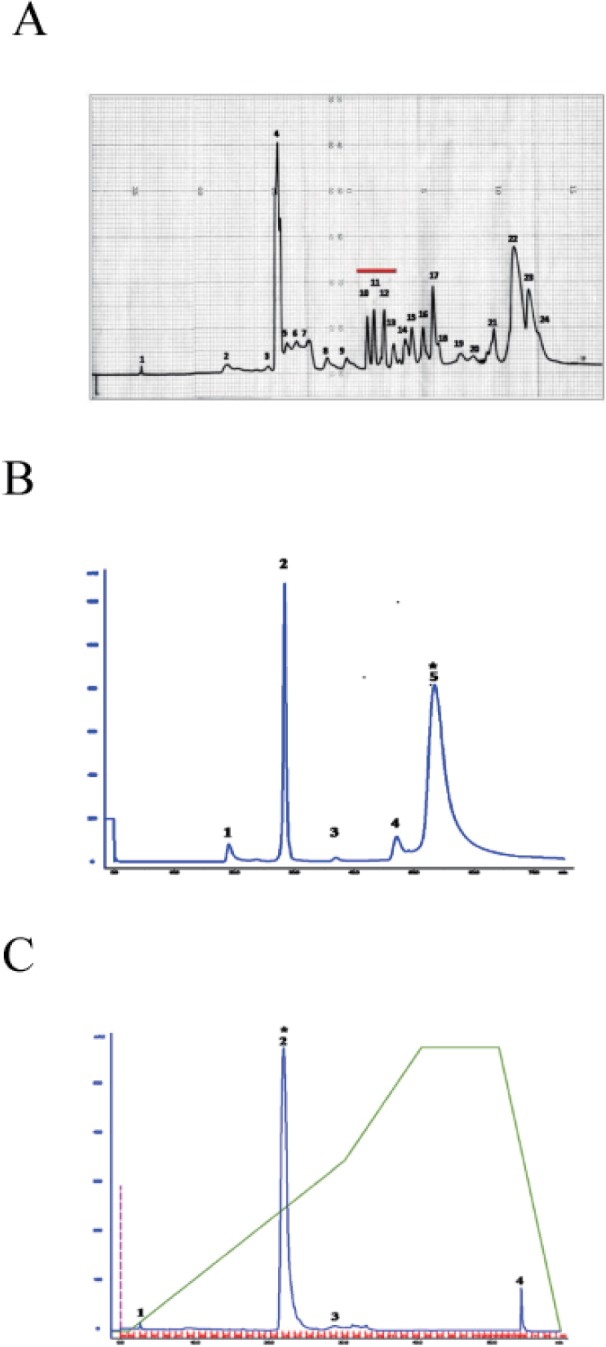 | Fig. 2Isolation of K49-PLA2 from crude PDE I (C. atrox venom) by HPLC.Activity-driven isolation of K49-PLA2 from crudePDE I (C. atrox venom)was done using a three-step chromatography procedure as described in Materials and Methods. (A) Semi-preparative reverse phase C-18 (20×150 mm) column recycling preparative HPLC. (B) Size exclusion HPLC of fraction 10 from semi-preparative reverse phase HPLC. (C) Reverse phase chromatography of the fraction 5 from size exclusion HPLC.
|
Size determination and identification of fraction 2
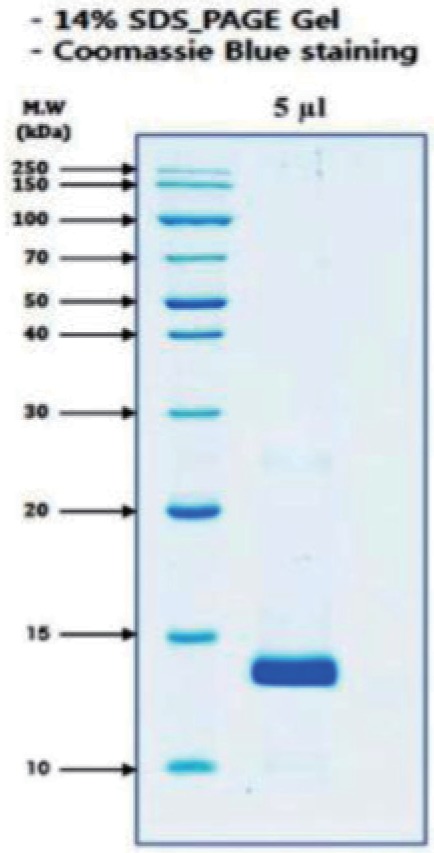
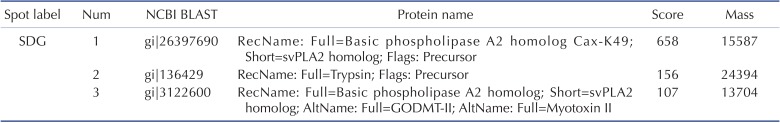
Fraction 2 from reverse phase HPLC was run on a 14% SDS-PAGE gel under reduced condition. The gel was stained with Coomassie Brilliant Blue. Gel electrophoresis (SDS-PAGE) yielded one major band of size ~13 kd (Fig. 3). This band was detected as basic phospholipase A2 homolog alternative name myotoxin II as well as K49-PLA2 by NCBI BLAST search (Table 1).
K49-PLA2 increases concentration-dependently [Ca2+]i in neutrophils via extracellular calcium influx
After isolation of K49-PLA2, we determined the concentration-dependency of K49-PLA2 on [Ca2+]i increase in neutrophils. K49-PLA2 (0.5 to 10 µg/ml) induced an increase in [Ca2+]i concentration-dependently in neutrophils (Figs. 4A and B); at high concentrations (5 and 10 µg/ml), K49-PLA2-induced [Ca2+]i increase was composed of two phases, i.e., an early transient increase in [Ca2+]i followed by a long-lasting persistent [Ca2+]i increase (Figs. 4A and B).
For the subsequent experiments, we selected 1 µg/ml concentration of K49-PLA2. Next, we investigated whether K49-PLA2-induced [Ca2+]i increase in neutrophils is from stored calcium mobilization or from extracellular calcium influx. In Ca2+-free HEPES buffer supplemented with EGTA, K49-PLA2 was of no effect when compared with vehicle, indicating that K49-PLA2-mediated increase in [Ca2+]i in human neutrophils occurs via extracellular calciuminflux (Fig. 4C). It is to be noted that vehicle (distilled water)-induced early transient [Ca2+]i increase is still observed in Ca2+-free medium condition, suggesting that this could be due to Ca2+ release from the internal store. Application of vehicle might physically perturb the cells and stimulate Ca2+ release from the internal store.
K49-PLA2 increases [Ca2+]i in human neutrophils without causing membrane disruption
A previous study showed that myotoxin II, a K49-PLA2, from Bothrops asper (B. asper) at a high concentration (100 µg/ml) induces a prominent [Ca2+]i increase associated with drastic disruption of the plasma membrane in a lymphoblastoid cell line [11]. We asked whether K49-PLA2-induced Ca2+ influx in human neutrophils was due to cell membrane disruption or not. To address this question we performed LDH measurement by using different concentrations of K49-PLA2 (0.1 to 10 µg/ml). None of these concentrations of K49-PLA2 was cytotoxic for neutrophils (Fig. 5). This result suggests that K49-PLA2–induced robust and sustained [Ca2+]i increase in neutrophils was not associated with membrane disruption.
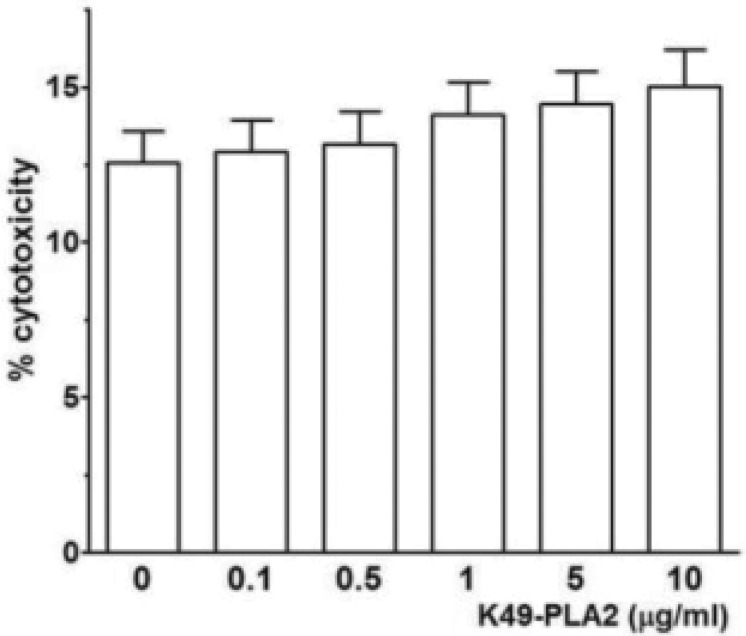 | Fig. 5K49-PLA2 had no cytotoxic effect on neutrophils.LDH was measured according to LDH measuring kit (Takara) protocol after 1 h-incubation of neutrophils with K49-PLA2 (1 µg/ml). Absorbance was read at 490 nm with fluorescence micro plate reader (SPECTRAmax M2e, Molecular Devices). Medium alone and medium from cells incubated with 0.1% (v/v) of Triton X-100, were used as reference controls for 0% and 100% cytolysis, respectively.
|
K49-PLA2-induced [Ca2+]i increase in neutrophils is inhibited by 2-APB and SKF-96365
SKF-96365 (20 µM) and 2-APB (30 µM) markedly inhibited the K49-PLA2-induced [Ca2+]i increasein neutrophils (Figs. 6A-D). In contrast to SKF-963652, APB (30 µM) alone decreased basal [Ca2+]i level (Fig. 6B). Furthermore, the vehicle-induced, early transient [Ca2+]i increase was abolished in the presence of 2-APB (30 µM).
Go to :
DISCUSSION
In the present study, we isolated and identified Lys49-phospholipase A(2) (K49-PLA2, MT II myotoxin) as a human neutrophil-calcium modulating protein, from crude venom of western diamond rattlesnake (C. atrox), which is commercially available as 'crude' PDE 1 from Sigma (cat. no. P4506). This study suggest that, when using PDE 1 (cat. no. P4506) from Sigma, investigators need to consider the possibility that their result could be due to the contaminating K49-PLA2 in their 'crude' PDE I.
K49-PLA2, referred to as Lys49-PLA2 homologues or Lys-49-myotoxins, a catalytically inactive protein, belongs to the phospholipase A2 family [1213]. In the present study, we isolated K49-PLA2 of size ~13 kd (Fig. 3) from crude venom of C. atroxusing three HPLC steps (Figs. 2A-C). The size was quite similar to the previously reported K49-PLA2sfrom C. atrox (13779 dalton, [14]; and 13572 dalton, [6]). Previous report demonstrated that K49-PLA2 from C. atrox has the ability to cause myonecrosis and edema in experimental animals [14]. However, the effect of K49-PLA2 from C. atrox on [Ca2+]i signaling in human neutrophils has not been characterized yet.
K49-PLA2-induced [Ca2+]i increase in neutrophils was concentration-dependent (0.1 to 10 µg/ml) (Figs. 4A and B). We observed that, K49-PLA2 (1 µg/ml) has no effect on [Ca2+]i increase in neutrophils in calcium-freeHEPES buffer (Fig. 4C), whereas it significantly induced [Ca2+]i increase in neutrophils in calcium-containing HEPES buffer (Figs. 4A and B). These results suggest that K49-PLA2-mediated increase in [Ca2+]i in human neutrophils occurs via extracellular calcium influx (Figs. 4A and B). We also examined the cytotoxic profile of K49-PLA2 on neutrophils, and found that K49-PLA2 has no cytotoxic effect in neutrophils up to 10 µg/ml concentrations (Fig. 5). This result indicates that K49-PLA2-induced [Ca2+]i increase in neutrophils is not due to cell membrane disruption, strongly suggesting that there might be an involvement of calcium channels for robust and sustained influx of Ca2+ in neutrophils. The two-phase [Ca2+]i increase, i.e., an early transient one followed by a long-lasting persistent one (Figs. 4A and B), especially by high concentrations (5 and 10 µg/ml) ofK49-PLA2 strongly suggests the typical Ca2+store release followed by store-operated Ca2+entry (SOCE)via CRAC channel (Orai1/STIM1). However, disappearance of both phases of Ca2+increase in the Ca2+-free condition (Fig. 4C) defies such contention. Thus, K49-PLA2 could activate multiple calcium-permeating channels in human neutrophils. This observation is in contrast with an earlier report that K49-PLA2 from B. asperinduces cytosolic [Ca2+]i increase in macrophages by Ca2+ release from intracellular store [15]. They proposed from their observation that MT-II has an acceptor on the membrane of macrophages, which facilitates cell death, and is responsible for the vast cytotoxic profile of MT-II [15]. Further, another report showed that the mechanism underlying myotoxin-II-induced enhancement of cytosolic [Ca2+]i in lymphoblastoid cell line was by cell membrane disruption [11]. The differences between our observation and their findings might be due to the differences in the type of cells analyzed and the source of K49-PLA2.
In this study, we found that K49-PLA2-induced [Ca2+]i increase in neutrophils is inhibited by two calcium channel inhibitors 2-APB and SKF-96365 (Figs. 6A-D), suggesting that 2-APB- and SKF-96365-sensitive calcium channels are involved in K49-PLA2-induced [Ca2+]i modulation in neutrophils. 2-APB can inhibit inositol 1,4,5-trisphosphate receptors (IP3Rs), CRACchannel, and some types of TRP channels. SKF-96365 is a relatively nonselective cation channel blocker that can inhibit TRPC channels and CRAC channel. Further study is required to identify the specific channels that are responsible for K49-PLA2-induced [Ca2+]i modulation in neutrophils.
Go to :
 XML Download