

 PDF
PDF ePub
ePub Citation
 Print
Print


INTRODUCTION
Diabetes mellitus (DM) is a chronic endocrine and metabolic disease characterized by hyperglycemia. Due to the modern habits and lifestyle, DM prevalence has been increasing rapidly in the past decades, especially the type 2 diabetes mellitus (T2DM). It is expected that T2DM will affect more than 592 million people by 2035 [1]. In clinic, synthetic drugs, mainly including biguanides, sulfonylureas, thiazolidinediones and α-glucosidase inhibitors, have been wildly used in the treatment of T2DM. However, many reports have revealed the adverse effects and drug resistance of synthetic drugs [2]. Meanwhile, several studies have shown the beneficial effects of nature medicine on T2DM [3]. Therefore, searching for active components from natural products may be a direction of new drug development in diabetes.
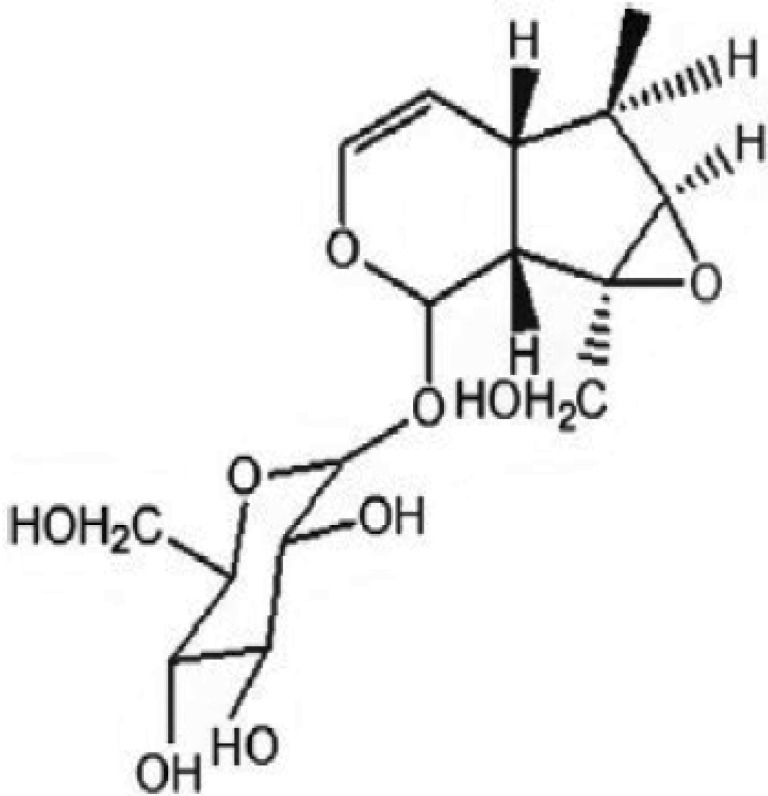
As a traditional Chinese medicine, Rehmanniae glutinosa L has been used in clinical treatment of diabetes in China. Catalpol, an iridoid glycoside isolated from the root of Rehmanniae glutinosa L, and the structure is shown in Fig. 1. It demonstrates a variety of biological activities, such as anti-tumor, anti-aging and neuroprotective activities [456]. It also can serve as an effective agent against diabetes. It had been reported to be an effective compound on lowering plasma glucose in STZ-induced diabetic animal models, and the mechanisms may relate to increasing glucose utilization through enhanced β-endorphin secretion from adrenal gland and improved mitochondrial function in skeletal muscle [78]. The db/db mouse is considered as a spontaneous T2DM animal model with the symptoms of hyperglycemia, hyperinsulinism, hyperlipidemia and glucose metabolic disorder [9]. It is more similar to T2DM clinical symptoms as compared with STZ-induced diabetic animal models. The aim of this study was to investigate the hypoglycemic activity of catalpol and its underlying mechanisms in db/db mice.
Go to : 
METHODS
Animals and drugs
Seven-week-old male db/m and db/db mice (C57BL BKS cg-M+/lepr-/-) were supplied by Shanghai Slca laboratory animal Co., Ltd (Shanghai, China). All the mice were maintained in the Laboratory Animal Center of Nanjing Medical University (Jiangsu, China). The mice were housed in a 12 h dark/light room with temperature at 22~25℃ and humidity at 55~70%. All the mice had free access to water and a standard diet. The animal experiment were approved by the Animal Care and Use Committee of Nanjing Medical University and conformed to the Guide for the Care and Use of Laboratory Animals, published by US National Institute of Health (NIH publication No. 85-23, revised in 1996). Catalpol (purity 98%) was purchased from Nanjing Zelang Medical Technology CO., Ltd (Jiangsu, China). Metformin tablets were purchased from Beijing Xiehe Pharmaceutical Factory (Beijing, China).
Experimental protocol
After the mice were acclimated for one week, the forty male db/db mice were randomly divided into five groups according to fasting blood glucose (FBG): db/db mice plus distilled water (model control group), db/db mice plus catalpol 40 mg/kg body wt, db/db mice plus catalpol 80 mg/kg body wt, db/db mice plus catalpol 160 mg/kg body wt group and db/db mice plus metformin 250 mg/kg body wt group. The db/m mice were selected as normal control group (distilled water). The drugs were suspended in distilled water, and the mice were administrated with corresponding agents or water at the described dose by gavage once a day for 4 weeks. After the three weeks treatment, the mice were fasted overnight and then orally administered with 2.5 g/kg D-(+)-glucose(Sigma-Aldrich, USA) solution [10]. The whole blood was drawn from the tail vein at 0, 30, 60, 90 and 120 min to determine the FBG with ONE TOUCH Ultra glucometer (LifeScan, USA). Blood glucose incremental area under the glucose-time curve (iAUC) was calculated by the trapezoid rule. At the end of the 4th week, the mice were fasted overnight. After the FBG had been monitored, the mice were sacrificed. The blood sample was collected and centrifuged (4℃, 300×g, 15 min) to recover the serum which was stored at -20℃ pending analysis. The hepatic, skeletal muscle and adipose tissues were flash frozen in liquid nitrogen and then stored at -80℃ for further use.
Serum biochemistry
The serum was obtained as described above. Glycated serum protein (GSP) concentration was detected by ultraviolet spectrophotometry with glycated serum protein kit (Nanjing Jiancheng Institute of Bioengineering, Jiangsu, China). Triglyceride (TG) and total cholesterol (TC) in serum were detected with automatic biochemistry analyzer (Hitachi 7020, Japan).
Radioimmunoassay
The concentration of insulin in serum was analyzed with Iodine[125I] insulin kit (Beijing North Institute of Biological Technology, Beijing, China). The concentration was expressed as µIU/ml. Homeostasis model assessment-estimated insulin resistance (HOMA-IR) index was calculated as follows: HOMA-IR=FBG× insulin/405, where FBG was given in mg/dl and insulin is given in µIU/mL [11].
Enzyme-linked immunosorbent assay
The concentration of adiponectin in serum (expressed as ng/mL) was measured with mice enzyme-linked immunosorbent assay kits (MultiSciences Biotech Co., Ltd, Zhejiang, China).
Western Blot determination
Four samples of liver, skeletal muscle and adipose tissues from each group were randomly selected and lysed in lysis buffer (RIPA lysis buffer, Beyotime Institute of Biotechnology, Shanghai, China) for 30 min. Lysates were centrifuged at 12000 rpm at 4℃ for 10 min, and the total proteins were obtained from supernatants. The membrane protein in the remaining samples of skeletal muscle and adipose tissues were extracted with ProteoExtract transmembrane protein extraction kit (Merck Millipore, USA). The protein concentrations were determined using BCA protein assay kit (Beyotime Institute of Biotechnology, Shanghai, China). The total protein products were used to detect the expressions of phosphorylation-AMPKα1/2, AMPKα1/2 and GAPDH in liver, skeletal muscle and adipose tissues, while the membrane protein products were used to detect the expressions of GLUT-4 and Na,K-ATPase in skeletal muscle and adipose tissues. Equal amounts of protein product (80 µg) from each sample were electrophoresed through sodium dodecyl sulfate polyacrylamide gels. Afterwards, the separated protein was transferred to polyvinylidence difluoride (PVDF) membrane, which was blocked with 5% skimmed milk in TBST solution (2.42 g Tris-base, 14.6 g NaCl and 2 mL Tween-20 in 1 L water) for 2 h at room temperature, followed by overnight incubation with primary antibodies against phosphorylation-AMPKα1/2 (1 : 500, Santa Cruz, USA), AMPKα1/2 (1 : 1000, Santa Cruz, USA), GLUT-4 (1 : 2000, Abcam, UK), Na,K-ATPase (1 : 1000, Cell Signaling Technology, USA) or NAPDH (1 : 2000, Santa Cruz, USA) at 4℃. Then the membrane was incubated with horseradish peroxidase-conjugated secondary antibodies (1 : 5000, Beyotime Institute of Biotechnology, Shanghai, China) for 2 h at room temperature. The hybridizing bands were developed using ECL chemiluminescence reagents (Weiao Biotech Co., LTD, Shanghai, China) and exposed in chemiluminescence imaging system. The relative protein level of phosphorylation-AMPKα1/2 was normalized by intensity of total-AMPKα1/2 and the averaged relative protein level in normal control was defined as 1.
Real time-RT PCR determination
Total RNA was extracted from each liver tissue using Trizol reagent (Invitrogen, USA) and reverse transcribed into first-stand cDNA by using a cDNA synthesis kit (Fermentas, Canada). Real time PCR was performed using SYBR Green RT-PCR kit (Toyobo Life Science, Japan). Primer oligonucleotide sequences for ACC and HMGCR are as follows:
ACC mRNA forward primer: 5'-GAATCTCCTGGTGACAATGCTTATT-3'
ACC mRNA reverse primer: 5'-GGTCTTGCTGAGTTGGGTTAGCT-3'
HMGCR mRNA forward primer: 5'-GGGCCCCACATTCACTCTT-3'
HMGCR mRNA reverse primer: 5'-GCCGAAGCAGCACATGATCT-3'
β-actin mRNA forward primer: 5'-TGTCCACCTTCCAGCAGATGT-3'
β-actin mRNA reverse primer: 5'-AGCTCATAACAGTCCGCCTAGA-3'
The cDNA was denatured at 95℃ for 3 min, followed by 40 cycles with 95℃ denaturation for 15s, 60℃ annealing for 15s and 72℃ extension for 30s. The gene expression levels were analyzed by ABI 7500 Real-time PCR system (Applied Biosystems, USA). The relative quantities of ACC and HMGR were calculated by Pfaffl method [12].
Statistical analysis
The results were expressed as means±standard deviation. The data was assessed by SPSS 15.0 software. Statistical analyses of data were performed by one-way analysis of variance (ANOVA). Dunnett's test was applied for individual differences among groups. In all analyses, p<0.05 was considered to be statistically significant.
Go to :
RESULTS
The effect of catalpol on body weight and food intake
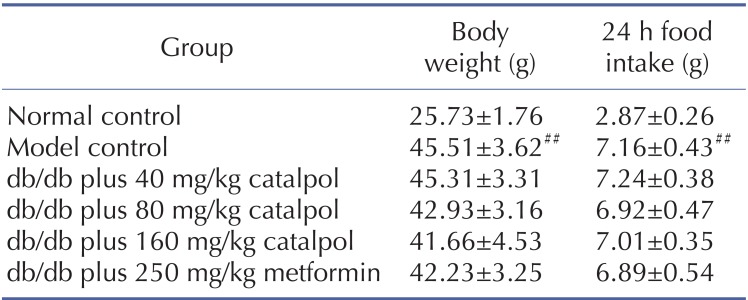
As shown in Table 1, the body weight and 24 h food intake in model control group were significantly increased than those in normal control group. Compared to the model control, Catalpol at 80 and 160 mg/kg as well as metformin slightly lowered the body weight and 24 h food intake than those in model control group. However, there was no statistically significant difference (p>0.05).
The effect of catalpol on serum biochemistry
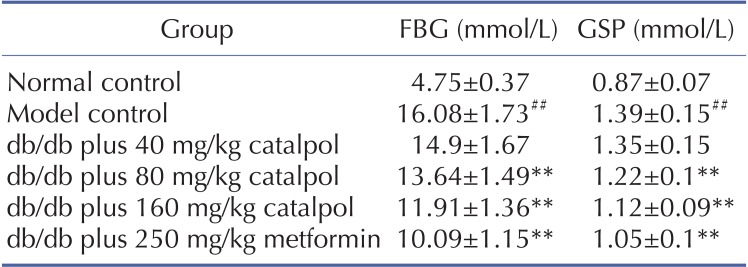
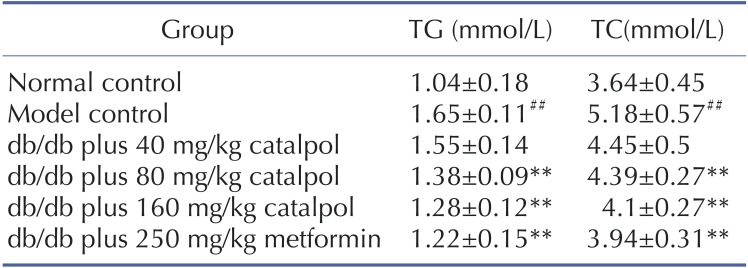
As shown in Table 2 and Table 3, the concentrations of FBG, GSP, TC and TG were significantly higher in the model control group than those in the normal control group (p<0.01). Catalpol (80 and 160 mg/kg) and metformin significantly decreased the FBG, GSP, TC and TG concentrations (p<0.01).
The effect of catalpol on glucose tolerance
Glucose tolerance is an important indicator of the degree of T2DM. In oral glucose tolerance test, the catalpol (80 and 160 mg/kg) and metformin obviously diminished the levels of iAUC in db/db mice (p<0.01), indicating that the catalpol treated mice exhibited a higher glucose tolerance than the untreated db/db mice (Fig. 2).
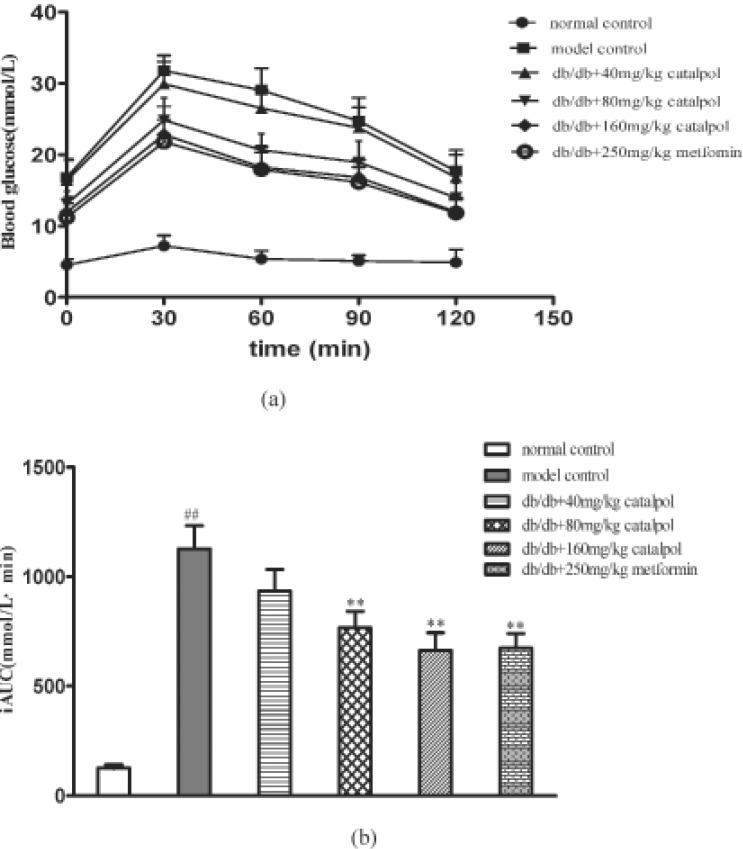 | Fig. 2Effects of catalpol on glucose tolerance in db/db mice.(a) Blood glucose levels during oral glucose tolerance test. (b) The incremental area under the curve (iAUC) for oral glucose tolerance test. Data are presented as means±SD (n=8). Compared with normal control group, ##p<0.01. Compared with model control group, **p<0.01.
|
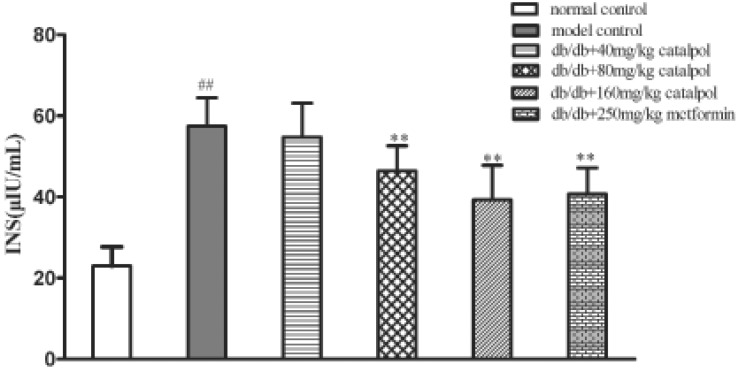
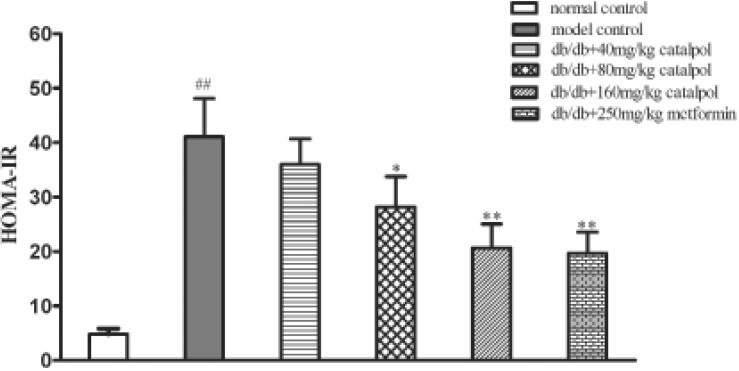
The effect of catalpol on HOMA-IR index
Insulin resistance is a major obstacle in the treatment of obesity diabetes and it often accompanied by hyperinsulinemia. As shown in Fig. 3 and Fig. 4, the serum level of insulin was significantly increased in the model control group (p<0.01). Catalpol at 80 and 160 mg/kg as well as metformin significantly decreased the insulin level when compared to the model control group (p<0.01), and the HOMA-IR was significantly reduced as well (p<0.01 or p<0.05). The results show that catalpol could improve insulin resistance in db/db mice.
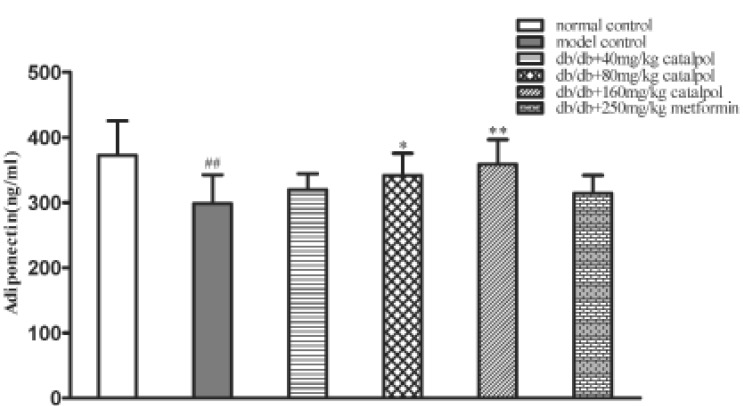
The effect of catalpol on adiponectin
In model control group, the concentrations of adiponectin were significantly lower as compared to normal control group (p<0.01). Treatment with catalpol at 80 and 160 mg/kg significantly increased the adiponectin concentrations. However, metformin had no obvious effect on adiponectin (p<0.01 or p<0.05, Fig. 5).
The effect of catalpol on p-AMPK α1/2 expression
Adenosine Monophosphate Activated Protein Kinase (AMPK) is a master sensor and regulator of cellular energy metabolic homeostasis and expressed in liver, heart, and peripheral tissues. To evaluate whether catalpol lower blood glucose via regulating AMPK signaling pathway, the relative protein levels of p-AMPK α1/2 in liver, skeletal muscle and adipose tissue were determined by western blot analysis. As shown in Fig. 6, the protein expression of p-AMPK α1/2 is significantly reduced in model control group when compared with that in normal control group (p<0.01). Catalpol (80 and 160 mg/kg) and metformin significantly increased protein expression of p-AMPK α1/2 in both liver and peripheral tissue compared with model control group (p<0.01 or p<0.05).
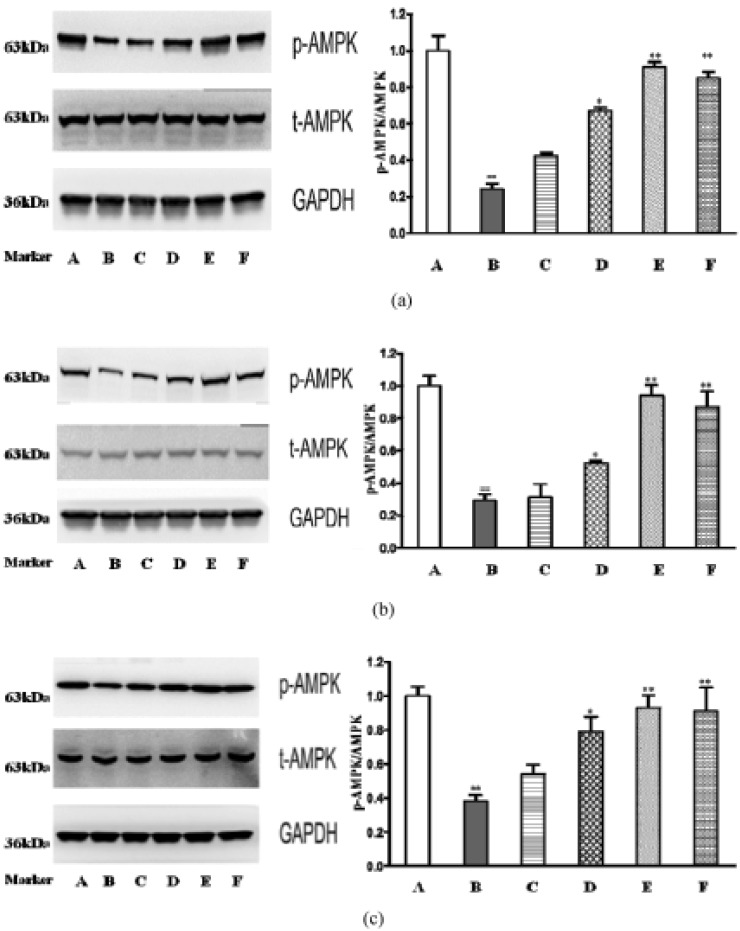 | Fig. 6Effects of catalpol on p-AMPKa1/2 in db/db mice.(a) Expressions of p-AMPKa1/2 in liver. (b) Expressions of p-AMPKa1/2 in adipose tissue. (c) Expressions of p-AMPKa1/2 in skeletal muscle. A: normal control group, B: model control group, C: db/db+40 mg/kg catalpol group, D: db/db+80 mg/kg catalpol group, E: db/db+160 mg/kg catalpol group, F: db/db+250 mg/kg metformin group. Data are presented as means±SD (n=4). Compared with normal control group, ##p<0.01. Compared with model control group, *p<0.05, **p<0.01.
|
The effect of catalpol on GLUT-4 expression
Glucose transporter 4(GLUT-4) plays a critical role in glucose utilization. It is a major glucose transporter in peripheral tissue and augments glucose uptake by facilitating glucose delivery to intracellular from extracellular. In this study, the GLUT-4 protein expressions were obviously lower in model control group than in normal control group (p<0.05). Treatment with catalpol 80 and 160 mg/kg or metformin significantly increased the protein expressions of GLUT-4 in skeletal muscle and adipose tissues (p<0.05, Fig. 7).
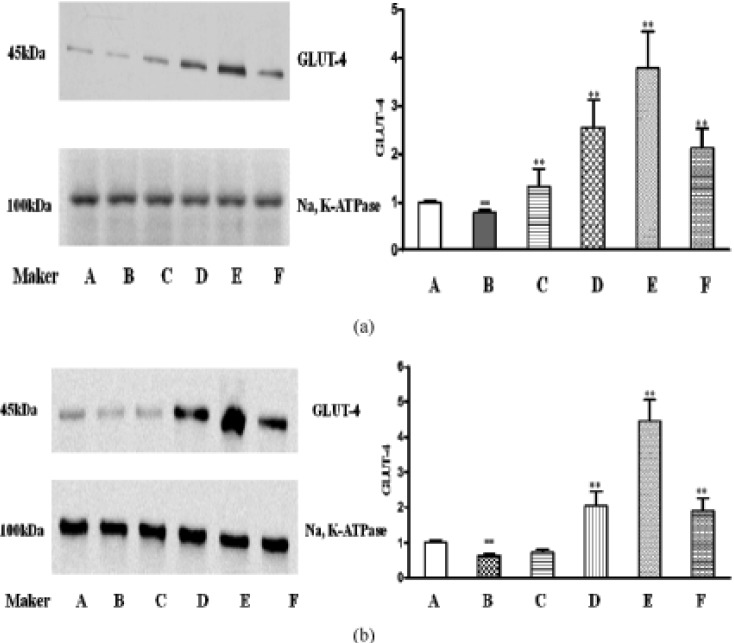 | Fig. 7Effects of catalpol on GLUT-4 in db/db mice.(a) Expressions of GLUT-4 in adipose tissue. (b) Expressions of GLUT-4 in skeletal muscle. A: normal control group, B: model control group, C: db/db+40 mg/kg catalpol group, D: db/db+80 mg/kg catalpol group, E: db/db+160 mg/kg catalpol group, F: db/db+250 mg/kg metformin group. Data are presented as means±SD (n=4). Compared with normal control group, ##p<0.01. Compared with model control group, **p<0.01.
|
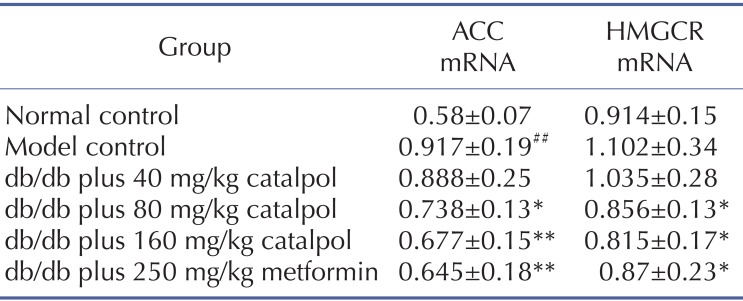
The effect of catalpol on ACC and HMGCR expression
Acetyl-CoA carboxylase (ACC) and Hydroxymethyl glutaric acid acyl CoA reductase (HMGCR) have been implicated in triglyceride and cholesterol synthesis respectively, and the mRNA expressions of ACC are known to increase in steatotic liver of db/db mice [13]. As shown in Table 4, the mRNA expressions of ACC in model control group were significantly higher than that in normal control group (p<0.01). Although there was tendency of increase in HMGCR mRNA expressions in model control group compared with normal control group, no statistically significant difference could been found. Catalpol (80 and 160 mg/kg) and metformin treatment significantly decreased ACC and HMGCR mRNA expressions (p<0.01 or p<0.05).
Go to :
DISCUSSION
T2DM is a complicated metabolic disease due to the relative lack of insulin. In clinic, most of the T2DM patients are associated with obesity [14]. db/db mouse is a congenital obesity diabetic animal model caused by the deficiency of leptin receptor. The pathogenesis of T2DM in db/db mice was similar to those in human. Recent years, db/db mice have been widely used in animal experiments to establish the T2DM model [1516]. It is reported that stable hyperglycemia could be observed since the mice were eight-week-old [17]. Based on the above reports and our preliminary experiments, the seven-week-old mice were adopted in our researches, and the results proved that the db/db mice in model control group demonstrated sustained hyperglycemia during the entire process. This suggests that the diabetic animal model was established successfully.
Catalpol has been proposed as an effective agent in the therapy of diabetic animals which could be induced by a single high dose of STZ injection or a low dose-STZ injection combined with high fat diet [1819]. However, the STZ destroys the insulin secretion by inducing β cell death in pancreas directly, where the pathogenesis is different from T2DM, especially the obesity diabetes [20]. Therefore, in the present study, we adopted db/db mice to investigate the hypoglycemic effect of catalpol in obesity T2DM. In our study, compared with the db/m mice, the db/db mice were diabetic and obese, which is consistent with previous reports. Treatment with catalpol 80 and 160 mg/kg could significantly decrease the levels of fasting blood glucose and glycated serum protein. Meanwhile, catalpol had no effect on food intake. These results revealed that catalpol had anti-diabetic effect in db/db mice which did not result from a lower food intake.
Obesity T2DM typically coexists with impaired glucose tolerance and insulin resistance [21]. In the present study, the oral glucose tolerance and HOMA-IR were determined. The results showed that catalpol significantly improved glucose tolerance at 30, 60, 90, 120 min and lower HOMA-IR index, further confirming that catalpol has positive action in the treatment of obesity diabetes.
Glucose uptake in periphery is extremely important in body glucose homeostasis [22]. AMPK a serine/threonine protein kinase, comprising of catalytic α, regulatory β and γ subunits, has been postulated as an important drug target in diabetes because of its role in regulation of glucose metabolism [23]. Once phosphorylated, the active AMPK could improve glucose utilization by increasing the expression of GLUT4 and stimulating the translocation of GLUT4 from intracellular storage vesicles to cell membrane in skeletal muscle and adipose tissues [2425]. To explore the hyperglycemic mechanism of catalpol, the p-AMPKα1/2 relative protein level in skeletal muscle and adipose tissue were detected. In rodent model of obesity T2DM, a decrease of p-AMPK in peripheral tissue has been observed [26]. The data showed that the expressions of p-AMPKα1/2 were decreased in our experiments, which were consistent with previous reports [27]. In the groups treated with catalpol (80 and 160 mg/kg), the protein expressions of p-AMPKα1/2 and GLUT-4 were significantly increased compared with model control group. The results indicated that AMPK may be a critical drug target of catalpol in glucose utilization.
Lipid metabolism disorder is considered as a risk factor in the progression of obesity diabetes. In clinic, most obesity T2DM patients are normally accompanied by hyperlipemia. Previous studies have clarified the negative effect of Hyperlipemia in glucose homeostasis, such as inhibiting glucose oxidation and delivery to intracellular from extracellular, promoting gluconeogenesis in liver [28]. Therefore, down-regulating the levels of blood lipid may be beneficial to glycemic control. In our study, catalpol significantly reduced the concentrations of TC and TG in db/db mice without dietary restriction. ACC and HMGCR are key enzymes in endogenous lipid biosynthesis. In this study, liver HMGCR mRNA expressions were not significantly increased in model control group relative to normal control group, indicating that high levels of TC in serum may account for exogenous intake. The mRNA expressions of ACC and HMGCR were both decreased in catalpol treated groups (80 and 160 mg/kg). The results suggested that catalpol may improve glucose metabolic disorder by inhibiting endogenous lipid generation. Besides the regulating function in glucose utilization, AMPK plays an important role in the lipid metabolism as well. Many reports have showed that AMPK activation could reduce triglyceride and total cholesterol synthesis by down-regulating the expressions of ACC and HMGCR in liver [29]. The results of serum biochemistry test showed that the concentrations of TC and TG in serum were lower in catalpol treated group (80 and 160 mg/kg) than those in model control group accompanied by the higher protein expression of p-AMPKα1/2 and lower mRNA expressions of ACC and HMGCR in liver. Therefore, catalpol may amend the lipid metabolism via activating AMPK, and it was useful for down regulating blood glucose in diabetes.
Adiponectin is an adipocytokine secreted solely by adipocytes [30]. The physiological functions of adiponectin were stimulated once it was bound to its specific receptors (adipoR1 and adipoR2), which are expressed in liver and peripheral tissue [31]. A number of studies have showed the positive effect of adiponectin against the development of obesity T2DM [32]. It has been proved that adiponectin is regulating glucose and lipid metabolism by activating its downstream factor AMPK [33]. In our animal experiments, the adiponectin concentrations in serum and the expressions of p-AMPKα1/2 in liver, adipose and skeletal muscle tissues were significantly increased. The correlation coefficients were 0.785, 0.824 and 0.849 respectively. Thus, our studies show that catalpol may participate in AMPK phosphorylation in liver, adipose and skeletal muscle tissues by increasing the circulating adiponectin concentrations. Previous studies showed that metformin could stimulate AMPK as an agonist [34]. However, metformin did not affect circulating and adipose tissue adiponectin levels in db/db mice [35]. In this study, although metformin increased the expression of p-AMPKα1/2, it had no obvious effect on adiponectin. The results proved that metformin have direct effect on AMPK. Meanwhile, catalpol may activate AMPK directly as well, and that will be studied in our further work in vitro. In a word, our data indicated that catalpol may activate APMK with adiponectin intervention, and may account for the difference between catalpol and metformin.
In summary, we have demonstrated that catalpol could reduce blood glucose in db/db mice. It improved glucose tolerance, ameliorated insulin resistance, and decreased serum lipid concentrations. The mechanism may be attributed to activating AMPK in liver, skeletal muscle and adipose tissue indirectly or directly. These findings suggest that catalpol may be a potential candidate in the development of anti-diabetic natural medicine.
Go to :
 XML Download