Journal List > Korean J Physiol Pharmacol > v.19(1) > 1026069

Lee, Kim, Min, and Yang: Seasonal Acclimatization in Summer versus Winter to Changes in the Sweating Response during Passive Heating in Korean Young Adult Men

Abstract

We investigated the sweating response during passive heating (partial submersion up to the umbilical line in 42±0.5℃ water, 30 min) after summer and winter seasonal acclimatization (SA). Testing was performed in July during the summer, 2011 [summer-SA; temp, 25.6±1.8℃; relative humidity (RH), 82.1±8.2%] and in January during the winter, 2012 (winter-SA; temp, -2.7±2.9℃; RH, 65.0±13.1%) in Cheonan (126°52'N, 33.38'E), Republic of Korea. All experiments were carried out in an automated climatic chamber (temp, 25.0±0.5℃: RH, 60.0±3.0%). Fifteen healthy men (age, 23.4±2.5 years; height, 175.0±5.9 cm; weight, 65.3±6.1 kg) participated in the study. Local sweat onset time was delayed during winter-SA compared to that after summer-SA (p< 0.001). Local sweat volume, whole body sweat volume, and evaporative loss volume decreased significantly after winter-SA compared to those after summer-SA (p<0.001). Changes in basal metabolic rate increased significantly after winter-SA (p< 0.001), and tympanic temperature and mean body temperature were significantly lower after summer-SA (p<0.05). In conclusion, central sudomotor acitivity becomes sensitive to summer-SA and blunt to winter-SA in Rebubic of Korea. These results suggest that the body adjusts its temperature by economically controlling the sweating rate but does not lower the thermal dissipation rate through a more effective evaporation scheme after summer-SA than that after winter-SA.

ABBREVIATIONS

SA

seasonal acclimatization

Tty

tympanic temperature

Tb

mean body temperature

Tsk

mean skin temperature

INTRODUCTION

Heat dissipation via sweating is critical for human survival under heat conditions. The sweating function response is known to greatly improve when unacclimated subjects are exposed repeatedly to an artificial hot environment as well as to a natural hot climate [1,2]. Acclimation to describe the adaptive changes that occur within an organism in response to experimentally induced changes in particular climatic factors such as ambient temperature in a controlled environment [3]. Heat acclimation is characterized by improving the heat dissipation response mechanism, thereby allowing an individual to contain a rise in core temperature within acceptable physiological limits in a hot environment [4]. Whereas, the term acclimatization to describe the adaptive changes that occur within an organism in response to changes in the natural climate (e.g., seasonal or geographical) [3].
During summer, each person may repeatedly receive the whole body or local heat exposures that are characterized by the nature of lasting for long periods, compared with those for artificially induced heat acclimation [5].
Although it is well known that the sweating response to heat is influenced by acclimation or acclimatization [6,7,8], no study has compared sweating responses during seasonal acclimatization (SA) through summer and winter in the Republic of Korea. Daily exposure to the cold over months and years has been termed a cold acclimatization," whereas laboratory cold exposures can result in "acclimation" [3].
Summer in the Republic of Korea is similar to the weather found in subtropical and tropical regions. During this time period, most people are exposed to heat stress and undergo spontaneous SA [6]. Monsoons blow and heavy snow occurs in severe cold weather caused by cold and dry Siberian air masses. In areas with distinct seasonal fluctuations in ambient temperature during the summer (summer-SA) and during winter (winter-SA), sweating responses may change by season.
Therefore, the primary purpose of the present study was to examine the SA phenomena on the sweating response under the climatic conditions of summer-SA (July 2011) and winter-SA (January 2012) in the Republic of Korea.

METHODS

Subjects

Fifteen healthy male subjects, who lived all of their lives in the city of Cheonan (Chungnam), Republic of Korea, participated. Cheonan is located in the south western part of Korea (126°52'N, 33.38'E) and extends northeast (130°4'N, 43.0'E). The mean annual ambient temperature during July 2011 and January 2012 was 11.45℃ with a 73.55% relative humidity (Fig. 1). All individuals had been exposed to these environmental conditions at least 10 h each week (e.g. walking to class, driving to work, exercising outside). All subjects were university students who lived in Cheonan for 6 months before the experiment and during the experimental period (July 20, 2011~January 20, 2012). According to the replies to the questionnaire on their everyday life during the experimental period, we decided that all the individuals have acclimatized to the weather conditions. General physical characteristics of the subjects are summarized in Table 1. Body surface area (BSA) was calculated in accordance with the DuBois and DuBois formula [9]. Body fat percentage was measured using the impedance method. The subjects refrained from alcohol, caffeine, smoking, exercise, and medication use 24 h before the test. The subjects were given ~5-7 ml/kg tap water 4 h before testing. However, no subjects consumed water during passive heating in either summer or winter. This protocol was approved by the university of Soonchunhyang research committee. Written informed consent was obtained from all participants after a thorough explanation of the study including its purpose and risks and the procedures complied with the 2000 Declaration of Helsinki of the World Medical Association.

Passive heating protocol

All experiments were conducted in a climate chamber (temperature, 25±0.5℃, relative humidity, 60±3%; <1 m/s air velocity) from 2~5 p.m. Interpersonal variability in human body temperature was subtle, but was usually at its lowest at 4 a.m., and at its highest between 4 and 6 p.m. [10]. Thus, we conducted this experiment from 2~5 p.m. in order to control for the influence of the body temperature circadian rhythm, as described previously [6,11,12,13]. Upon arrival to the climate chamber, each subject was dressed in light indoor clothing without shoes and socks. The subjects sat in a chair in a relaxed posture for 60 min to become conditioned to the chamber climate prior to passive heating (partial submersion up to the umbilical line in 42±0.5℃ water for 30 min). The immersion depth, water temperature, and measurement methods were identical for all trials. This passive heating test was repeated in July and January on the same subjects.

Basal metabolic rate (BMR) measurements

BMR was measured with an expired air gas analyzer (Cosmed; Quark Pulmonary Function Testing Lung Volume Module 2 ergo, Rome, Italy).

Tympanic temperature (Tty) measurements

Tty was assessed in the left ear by inserting a thermistor probe (TSK7+1, Songkitopia, Inchen, Republic of Korea) with a small spring in the ear canal (K923, Takara, Yokohama, Japan), which was connected to a personal computer (model CF-T1, Panasonic, Tokyo, Japan) and a data logger (K-720, Technol Seven, Yokohama, Japan). When the thermistor probe contacted the tympanic membrane, the subject felt slight discomfort and could hear a scratching noise. The inner pinna was filled with small cotton balls to fix the probe in the ear [13].

Mean body temperature (Tb) and mean skin temperature (Tsk) measurements

Skin temperatures (Ts) of the chest (Tschest), upper arm (Tsarm), thigh (Tsthigh), and leg (Tsleg) were measured using thermistor thermometers (TSK7 + 1, Songkitopia) connected to a data logger (K-720, Technol Seven). Tsk was calculated in accordance with the Ramanathan equation [14] Tsk=0.3·(Tschest+Tsarm)+0.2·(Tsthigh+Tsleg). Tb was calculated according to Ramanathans's formula [14] as well as to Sugenoya and Ogawa [15] from Tty and Tsk by the following equation: Tb=(0.9·Tty+0.1·Tsk).

Local sweat volume and whole body sweat loss volume measurements

Local sweat volume of the forearm, thigh, abdomen, and chest were recorded continuously during passive heating using the capacitance hygrometer-ventilated capsule method [13]. In brief, dry nitrogen gas flowing at a constant rate of 500 ml/min into a capsule (9.621 cm2 in area) was attached to the skin at the site to be measured. Humidity of the effluent gas was evaluated with a hygrometer (model H211, Technol Seven). Local sweat volume was recorded every 30 s with a personal computer (model CF-T1, Panasonic), and the results are expressed in mg/cm2/min [13]. Weight loss after one-off passive heating was caused by sweating. Therefore, we measured body weight before and after passive heating to determine the whole body sweat loss volume both in summer and in winter.

Evaporative loss volume

Evaporative loss volume (µg/cm2/min) was measured with a Tewameter (model No. TM 210; Courage and Khazaka, Cologne, Germany) according to the manufacturer's recommendations and as described previously in detail [16]. Briefly, the measurement involved placing the probe device on the volar aspect of the chest, upper back, thigh, and forearm [12].

Statistical analysis

All values are means±standard deviations. Statistical significance was assessed by the paired t-test to compare data between summer-SA and winter-SA. Two-way repeated measures analyses of variance was used to evaluate the significance of Tty and Tb. Post-hoc paired sample t-tests were applied where appropriate and evaluated with Bonferroni adjustment. Statistical significance was accepted at the 0.05 level.

RESULTS

Tty and Tb

The results of the Tty and Tb measurements were compared between summer-SA and winter-SA. Tty and Tb were significantly higher during winter-SA than those after summer-SA (p<0.05, Table 2).

BMR measurements

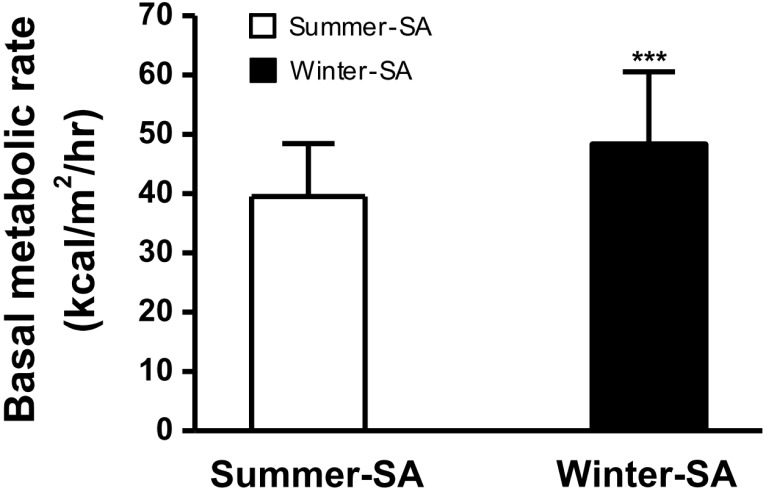
BMR was 48.35±12.18 kcal/m2/h (winter-SA) and 39.51±8.92 kcal/m2/h (summer-SA). BMR was significantly lower after summer-SA compared to that after winter-SA (p<0.001) (Fig. 2).

Local sweat onset time and local sweat volume

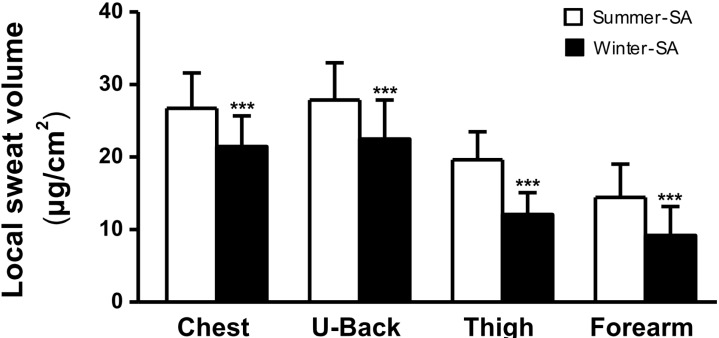
As shown in Fig. 3, the onset time of local sweating was significantly delayed after winter-SA compared to that after summer-SA on the chest (9.38±2.15 vs. 5.71±1.79 min), upper back (9.24±2.06 vs. 5.64±1.67 min), thigh (9.76±2.27 vs. 5.93±1.85 min), and forearm (10.10±2.38 vs. 6.31±2.06 min) (p<0.001). Local sweat volume was significantly lower after winter-SA compared to that after summer-SA on the chest (21.43±4.23 vs. 26.71±4.87 mg/cm2), upper back (22.47±5.38 vs. 27.85±5.14 mg/cm2), thigh (12.05±3.02 vs. 19.61±3.87 mg/cm2), and forearm (9.18±3.99 vs. 14.43±4.59 mg/cm2) (p<0.001) (Fig. 4).

Whole body sweat loss volume

Whole body sweat loss volume was 860.30±125.10 ml (summer-SA) and 593.70±116.40 ml (winter-SA). The whole body sweat loss volume was significantly lower after winter-SA than that after summer-SA (p<0.001).

Evaporative loss volume

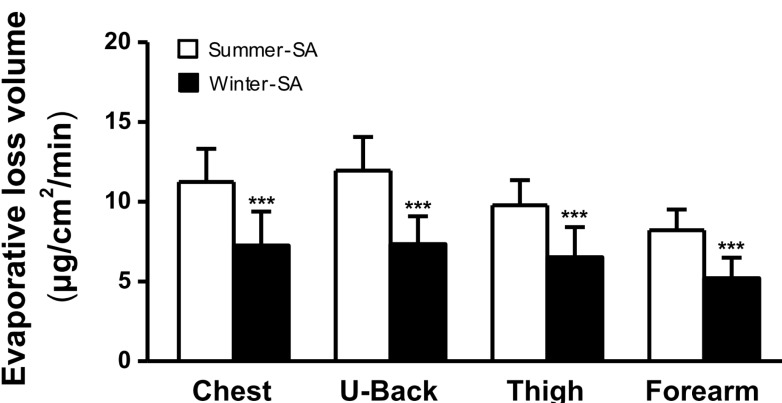
As shown in Fig. 5, evaporative loss volume was significantly lower after winter-SA than that after summer-SA on the chest (7.25±2.13 vs. 11.24±2.08 µg/cm2/min), upper back (7.34±1.75 vs. 11.95±2.11 µg/cm2/min), thigh (6.52±1.89 vs. 9.78±1.57 µg/cm2/min), and forearm (5.20±1.29 vs. 8.21±1.30 µg/cm2/min) (p<0.001).

DISCUSSION

Human basal metabolism is higher during winter and lower during summer [17]. In addition, long-term exposure to cold is known to cause increased metabolic heat production [18]. A lower BMR is more favorable for maintaining a lower body temperature in a hot environment and for having more tolerance to heat [19].
Thus, in the present study, a lower BMR after summer-SA (Fig. 2) was one of the most important physiological adaptations to a small rise in Tty and Tb compared to that after winter-SA (Table 2). It has been clearly demonstrated that the Tb threshold for the occurrence of central sudomotor activity is lower during summer than that during winter [5].
Lowering the Tb threshold for central sudomotor activity due to heat acclimation is generally understood in association with lowering of the set-point temperature for thermoregulation [20]. In a previous study, resting Tty tended to be lower by 0.3℃ in August compared with that in February in young male subjects [21].
Resting Tty in the present study was 0.09℃ lower after summer-SA compared with that after winter-SA. This finding does not demonstrate a lower resting Tty after summer-SA, because Tty was already at its basal level (36℃). However, it is difficult not to implicate the lower threshold for the occurrence of central sudomotor activity in terms of sweat control through summer-SA.
We recently confirmed that thermoregulatory molecules such as prostaglandin E2 (PGE2), cyclooxygenase (COX)-2 as well as basal body temperature were decreased by repetitive heat exposure (partial submersion up to the umbilical line in 42±0.5℃ water, 30 min immersion, 10 bouts for 3 weeks) [8]. PGE2 may be involved in the regulation of basal body temperature because reduced blood levels of PGE2 paralleled lower basal body temperature, despite the absence of fever. PGE2 is produced in most cells from the COX-mediated metabolism of arachidonic acid [22]. Therefore, we speculated that reduced COX-2 blood levels were associated with lower basal body temperature in summer-SA.
Concerning acclimatization, seasonal differences in sweating responses of the residents in the temperate zone and showed that sweat was more active in summer than in winter [23].
In the present study, local sweat onset time during passive heating was significantly delayed by winter-SA compared to that of summer-SA (Fig. 3). Thus, the central sudomotor mechanism is thought to play an essential role in the adaptive increase in sweat volume during summer. Shorter local sweat onset time after summer-SA is associated with increased cholinergic sensitivity of sweat glands [11].
Local sweat volume (Fig. 4) and whole body sweat loss volume decreased significantly after winter-SA compared to those after summer-SA. Hypothalamic sudomotor center dysfunction may be accompanied by anhydrosis, despite normal eccrine gland histology [24]. Therefore, our results suggest that the time from summer-SA to winter-SA blunted central sudomotor activity rather than changing eccrine gland function.
Thermal equilibrium is maintained primarily by evaporative cooling. An increase in Tsk induces an increase in Tty due to the necessity to hold heat transfer from the core to the skin surface to offset the decrease in heat transfer by the rise in Tsk. Sweating begins when both Tsk and Tty reach the threshold for sweat onset. Following this, the increase in sweating brings about abundant sweating that enables effective heat dissipation by taking the heat of evaporation from the skin surface, thereby lowering Tty. At the same time, the threshold for sweat onset in internal temperature, namely Tty, is lowered [21].
Skin evaporative loss volume can be changed within the same season (before summer-SA vs. after summer-SA) [12]. In the present study, a significantly larger evaporative loss volume after summer-SA (Fig. 5) was reflected by lower Tty and Tb, which demonstrated an adaptive change in body temperature (Table 2).
Several individual factors affect the human physiological responses to heat and cold and subsequent adaptation. Body composition and weight were observed to affect the thermal responses [25]. Thus, it is possible that weight and body fat during different seasons may be associated with seasonal changes in sweating responses (Table 1). Brown adipose tissue (BAT) is found in high proportions in young men, but the metabolic action of BAT is reduced in overweight and obese subjects [26]. A previous study found a strong influence of both photoperiod and ambient temperature on BAT expression and function [27]. Therefore, further studies are needed to elucidate the sweating responses involved in body composition depending on the season. In conclusion, central sudomotor acitivity becoming sensitivity to summer-SA and blunt to winter-SA in Rebubic of Korea. Therefore, the sweating response increased during summer-SA compared with that after winter-SA. These results suggest that the body can adjust its temperature by economically controlling the sweating rate, while not lowering the thermal dissipation rate through a more effective evaporation scheme after summer-SA than that after winter-SA in Republic of Korea.

ACKNOWLEDGEMENTS

We thank the subjects whose participation made this study possible. This work was supported by the Soonchunhyang University Research Fund.

ABBREVIATIONS

SA

seasonal acclimatization

Tty

tympanic temperature

Tb

mean body temperature

Tsk

mean skin temperature

References

1. Fox RH, Löfstedt BE, Woodward PM, Eriksson E, Werkstrom B. Comparison of thermoregulatory function in men and women. J Appl Physiol. 1969; 26:444–453. PMID: 5775330.
crossref
2. Henane R, Valatx JL. Thermoregulatory changes induced during heat acclimatization by controlled hypothermia in man. J Physiol. 1973; 230:255–271. PMID: 4708895.
3. IUPS Thermal Commission. Glossary of terms for thermal physiology. Jpn J Physiol. 2001; 51:245–280.
4. Irion GL. Responses of distance runners and sprinters to exercise in a hot environment. Aviat Space Environ Med. 1987; 58:948–953. PMID: 3675466.
5. Taniguchi Y, Sugenoya J, Nishimura N, Iwase S, Matsumoto T, Shimizu Y, Inukai Y, Sato M. Contribution of central versus sweat gland mechanisms to the seasonal change of sweating function in young sedentary males and females. Int J Biometeorol. 2011; 55:203–212. PMID: 20532572.
crossref
6. Lee JB, Kim TW, Min YK, Yang HM. Seasonal acclimatization to the hot summer over 60 days in the Republic of Korea suppresses sweating sensitivity during passive heating. J Therm Biol. 2013; 38:294–299.
crossref
7. Lee JB, Kim TW, Shin YO, Min YK, Yang HM. Effect of the Heat-exposure on Peripheral Sudomotor Activity Including the Density of Active Sweat Glands and Single Sweat Gland Output. Korean J Physiol Pharmacol. 2010; 14:273–278. PMID: 21165324.
crossref
8. Shin YO, Lee JB, Min YK, Yang HM. Heat acclimation affects circulating levels of prostaglandin E2, COX-2 and orexin in humans. Neurosci Lett. 2013; 542:17–20. PMID: 23523649.
crossref
9. DuBois D, DuBois EF. Clinical calorimetry 10: a formula to estimate the approximate surface area if height and weight be known. Arch Intern Med. 1916; 17:303–311.
10. Maughan RJ, Shirreffs SM, Ozgünen KT, Kurdak SS, Ersöz G, Binnet MS, Dvorak J. Living, training and playing in the heat: challenges to the football player and strategies for coping with environmental extremes. Scand J Med Sci Sports. 2010; 20(Suppl 3):117–124. PMID: 21029198.
crossref
11. Kim TW, Shin YO, Lee JB, Min YK, Yang HM. Caffeine increases sweating sensitivity via changes in sudomotor activity during physical loading. J Med Food. 2011; 14:1448–1455. PMID: 21883004.
crossref
12. Lee JB, Bae JS, Matsumoto T, Yang HM, Min YK. Tropical Malaysians and temperate Koreans exhibit significant differences in sweating sensitivity in response to iontophoretically administered acetylcholine. Int J Biometeorol. 2009; 53:149–157. PMID: 19048305.
crossref
13. Lee JB, Bae JS, Shin YO, Kang JC, Matsumoto T, Toktasynovna AA, Kaimovich AG, Kim WJ, Min YK, Yang HM. Long-term tropical residency diminishes central sudomotor sensitivities in male subjects. Korean J Physiol Pharmacol. 2007; 11:233–237.
14. Ramanathan NL. A new weighting system for mean surface temperature of the human body. J Appl Physiol. 1964; 19:531–533. PMID: 14173555.
crossref
15. Sugenoya J, Ogawa T. Characteristics of central sudomotor mechanism estimated by frequency of sweat expulsions. Jpn J Physiol. 1985; 35:783–794. PMID: 4079134.
crossref
16. Pinnagoda J, Tupker RA, Agner T, Serup J. Guidelines for transepidermal water loss (TEWL) measurement. A report from the Standardization Group of the European Society of Contact Dermatitis. Contact Dermatitis. 1990; 22:164–178. PMID: 2335090.
17. Shimaoka A, Machida K, Kumae T, Sugawara K, Kurakake S, Okamura N, Suemune J. Seasonal variation of basal metabolism. Jpn J Biometeorol. 1987; 24:3–8.
18. Scholander PF, Hammel HT, Andersen KL, Loyning Y. Metabolic acclimation to cold in man. J Appl Physiol. 1958; 12:1–8. PMID: 13502248.
crossref
19. Hori S. Adaptation to heat. Jpn J Physiol. 1995; 45:921–946. PMID: 8676578.
crossref
20. Hensel H. Thermoreception and temperature regulation. London: Academic;1981. p. 219–234.
21. Nakamura Y, Okamura K. Seasonal variation of sweating responses under identical heat stress. Appl Human Sci. 1998; 17:167–172.
crossref
22. Blatteis CM. Prostaglandin E2: a putative fever mediator. In : Mackowiak PA, editor. Fever: Basic Mechanisms and Management. Philadelphia: Lippincott-Raven;1997. p. 117–145.
23. Ohara K. Chloride concentration in sweat; its individual, regional, seasonal and some other variations, and interrelations between them. Jpn J Physiol. 1966; 16:274–290. PMID: 5297694.
crossref
24. Shimizu H, Obi T, Miyajima H. Anhidrosis: an unusual presentation of diabetes insipidus. Neurology. 1997; 49:1708–1710. PMID: 9409374.
crossref
25. Bittel JH. Heat debt as an index for cold adaptation in men. J Appl Physiol (1985). 1987; 62:1627–1634. PMID: 3597234.
crossref
26. van Marken Lichtenbelt WD, Vanhommerig JW, Smulders NM, Drossaerts JM, Kemerink GJ, Bouvy ND, Schrauwen P, Teule GJ. Cold-activated brown adipose tissue in healthy men. N Engl J Med. 2009; 360:1500–1508. PMID: 19357405.
27. Persichetti A, Sciuto R, Rea S, Basciani S, Lubrano C, Mariani S, Ulisse S, Nofroni I, Maini CL, Gnessi L. Prevalence, mass, and glucose-uptake activity of 18F-FDG-detected brown adipose tissue in humans living in a temperate zone of Italy. PLoS One. 2013; 8:e63391. PMID: 23667608.
Fig. 1
Monthly mean daily average ambient temperatures from July 2011 to January 2012 in Cheonan (126°52'N, 33.38'E) Republic of Korea. Cheonan is located in a temperate zone (four distinct geopolitical seasons). Monthly mean daily average ambient temperature during the experimental period from July 20, 2011 (Exp 1) to January 20, 2012 (Exp 2). Exp 1, experiment 1 summer (July 2011; temperature, 25.6±1.8℃ relative humidity, 82.1±8.2%) and Exp 2, experiment 2 winter (January. 2012; -2.7±2.9℃ relative humidity, 65±13.1%).
kjpp-19-9-g001
Fig. 2
Basal metabolic rate of summer-SA and winter-SA. Values are mean±standard deviation. Statistical significance was set at ***p<0.001. SA, seasonal acclimatization; summer-SA, July 2011 (temperature, 25.6±1.8℃; relative humidity, 82.1±8.2%); winter-SA, January 2012 (temperature, -2.7±2.9℃; relative humidity, 65±13.1%).
kjpp-19-9-g002
Fig. 3
Local sweat onset time of summer-SA and winter-SA during passive heating. Values are mean±standard deviation. Statistically significant differences were set at ***p<0.001. SA, seasonal acclimatization; summer-SA, July 2011 (temperature, 25.6±1.8℃; relative humidity, 82.1±8.2%); winter-SA, January 2012 (temperature, -2.7±2.9℃; relative humidity, 65±13.1%); passive heating, half bath into hot water, 42±0.5℃ for 30 min.
kjpp-19-9-g003
Fig. 4
Local sweat volume during passive heating. Values are mean±standard deviation. Statistically significant differences were set at ***p<0.001. SA, seasonal acclimatization; summer-SA, July 2011 (temperature, 25.6±1.8℃; relative humidity, 82.1±8.2%); winter-SA, January 2012 (temperature, -2.7±2.9℃; relative humidity, 65±13.1%); passive heating, half bath into hot water, 42±0.5℃ for 30 min.
kjpp-19-9-g004
Fig. 5
Volume of skin evaporative loss volume (evaporative rate) during passive heating. Values are mean±standard deviation. Statistically significant differences were set at ***p<0.001. SA, seasonal acclimatization; summer-SA, July 2011 (temperature, 25.6±1.8℃; relative humidity, 82.1±8.2%); winter-SA, January 2012 (temperature, -2.7±2.9℃; relative humidity, 65±13.1%); passive heating, half bath into hot water, 42±0.5℃ for 30 min.
kjpp-19-9-g005
Table 1
Physical characteristics of the subjects (n=15)
kjpp-19-9-i001

Values are means±standard deviations. *p<0.05 indicates a significant difference between summer and winter.

SA, seasonal acclimatization; summer, July 2011 (temperature, 25.6±1.8℃ relative humidity, 82.1±8.2%); winter, January 2012 (temperature, -2.7±2.9℃, relativehumidity, 65±13.1%); BSA, body surface area; BMI, body mass index.

Table 2
Comparison of tympanic temperature (Tty) and mean body temperature (Tb) between summer-SA and winter-SA
kjpp-19-9-i002

Values are mean±standard deviation. *p<0.05 indicates a significant difference between summer and winter †††p<0.001 indicates a significant difference between rest and passive heating.

SA, seasonal acclimatization; summer, July 2011 (temperature, 25.6±1.8℃ relative humidity, 82.1±8.2%) winter, January 2012 (temperature, -2.7±2.9℃, relativehumidity, 65±13.1%) passive heating, half bath into hot water, 42±0.5℃ for 30 min.

TOOLS
Similar articles