

 PDF
PDF ePub
ePub Citation
 Print
Print


INTRODUCTION
Asthma is a chronic respiratory disorder showing recurring episodes of airflow obstruction and impaired breathing. The major symptoms are usually reversible spontaneously or by appropriate medical treatment. In asthma, the airways are inflamed and become hyperresponsive to various agents and noxious stimuli. Hyper-reactive airway contractility is called airway hyperreactivity or hyperresponsiveness (AHR) [1]. In clinical diagnosis, methacholine challenge test (MCT) is widely used to evaluate airway hyperresponsiveness (AHR) in patients with suspected asthma. Asthmatic patients usually demonstrate a meaningful decrease in lung function (e.g. FEV1) to an inhaled methacholine (MCh) at relatively low range of concentrations. However, owing to false-negative results in non-atopic individuals, one should not use MCT as the sole method to exclude the diagnosis of asthma [2].
As a complex immunological disorder, the symptoms of asthma are associated with T-helper 2 cell (Th2) cytokines such as IL-13 [3]. Recently, IL-13 has been reported to activate Ca2+ signaling in airway smooth muscle cells [4]. The critical roles of IL-13 and its signaling pathways for the pathophysiology of asthma have been proven in numerous previous studies including IL-13 transgenic animals [4,5]. However, asthma is basically a human disorder, and it is difficult to establish models with small experimental animals that can recapitulate the full range of components reflecting the human symptoms and signs. In spite of such limitations, ovalbumin-sensitized mice (Ova-asthma) are widely used for the laboratory studies of asthma [6,7]. Again, however, one should be cautious to interpret the results using Ova-asthma because they do not develop genuine asthma, but demonstrates certain inflammatory and pathophysiological features similar to the asthma condition. Albeit the limitations of Ova-asthma, interest in the physiological measurements in mice is increasing.
Nevertheless, due to the small size of mouse, physiological measurement of lung function is relatively difficult in mice. Body plethysmograph is also used for the airway function test of mice in vivo, and the Ova-asthma studies have shown increased airway resistance and AHR in response to MCh inhalations [8,9]. However, such studies reflect the complex changes and variety of factors determining airway resistance, and therefore, it is difficult to dissect the persistent and irreversible functional changes of airway smooth muscle in mice.
For the direct analysis of dynamic changes in the airwary lumen area, microscopic observation of live lung slices is a feasible method, called Precision-cut lung slice (PCLS). The lung slices obtained from using PCLS method are used to observe anatomical localization, size and airway constriction to pharmacological responses under a microscope. In our previous studies using rat lungs, we confirmed the effectiveness of PCLS technique for studying airway contractility as well as pulmonary arterial responses to agonists and hypoxia [10]. The airways in rat PCLS showed consistent, reversible, and repetitive constrictions in response to MCh at various concentrations [11]. However, using mouse lungs for PCLS needs technical modification and its application for airway disease study requires further validation. A previous study using PCLS from industrial chemical allergen-induced asthmatic mice showed an increase in MCh sensitivity of airways [12]. In contrast, another study using PCLS from Ova-asthma mice reported that there is no significant change in the airway contractile responses to 1 µM ACh [13]. However, this study tested only at single concentration of ACh and did not compare the contraction by other conditions such as membrane depolarization. Furthermore, the above two studies used Balb/c mice whereas large number of recent studies adopt genetically modified mouse models with C57BL/6 background. Such controversies and lack of information request further investigation on the validity and reliability of using PCLS for laboratory study of asthma using animal models.
On these backgrounds, we aim to clarify whether the MCh-induced constriction of intra-parenchymal airway and its concentration-dependence are permanently changed in Ova-asthma model from C57BL/6 mice. Also, we try to compare the responses of airways from IL-13 transgenic mice (IL-13TG) using PCLS.
Go to : 
METHODS
Animals
Lung slices were taken from 8 week old female C57BL/6 mice obtained (Sungnam, South Korea) and reared under specific pathogen-free conditions. This investigation was performed in compliance with the Guide for the Care and Use of Laboratory Animals published by the US National Institutes of Health (NIH Publication NO. 85-23, Revised 1996) and was approved by the Institutional Animal Care and Use Committee of the Seoul National University College of Medicine.
Murine asthma model
A protocol for murine asthma model was performed as previously described [14]. Noninvasive whole body plethysmography (Allmedicus, Seoul, South Korea) was used for the evaluation of AHR as previously described [14]. Briefly, mice in the plethysmograph chamber and exposed to an ultrasonically produced aerosol of PBS (basal readings) and then to methacholine at 6.25, 12.5, 25, and 50 mg/ml for 3 min. We took readings of enhanced pause (Penh) that reflect airway resistance as described by Hamelmann et al. [15]. Bronchoalveolar lavage (BAL) fluid and lung tissue were obtained for the analysis of cell count, cytokine levels, and histology as previously described [14]. Two successive volumes of 0.75 ml of PBS were instilled and gently aspirated and these two volumes were pooled. For histological analysis, the lung was perfused with cold PBS through the right ventricle until the pulmonary vasculature was clean. The whole lung was inflated with fixatives for histology (H&E staining).
Solutions and Chemicals
The normal Tyrode's solution consists of the following composition (in mM): NaCl 145, KCl 3.6, CaCl2 1.3, MgCl2 1, 4-(2-hydroxyethyl)-1-piperazineethanesulfonic acid (HEPES) 10, and glucose 5 (pH 7.4 with NaOH). To evaluate viability of airway smooth muscle cells, the high K+ solution (60 mM) was used by replacing NaCl with an equimolar amount of KCl in NT. The bath Ca2+ ions were eliminated for examining maximum relaxation of airway smooth muscle cells by using Ca2+-free NT solution and 1 mM of EGTA. The other drugs including MCh and serotonin were purchased from Sigma-Aldrich.
Preparation of lung slices
The animals were anaesthetized (60 mg/kg pentobarbital) and the trachea was cannulated. After laparotomy, the diaphragm was removed and heparin (20 IU) was injected into the right ventricle. The animals were exsanguinated by cutting the vena cava inferior and though the cannula, lungs were perfused with NT solution until the lungs were free of blood. Then, a low melting-point agarose solution (1.5% in MEM, 44 ml/kg) was instilled into the airways. In order to solidify the agarose and harden them for cutting, the lungs and the heart were removed en bloc from thoracic cavity and placed on ice for 10 min. Tissue slices (200 µm) were prepared using the Vibratome VT1200 (Leica Microsystems GmbH, Wetzlar, Germany). The lung slices were incubated at 37℃ in a humid atmosphere in minimal essential medium (pH 7.2). The medium was changed every 30 min during the first 2 h followed by a change every 1 h for the next 2 h, in order to remove the agarose and cell debris for the tissue.
Image acquisition and analysis
The prepared lung slices were transferred to PCLS chamber (Harvard Apparatus, Holliston, MA, USA) on the stage of an inverted microscope (IX70, Olympus, Japan) and warmed at 37℃. Intraparenchymal airways were focused, imaged with Cascade 650 CCD camera (Roper Scientific, USA) controlled by MetaMorph software (Universal Imaging, Downingtown PA, USA). After incubation for 20 min, the images containing airway were acquired at every 10s. The obtained images were analyzed by MetaMorph software. The area of the airway lumen (AW) was calculated, with respect to time, by pixel summing. Decrease in AW (ΔAW) by agonists was normalized to the basal AW before drug application or to the maximum ΔAW under the treatment with 100 µM MCh.
Statistical analysis
Data are shown as original recordings and bar graphs of means±SEM. The concentration-response curves were analyzed as sigmoidal dose-response curves. Paired or unpaired Student's t-test was used for statistical analysis, with P value for significant difference set at p<0.05.
Go to :
RESULTS
Lung inflammation and AHR in the murine asthma model
The number of inflammatory cells, especially the eosinophil count was increased in the BAL fluid of Ova-asthma and IL-13TG mice (Fig. 1A). Whole body plethysmography showed that the Penh was higher in the two groups than control, reflecting increased airway resistance (Fig. 1B) [15]. In lung histology, increased infiltration of inflammatory cells was observed in both Ova-asthma and IL-13TG especially in the interstitial and perivascular area (Fig. 1C).
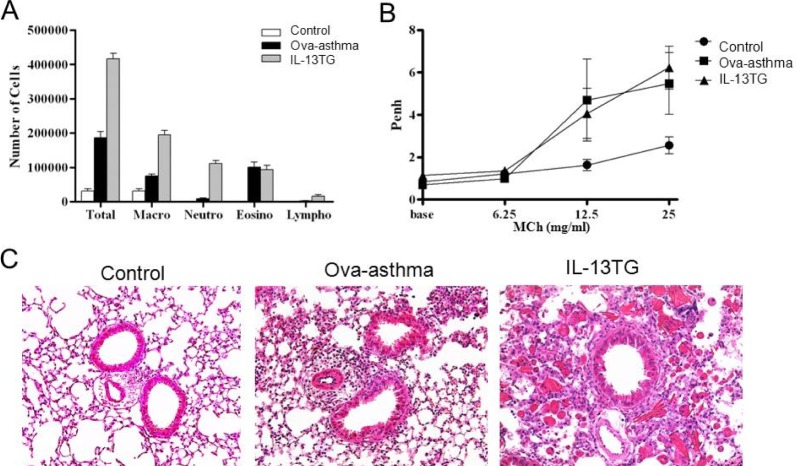 | Fig. 1Airway inflammation and hyperresponsiveness in murine asthma model. Increased total and differential cell count in bronchoalveolar lavage (BAL) fluid (A) and enhanced airway hyperresponsiveness (Penh) [15] (B) in Ova sensitized and challenged murine Ova-asthma and IL-13TG compared with untreated control. Lung histology shows increased peribronchial and perivascular infiltration of inflammatory cells in Ova-asthma and IL-13TG (C).
|
Airway constrictions in PCLS
As shown in a representative image of PCLS, airways are located beside pulmonary arteries having characteristic thick walls with almost obliterated lumen (Fig. 2A~C). The other areas show mesh-like structure that reflects alveolar septum and ductal walls. It is notable that the inflammatory cells in the histology study (Fig. 1C) were not observed in PCLS preparations. Although not quantified in this study, compared with the images from control PCLS, those from Ova-asthma and IL-13TG showed less compact walls than control (Fig. 2A~C). Such difference might imply weakened structural endurance due to inflammation and vulnerability of destruction during PCLS preparations.
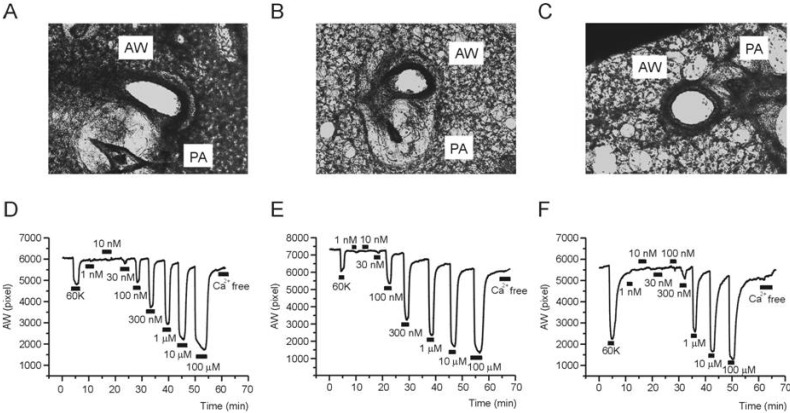 | Fig. 2Representative cases of PCLS experiment. Images of mouse lung slices taken from PCLS preparations; Control (A), Ova-asthma (B), and IL-13TG (C). Representative recordings of airway area (pixel number, AW) changes in response to 60K-induced depolarization and different concentrations of MCh in Control (D), Ova-asthma (E), IL-13 TG (F).
|
For the evaluation of airway contractility, high K+ (60 mM KCl) solution was transiently perfused (2~3 min). The 60 mM KCl solution would depolarize the airway smooth muscle cells and induce Ca2+ influx via L-type voltage-operated Ca2+ channels. The 60K condition consistently induced reversible constriction in all three groups (control, Ovaasthma, IL-13 TG). Then, after returning to NT perfusate, various concentrations of MCh (30 nM~100 µM) were applied (Fig. 2D~F). At the end of experiment, Ca2+-free NT was perfused to confirm the area of airway in its fully relaxed state. In the procedure of repetitive MCh applications, the AW in Ca2+-free condition became slightly smaller than the initial value. It might be due to lack of extrinsic recoil forces, an intrinsic limit of PCLS technique.
The AW changes (ΔAW) induced by 60K and 100 µM MCh were compared between groups. There was no significant difference in the MCh-induced ΔAW between control, Ova-asthma, and IL-13 TG. In contrast, the IL-13TG showed significantly larger amplitudes of 60K-contraction than both control and Ova-asthma (Fig. 3A). The 60K-induced ΔAW normalized to each basal AW (ΔAW/AWbasal) also showed higher level in IL-13TG than control and Ova-asthma (Fig. 3B).
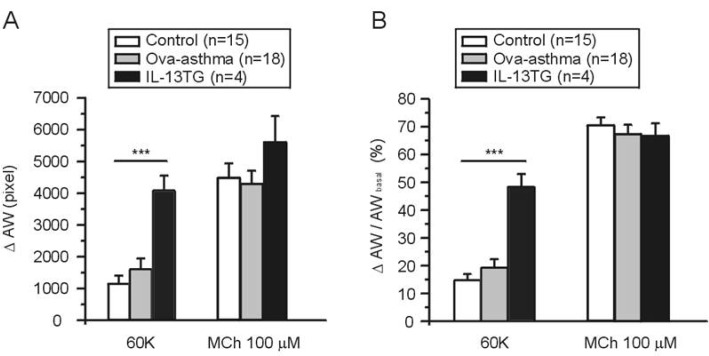 | Fig. 3AW change (ΔAW) during 60K-contraction and 100 µM MCh application. Summary of ΔAW in Control (n=15), Ova-asthma (n=18) and IL-13TG (n=4) are displayed as bar graphs (mean±SEM). Numbers of tested slices are also directly indicated above the figure. Ova-asthma had a tendency of higher sensitivity to 60 K (***p<0.001) in both ΔAW area (pixel number) changes (A) and ΔAW normalized to each basal (B, ΔAW/AWbasal). However, there were no differences in the maximum stimulation of muscarinic receptor among three groups.
|
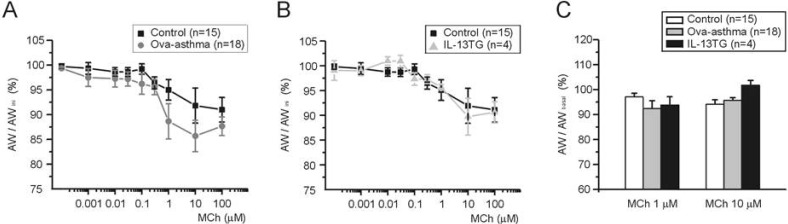
To compare between groups, ΔAW-induced by differential concentrations of MCh were normalized either to AWbasal before drug application (ΔAW/AWbasal, Fig. 4A) or to maximum ΔAW-induced by 100 µM MCh (ΔAW/ΔAWMCh-Max, Fig. 4B). The averaged concentration-responses were fitted to logistic function, and the half-effective concentration (EC50) was obtained. In summary, EC50 values obtained by the first criteria (Fig. 4A) are 319, 455, and 616 nM for control, Ova-asthma, and IL-13TG, respectively. EC50 valued obtained by the second criteria (Fig. 4B) are 258, 316, and 522 nM for control, Ova-asthma, and IL-13TG, respectively. However, owing to the variance of data, the apparent difference in EC50 was statistically insignificant between the tested groups (p>0.05).
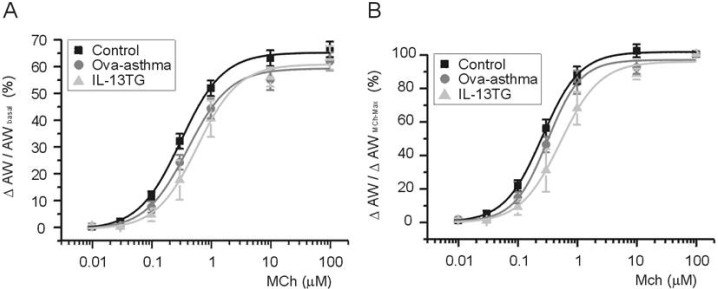 | Fig. 4Pharmacological sensitivity of AW responses to muscarinic stimulations. Concentration-response curves to differential concentrations of MCh. For comparison between groups, ΔAW normalized to each basal (A, ΔAW/AWbasal) and to maximum ΔAW-induced by 100 µM MCh (B, ΔAW/AWMChMax). Number of tested slices for the each group is same with that of figure 3.
|
Different from the AHR in vivo, the pharmacological assay demonstrated paradoxical decrease of MCh-sensitivity in Ova-asthma airway smooth muscle. However, an interesting feature draws our attention. When analyzing the reversibility of AW on MCh washout, the recovery in Ovaasthma PCLS showed relatively sluggish and less complete tendency. The AW were measured just before applying each concentration of MCh (10 nM~100 µM), and normalized to initial AW measured after testing 60K contraction (AWini). The percent normalized recovery (AW/AWini) is summarized in Fig. 5. The recovery from prior contraction by MCh became incomplete in all three groups at above 0.1 µM MCh test. The recovery in Ova-asthma showed more impaired tendency than control after 1 µM MCh test. However, the tendency was not statistically significant (Fig. 5A, p=0.69 and 0.15 at 1 µM and 10 µM, respectively). The same analysis in IL-13TG showed no difference from the control (Fig. 5B).
 | Fig. 5Recovery AW after repetitive and incremental application of MCh. AWs were measured at 3 min after washout of various concentrations of MCh (see Fig. 2D-F). Then the measured AW was normalized to the initial AW in each slice (AW/AWini, A and B) or to the AW measured just before the application of MCh (C, AW/AWbasal). Comparison of control vs. Ova-asthma (A), and of control vs. IL-13TG (B). In C, summary of AW/AWbasal (%) for 1 and 10 µM of MCh in Ova-asthma and IL-13TG are shown as bar graphs. Albeit the apparent difference between control and Ova-asthma at 1 µM of MCh (A), statistical comparison shows p>0.05. Numbers of tested slices are directly indicated in figure.
|
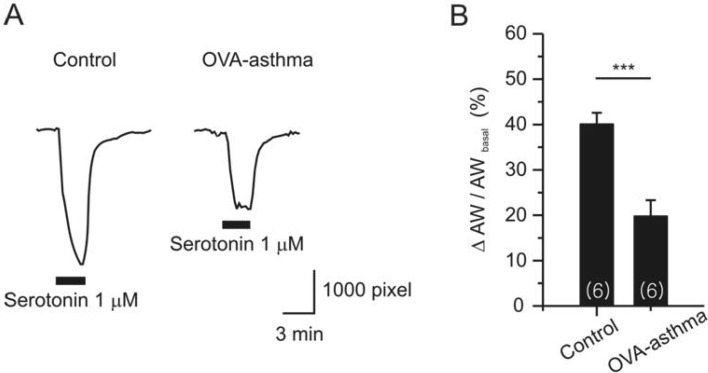
Apart from the MCh assay, we compared serotonin (5-HT)-induced constriction of airway in PCLS. 5-HT is known to bind with type 2A receptor in mouse airway smooth muscle [16]. Single dose of 5-HT (1 µM) induced persistent constriction in both control and Ova-asthma (Fig. 6A). However, the Ova-asthma showed attenuated constriction to 5-HT (Fig. 6B). The response of IL-13TG to 5-HT was similar to the control, but was not presented due to insufficient number of cases (n=2).
Go to :
DISCUSSION
The present study shows that the dose-dependent MCh contraction of airway smooth muscle in PCLS was unchanged or even showed less sensitive tendency in Ovaasthma and IL-13TG. Because the in vivo MCh provocation test using plethysmography showed AHR in the both airway inflammation models, such negative results are unexpected ones. It suggests that the enhanced airway reactivity in the murine asthma model is easily reversible ex vivo, or the factors other than smooth muscle contractility are underlying the functional phenotype of asthma.
Similar to our present results obtained in the PLCS from C57BL/6 mice, a previous PCLS study in Ova-asthma model of Balb/c mice showed unchanged airway contractile response to 1 µM ACh [13]. However, since the previous one tested only a single dose of ACh, one cannot directly compare the results. Nonetheless, it is confirmed that the Ova-asthma models from at least two strains of mice show that the airway contractile responses to muscarinic stimulation is not permanently changed. The smaller constriction of PCLS airway by 5-HT in Ova-asthma was another unexpected result (Fig. 6). Regarding to the paradoxical change, one has to be cautious about the persistence of functional airway remodeling in the inflammatory disease models. The Ova-asthma model is not a real chronic disease model, which limits addressing questions regarding airway remodeling [6]. In this respect, the utility of PCLS for studying pathophysiological airway changes is asthma model is limited, and requires careful interpretation.
A plausible explanation for the lack of MCh sensitization in PCLS is that the inflammatory environments were removed in the incubation process for cleansing the agarose infused through airways. Variety of paracrine substances in the inflamed lung parenchyma and immune cells might be critical for the hypersensitive airway constriction by MCh. Such molecules might also provoke neural responses regulating airway diameter [15]. In addition to the PLCS preparation per se, continuous perfusion of bath solution would also wash away the putative intrinsic factors regulating airway contractility in vivo.
Another suspicious factor of the AHR in vivo is edematous narrowing of airway lumens owing to inflammatory leak of plasma and infiltration of immune cells. Such structural changes, i.e. decreased diameter would induce severe obstruction even with similar contraction of airway smooth muscle. The incubation of PCLS for 24 h might have eliminated such structural factors in the PCLS assay. Asthma is a chronic disorder, while the standard Ova challenged mouse is an acute model where the response could resolve spontaneously over a few days.
Although the pharmacological potency of MCh was not enhanced in Ova-asthma airway smooth muscle ex vivo, we initially had an impression that the recovery of airway size (AW) after transient MCh application is slightly impaired. However, the difference was statistically insignificant. If such change is significantly induced in vivo, the repetitive provoke with increasing MCh might result in the cumulative augmentation of the airway resistance. More rigorous investigation of Ova-asthma with longer period of inflammation might reveal the putative impairment of AW recovery from agonist stimulation.
Our study also demonstrates that the 60K-contraction was enhanced in IL-13TG while not in Ova-asthma (Fig. 2, 3). Although the electrophysiological change was not investigated here, it might suggest that an enhanced expression of voltage-operated Ca2+ channels (VOCCs) in the IL-13TG airway smooth muscle. The membrane potential of airway smooth muscle can be depolarized when non-selective cation channels such as TRP channels are activated by inflammatory cytokines in the airway smooth muscle cells [17]. Therefore the enhanced 60K-constriction in IL-13TG might imply a pathophysiological change consistent with enhanced airway response. On the other hand, voltage-independent store-operated Ca2+ entry is known to be enhanced by IL-13 in airway smooth muscle [18]. Further investigation of the Ca2+ channel currents using patch clamp technique is requested in the asthmatic model and other inflammatory lung diseases [19, 20, 21].
Tissue slice technique is popular in brain research [22] while its application in the lung physiology and pathophysiology is not widely applied yet. In a previous study, Wholsen et al. used human PCLS sensitized with serum from allergy patients (passive sensitization), during the incubation period in vitro. Then, they examined acute constriction of airways in response to pollen extract or cytokines (in vitro provocation) not using MCh. The in vitro sensitized slice showed allergic response-like airway constriction while not in the non-sensitized slice [23]. Although there are many different aspects (sensitization condition, agonist, and species) between Wholsen et al. and ours, the sensitization protocol during tissue culture period might reveal additional change of DAW to MCh in the mouse Ova-asthma.
In summary, here we present that the PCLS technique is useful for the evaluation of airway contractility from murine asthmatic model and transgenic animal. However, owing to the washout conditions and incubation period, the inflammatory signals and non-permanent changes seems to be reversed before the evaluation and video-analysis. Careful interpretation is requested for the appropriate interpretation of the experimental results from in vivo and PCLS in vitro studies.
Go to :
 XML Download