

 PDF
PDF ePub
ePub Citation
 Print
Print


ABBREVIATIONS
HDAC
histone deacetylases
TSA
trichostatin A
ROS
reactive oxygen species
VSMC
vascular smooth muscle cells
Ang II
Angiotensin II
AT1R
angiotensin II receptor type 1
AT2R
angiotensin II receptor type 2
IACUC
Institutional animal care and use committee
PE-50
Polyethylene tubing
SBP
systolic blood pressure
DBP
diastolic blood pressure
MAP
mean arterial pressure
PP
pulse pressure
NADPH
nicotinamide adenine dinucleotide phosphate
PCAF
p300/CBP-associated factor
INTRODUCTION
Histone deacetylases (HDACs) are transcriptional co-repressors that catalyze histone or protein deacetylation in diverse physiological systems [1]. HDACs regulate cellular homeostasis via post-translational modification as well as through transcriptional gene regulation. It was recently reported that HDAC affects vascular inflammatory responses and promotes hypertension [2]. This report suggested that HDACs could be important therapeutic targets in cardiovascular diseases.
Increased reactive oxygen species (ROS) production or oxidative stress is known to be important in the pathogenesis of hypertension. Mice carrying a targeted mutation in the p66shc gene display prolonged lifespan, reduced production of intracellular oxidants, and increased resistance to oxidative stress-induced apoptosis [34]. p66shc is one of three Shc adaptor protein isoforms, which are named based on their relative molecular masses: 46, 52, and 66 kDa (p46Shc, p52Shc, and p66Shc, respectively). p66shc is phosphorylated on serine 36, and this phosphorylation event is essential to its function in the regulation of cellular ROS levels [567]. A growing body of evidence implies that p66shc plays a critical role in the pathophysiology of aging and cardiovascular diseases [89]. Therefore, identifying the upstream regulators of p66shc phosphorylation could lead to novel therapeutic targets for cardiovascular diseases.
Angiotensin II (Ang II) is a peptide hormone that causes vasoconstriction and consequentially increases blood pressure. The actions of Ang II are mediated via signaling pathways that are activated upon binding to the angiotensin II receptor type 1 and type 2 (AT1R and AT2R). Abdominal aortic coarctation above the renal artery is known to cause hypertension proximal to the level of constriction as a consequence of reduced renal perfusion and subsequent activation of the renin-angiotensin system [10]. Increased phosphorylation of p66shc is an important adaptive signal mediator in rats with aortic coarctation [11]. However, the effect of HDAC inhibition on aortic coarctation-induced hypertension remains unclear.
Therefore, we investigated the effect of the HDAC inhibitor, trichostatin A (TSA), on blood pressure in aortic coarctation hypertensive rats and on Ang II-induced vasoconstriction and its underlying mechanisms in rat aortas and vascular smooth muscle cells (VSMCs).
Go to : 
METHODS
Reagents
TSA, valsartan, PD123319, and Ang II were obtained from Sigma-Aldrich (St. Louis, MO, USA). The following antibodies were used: phospho-ser36-p66shc (Calbiochem, La Jolla, CA, USA), Shc (BD Biosciences, Franklin Lakes, NJ, USA), and β-actin (Santa Cruz Biotechnology, CA, USA). Lipofectamine 2000 was purchased from Life Technologies (Carlsbad, CA, USA) and a chemiluminescence kit from Amersham Pharmacia Biotech (Piscataway, NJ, USA).
Cell culture
Rat VSMCs were isolated from Sprague Dawley rats [12]. The aorta was removed under sterile conditions and the adventitia was removed. The aorta was minced and digested in 5 mL digest solution (1 mg/mL collagenase, 0.1% bovine serum albumin) at 37℃ for 30 min. Purification of VSMCs was confirmed by positive immunocytochemistry staining for α-smooth muscle actin using a commercial kit (Sigma-Aldrich). Human embryonic kidney 293 T cells were purchased from the American Type Culture Collection (Manassas, VA, USA). Cells were grown in Dulbecco-modified Eagle medium (DMEM, Life Technologies) with 10% fetal bovine serum, 10 U/mL penicillin, and 10 µg/mL streptomycin.
Transient transfection of angiotensin receptor subtypes
Plasmids containing AT1R cDNA (NM_04835) and AT2R cDNA (NM_000686) were purchased from Origene (Rockville, MD, USA). Human full-length AT1R cDNA and AT2R cDNA was subcloned into pCMV-Tag2A or pEGFP plasmids, which were verified via sequencing. HEK293T cells were transfected with AT1R or AT2R (1 µg/well) using lipofectamine 2000 according to the manufacturer's protocol.
Animal studies
Male Sprague Dawley rats (5~6 week-old and weighing 200~250 g, n=20) were purchased from Samtako, Inc. (Osan, Korea) and housed in accordance with the guidelines of the Institutional Animal Care and Use Committee (IACUC) of the Chungnam National University. All animal experiments were approved by the IACUC. Rats were randomly assigned to the abdominal aortic coarctation and sham-operated control groups. In brief, after anesthesia via intraperitoneal injection of a mixture of ketamine (80 mg/kg) and xylazine (12 mg/kg), the abdomen was opened, a stainless wire (outer diameter, 0.34 mm) was placed on the site of the aorta between the right and left renal artery [11]. TSA (0.5 mg/kg/day) or vehicle (DMSO) was subcutaneously administered for 7 days. Rats were anesthetized with an intraperitoneal injection of a mixture of ketamine (80 mg/kg) and xylazine (12 mg/kg). Polyethylene tubing (PE-50) was inserted into the left common carotid artery and femoral artery and connected to a pressure transducer (Gould P23XL) and preamplifier (Grass Model PI-1, USA). The systolic, diastolic, and mean blood pressures were analyzed with the Chartpro software (ADInstruments, Colorado Springs, CO, USA).
Measurement of vascular contractility
The aortas were cut into rings of 2~3 mm in length. Each ring was connected to an isometric force transducer (MultiMyograph 610M, Danish MyoTechnology, Denmark), suspended in an organ chamber filled with 7.5 mL of Krebs buffer solution (NaCl 100 mM, KCl 4.7 mM, CaCl2 1.9 mM, MgSO4 1.2 mM, K2HPO4 1.03 mM, and NaHCO2 25 mM, pH 7.4) and aerated with 95% O2/5% CO2 [1314]. The isometric tension was recorded continuously. A high K+ (60 mM) solution was prepared by replacing NaCl with equimolar KCl. These solutions were saturated with a 95% O2/5% CO2 mixture at 37℃ and pH 7.4. Dose-response curves for Ang II treatment (1~100 nM) were obtained by cumulative Ang II application. Endothelial removal was confirmed by the absence of relaxation when acetylcholine (1 µM) was applied to aortic rings that contracted with 300 nM of phenylephrine. The contractions were expressed as a percentage of the pre-contracted tension obtained with a high K+ (60 mM) solution.
Detection of superoxide anion by lucigenin chemiluminescence
Dark-adapted lucigenin solution (5 µM) was prepared in aerated Krebs-HEPES buffer [15]. The aortic rings were immersed in the lucigenin solution and chemiluminescence was detected with a luminometer (Lumat, Bad Wildbad, Germany). The chemiluminescence signal was integrated over 2 min.
Western blotting
Forty micrograms of protein were separated on 7.5~10% SDS/PAGE gel and transferred onto polyvinylidene difluoride membranes. After blocking for 1 h in 5% skim milk solution, the membranes were incubated with specific antibodies to phospho-ser36-p66shc, Shc, and β-actin. Protein expression was detected using an enhanced chemiluminescence kit (Amersham Pharmacia Biotech) and quantified densitometrically using ImageQuant software (Molecular Dynamics, Sunnyvale, CA, USA).
Statistical analysis
All data are expressed as the means±S.E.M. A statistical evaluation was performed using one-way ANOVA, followed by a Turkey post-hoc test. A p-value of p<0.05 was considered statistically significant.
Go to :
RESULTS
Chronic treatment with TSA suppressed aortic coarctation-induced hypertension
We investigated the effect of TSA on blood pressure in sham and aortic coarctation-induced hypertensive rats. Systolic blood pressure (SBP), diastolic blood pressure (DBP), mean arterial pressure (MAP), and pulse pressure (PP) were significantly higher in aortic coarctation-induced hypertensive rats. Chronic treatment with TSA (0.5 mg/kg/day) for 7 days significantly reduced high arterial blood pressure induced by aortic coarctation (Fig. 1A). As shown in Fig. 1A, chronic treatment with TSA significantly reduced SBP in aortic coarctation rats (169.8±8.2 mmHg vs. 133.1±3.5 mmHg, p<0.05), but did not reduce SBP in sham rats (125.5±3.0 mmHg vs. 112.9±9.5 mmHg). Additionally, even though DBP and MAP were reduced in TSA-treated sham and aortic coarctation-rats, the anti-hypertensive effect of TSA in aortic coarctation rats was greater than that in sham-operated rats.
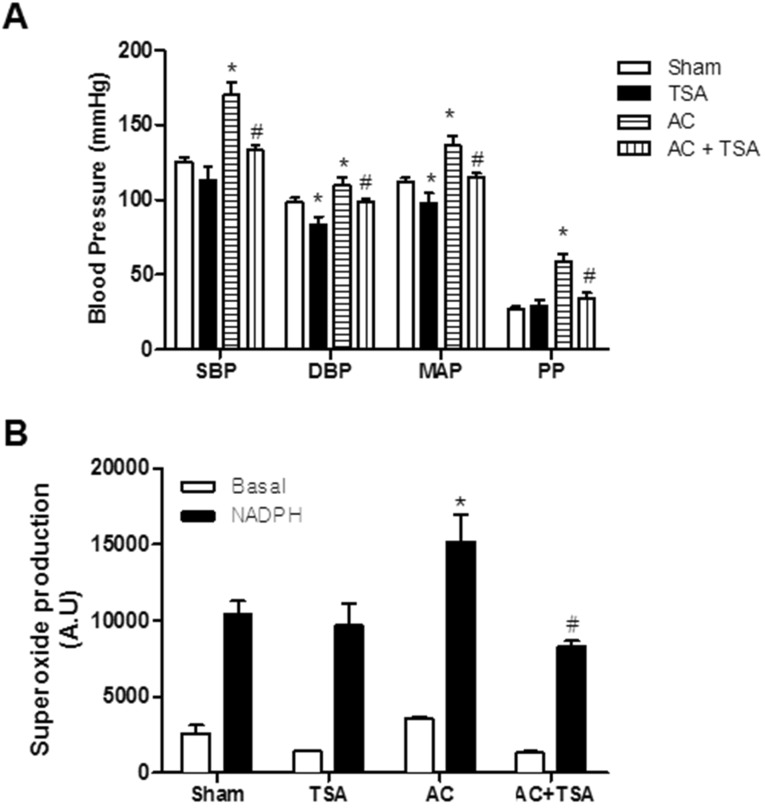 | Fig. 1Chronic treatment of trichostatin A (TSA) inhibited aortic coarctation-induced hypertension. (A) Effect of chronic TSA treatment on blood pressure in sham-operated and aortic coarctation rats. Animals were treated for 7 days by subcutaneously administration of vehicle (DMSO) or TSA (0.5 mg/kg/day). Bars represent the mean±S.E.M. (n=4 or 5) for systolic blood pressure (SBP), diastolic blood pressure (DBP), mean arterial pressure (MAP), and pulse pressure (PP). (B) Superoxide production in aortas of the abdominal aortic coarctation and sham-operated rats was determined by a lucigenin chemiluminescence assay. Bars represent the mean±S.E.M. (n=5 or 6). Basal and nicotinamide adenine dinucleotide phosphate (NADPH)-driven superoxide were measured in the aortas of the rats. NADPH (0.1 mM) was added to measure NADPH oxidase activity. Sham, sham-operated group; AC, aortic coarctation; TSA, TSA-treated sham-operated group; AC+TSA, TSA-treated aortic coarctation group. *p<0.05 (vs. sham group). #p<0.05 (vs. aortic coarctation group).
|
Chronic treatment with TSA inhibited aortic coarctation-induced superoxide production
Next, we examined whether TSA attenuates aortic coarctation-induced superoxide production. Superoxide production was measured in basal conditions and in nicotinamide adenine dinucleotide phosphate (NADPH)-treated rat aorta using a lucigenin chemiluminescence assay. Basal and NADPH-driven superoxide production was much higher in rats with aortic contraction than in sham-operated rats. However, chronic treatment with TSA (0.5 mg/kg/day) for 7 days significantly reduced NADPH-driven superoxide production induced by aortic coarctation. TSA had no effect on NADPH-driven ROS production in sham-operated rats (Fig. 1B).
TSA inhibited Ang II-induced vasoconstriction in isolated rat aortas
We investigated whether TSA influences Ang II-induced vasoconstriction in rat aortas. Aortic rings were pretreated with TSA (1~10 µM) for 15 min. As shown in Fig. 2A, TSA pretreatment inhibited Ang II-induced vasoconstriction in endothelium-intact aortic rings. The inhibitory activity of TSA on Ang II-induced vasoconstriction showed a dose dependency. Interestingly, TSA also inhibited Ang II-induced vasoconstriction in endothelium-rubbed aortic rings (Fig. 2B). The inhibitory action of TSA in endothelium-rubbed aortic rings was much greater than that for the intact endothelium, suggesting that TSA has mainly acted in VSMCs.
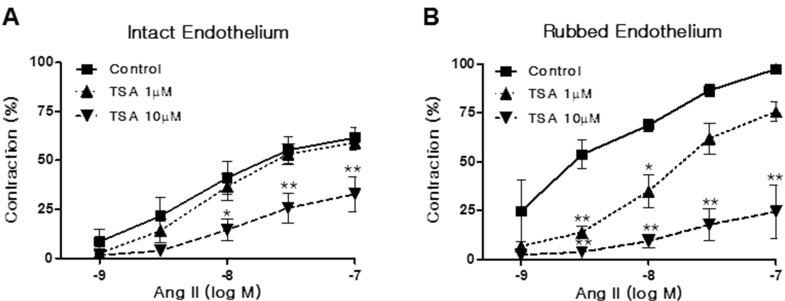 | Fig. 2Trichostatin A (TSA) inhibited angiotensin II (Ang II)-induced vasoconstriction in rat aorta. Vasoconstriction was evoked by Ang II treatment at doses between 1 and 100 nM in aortic rings with intact (A) or rubbed endothelium (B). Contraction was expressed as a percentage of the pre-contracted tension obtained with a high K+ (60 mM) solution. Each bar represents the mean±S.E.M. (n=6). Control: DMSO vehicle. *p<0.05 (vs. control), **p< 0.01 (vs. control).
|
AT1R was involved in p66shc phosphorylation
Activation of p66shc modulates the oxidative stress response and cellular survival. Circumstantial evidence suggests that activation of p66shc, which acts downstream of tyrosine kinase receptors, may be implicated in Ang II-induced cardiovascular alterations [16]. We therefore attempted to ascertain the Ang II receptor subtype is involved in p66shc activation in isolated rat VSMCs. As shown in Fig. 3, Ang II (100 nM) treatment led to increased phosphorylation of p66shc on serine 36, which was inhibited by the AT1R inhibitor, valsartan, but not by the AT2R inhibitor, PD123319. These data suggest that Ang II increases p66shc activation via AT1R in VSMCs.
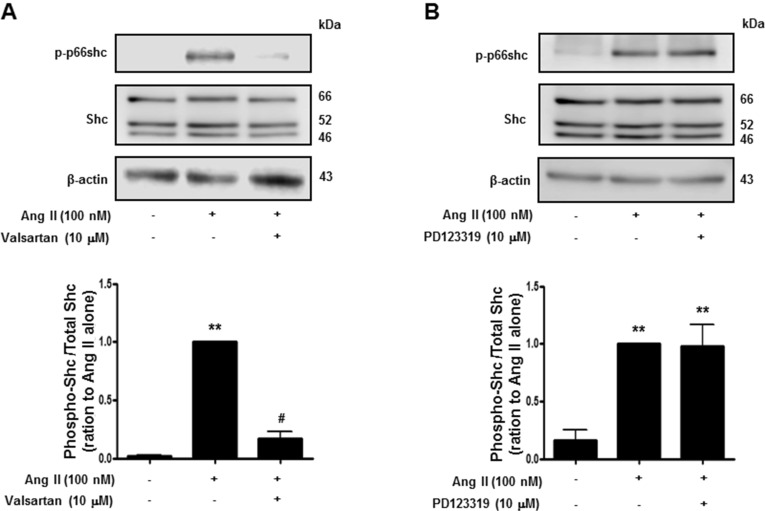 | Fig. 3Angiotensin II evoked p66shc phosphorylation in vascular smooth muscle cells. Cells were treated first with DMSO (control) or the indicated concentrations of valsartan (angiotensin II receptor type 1 inhibitor) (A), or PD123319 (angiotensin II receptor type 2 inhibitor) (B) for 30 min, and subsequently with 100 nM Ang II. Cell lysates were immunoblotted for phospho-p66shc, Shc, and actin. Densitometric scanning was performed to quantify the phosphop66shc/p66shc levels. Bars represent the mean±S.E.M. (n=4). **p<0.01 (vs. control), #p<0.01 (vs. only angiotensin II-treated cells).
|
TSA inhibited Ang II-induced p66shc phosphorylation
Next, we investigated the effect of TSA on Ang II-induced p66shc phosphorylation in VSMCs. Cells were pretreated with TSA (1~10 µM) for 15 min before Ang II (100 nM) was added for 30 min. As shown in Fig. 4, TSA (10 µM) significantly inhibited Ang II-induced p66shc phosphorylation in VSMCs. Finally, we proceeded to investigate whether TSA inhibited Ang II-induced p66shc activation in HEK293T cells ectopically expressing AT1R or AT2R. After transient transfection of HEK293T cells with EGFP-tagged AT1R and AT2R cDNA, the cellular localization of both proteins was observed via fluorescence microscopy (Fig. 5A). Both AT1R and AT2R were primarily localized on the plasma membrane as evidenced by a yellow-orange staining of the membrane due to overlap of green fluorescence (EGFP-tag) and red fluorescence (CellMask deep Red staining). Representative images showing EGFP-tagged AT1R or AT2R, CellMask deep Red, and DAPI staining in Ang II-treated HEK 293T cells are shown in Fig. 5A. In AT1R expressing cells, Ang II treatment resulted in the phosphorylation of p66shc, which was significantly inhibited by TSA (Fig. 5B). Interestingly, neither Ang II-mediated p66shc phosphorylation, nor its inactivation after TSA treatment, was observed in AT2R expressing cells (data not shown). These results indicate that p66shc activation in Ang II-mediated signal transduction occurs only through AT1R and is inhibited by TSA.
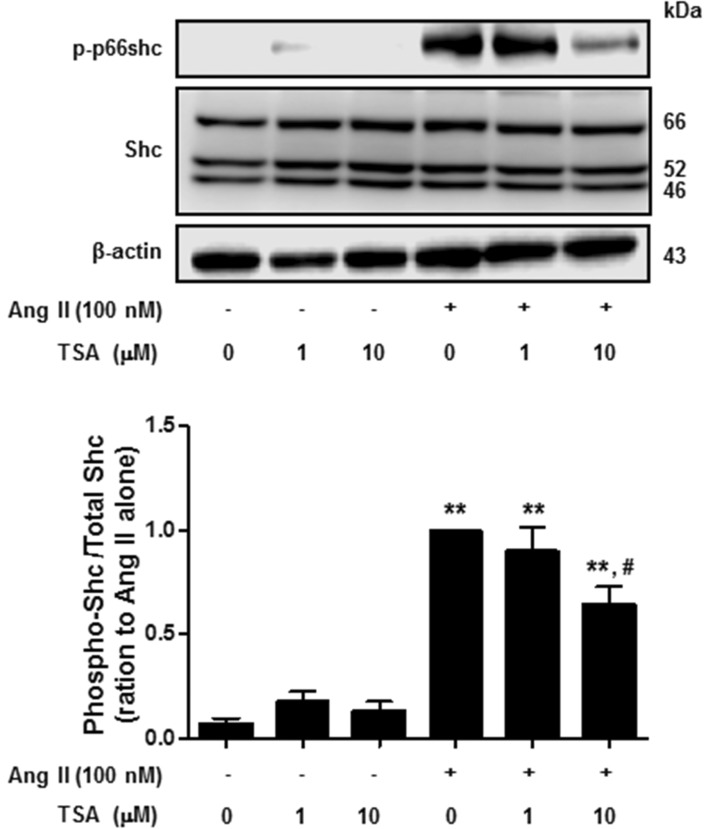 | Fig. 4Trichostatin A (TSA) inhibited angiotensin II-induced p66shc phosphorylation in vascular smooth muscle cells. Cells were exposed to 100 nM angiotensin II for 30 min, in the presence or absence of TSA. Western blotting was performed for phospho-p66shc, Shc, and actin. Bars represent the mean phospho-p66shc/p66shc levels±S.E.M. (n=3). **p<0.01 (vs. control), #p<0.01 (vs. only angiotensin II-treated cells).
|
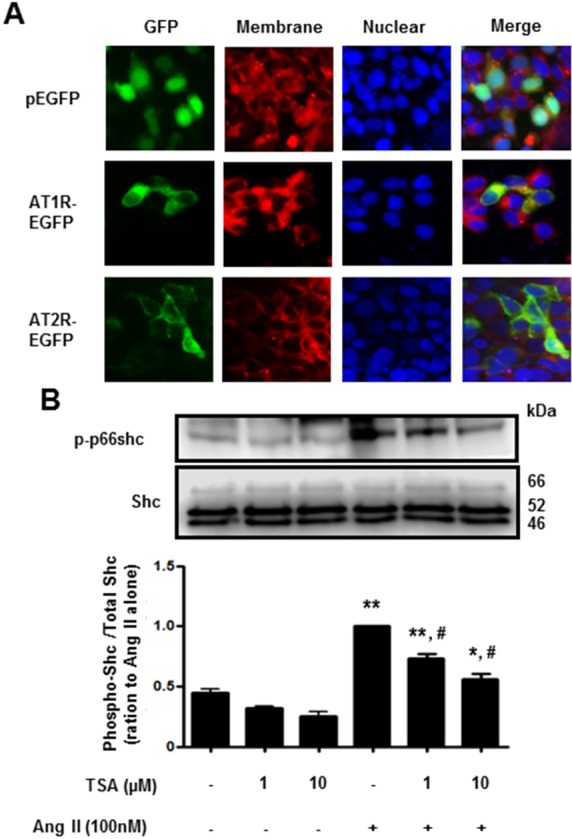 | Fig. 5Trichostatin A (TSA) inhibited angiotensin II-induced p66shc phosphorylation in HEK293T cells, ectopically expressing angiotensin II receptor type 1. (A) Fluorescence images of EGFP-tagged angiotensin II receptor type 1 or type 2 (×400 magnification). HEK293T cells were transfected with EGFP (upper), EGFP-tagged angiotensin II receptor type 1 (middle) or type 2 (lower). The plasma membrane was stained using CellMask Deep Red solution. (B) Cells expressing angiotensin II receptor type 1 were pretreated with either DMSO (control) or the indicated concentrations of TSA for 30 min. The cells were then either left untreated (DMSO), treated with TSA alone (controls), or exposed to 100 nM angiotensin II in the presence of TSA for 30 min. Western blotting was performed for phospho-p66shc and Shc. Bars represent the mean phospho-p66shc/p66shc levels±S.E.M. (n=3). **p<0.01 (vs. control), *p<0.05 (vs. control), #p<0.01 (vs. only angiotensin II-treated cells).
|
Go to :
DISCUSSION
Our study demonstrates that the HDAC inhibitor, TSA, modulates high blood pressure via inhibition of AT1R-mediated p66shc phosphorylation or of ROS production in vascular smooth muscle cells. HDACs mediate the expression of various genes by regulating the proteins involved in chromatin modulation. HDAC inhibition induces the epigenetic modification of genes such as histone acetylation and its intracellular acetylation regulates the ability of histones to bind to DNA. In addition, the acetylation of lysine residues of several other proteins influences its activity as an analogous mechanism, in which non-histone proteins are acted on by acetylases and deacetylases. HDACs are found to interact with a variety of non-histone proteins. There is growing evidence that HDAC inhibitors have potential therapeutic applications in various diseases such as cancer [17], immunological [18] or inflammatory diseases [19]. HDAC inhibitors also exert anti-hypertrophic effects in the heart [20]. TSA was the first natural hydroxamate found to inhibit HDACs [21]. In previous reports, TSA prevented the proliferation of VSMCs and neointimal hyperplasia induced by balloon injury in rat carotid arteries [22]. HDAC inhibition promoted mineralocorticoid receptor acetylation, leading to a decreased transcriptional activity of the mineralocorticoid receptor [23]. In the present study, chronic TSA treatment inhibited aortic coarctation hypertension in an animal model previously used to study the activation of the renin-angiotensin system after low renal perfusion pressure [24]. Recently, Li et al. reported that Ang II up-regulated prorenin receptor expression in cultured cells and hypertensive rats [25]. This result suggests that inhibition of the Ang II signaling via HDAC inhibition might inhibit renin receptor expression, resulting in anti-hypertensive effects. However, some reports indicate that HDAC inhibition increased renin expression in cultured renal cells [26] and renal mesenchymal cells [27]. The mechanisms underlying the anti-hypertensive effects of TSA are complex and not completely elucidated. Epigenetic regulation of Ang II and/or RAS-induced gene expression levels by HDAC inhibition requires further investigation. However, our data suggest that TSA influences the activation of the renin-angiotensin system.
TSA inhibited Ang II-induced vasoconstriction in rat aortas, suggesting that TSA has a vasorelaxing activity. Interestingly, TSA also inhibited Ang II-induced vasoconstriction in aortic rings with rubbed endothelium. This suggested that TSA mainly affects Ang II-induced signaling in VSMCs. TSA inhibited the signal transduction of Ang II and its receptor. Another possibility is that TSA increased intracellular acetylation, indirectly leading to vasorelaxation. It was recently shown that intracellular acetylation upon HDAC inhibition leads to increased cGMP levels in rat VSMCs and rat aortas [28]. This report showed an increase in global lysine acetylation of smooth muscle cell proteins, including those involved in the process of arterial wall contraction and relaxation. p300/CBP-associated factor (PCAF), also known as lysine acetyltransferase, is involved in the acetylation of a number of histone and non-histone proteins. PCAF increases myosin light chain and smooth muscle actin acetylation above the basal level, reducing actomyosin formation and resulting in reduced contractility [28]. Therefore, the anti-hypertensive or vasorelaxing effect of HDAC inhibitor might result in intracellular acetylation of proteins involved in Ang II signaling and may play a role in lowering blood pressure in aortic coarctation rats.
Adaptor protein p66shc is expressed in most mammalian tissues. p66shc-/- mice exhibit an increased resistance to oxidative stress and have a prolonged lifespan [3]. Previous reports show that Ang II induces p66shc upregulation in endothelial cells [811]. Genetic deletion of the p66shc adaptor protein protects from Ang II-induced myocardial damage [16]. HDAC inhibition reduced the production of ROS in cardiomyoblasts exposed to hypoxia/reoxygenation [29]. Recently, it was also shown that the intracellular increase of ROS levels following exposure to hydrogen peroxide was suppressed by TSA [30].
The main actions of Ang II are mediated via AT1R and AT2R. In isolated VSMCs, Ang II increased p66shc phosphorylation, which was inhibited by valsartan, a selective AT1R antagonist. These findings suggest that the AT1R signaling pathway mediates Ang II-induced p66shc activation. Our data also indicate that TSA inhibits Ang II-induced p66shc phosphorylation in VSMCs and in AT1R-expressing HEK293T cells. These data suggest that TSA inhibited AT1R-mediated p66shc activation, which is correlated to ROS production. Therefore, the inhibitory activity of TSA on Ang II-induced oxidative stress could contribute to vasorelaxation or to a decreased hypertension.
Go to :
 XML Download