

 PDF
PDF ePub
ePub Citation
 Print
Print


ABBREVIATIONS
IBD
intestinal bowel disease
UC
ulcerative colitis
ROM
reactive oxygen metabolites
TNBS
2,4,6-trinitrobenzenesulfonic acid
TNF-α
tumor necrosis factor-α
MDA
malondialdehyde
MPO
myeloperoxidase
NO
nitric oxide
GSH
tripeptide glutathione
EIE
extract including eupatilin
QGC
quercetin-3-O-β-D-glucuronopyranoside
EIQ
extract including QGC
CMC-Na
sodium carboxymethylcellulose
5-AS
5-aminosalicylic acid
HETAB
hexadecyl trimethyl ammonium bromide
BSA
bovine serum albumin
TBARS
thiobarbituric acid reactive substances
TCA
trichloroacetic acid
GST
glutathione S-transferase
INTRODUCTION
Inflammatory bowel disease (IBD) is a group of immune-mediated chronic intestinal disorders that include Crohn's disease and ulcerative colitis (UC). IBD is characterized by rectal bleeding and diarrhea resulting in disruption of the epithelial barrier, and formation of mucosal ulcer [1,2]. It is generally accepted that the pathological process involves infiltration of neutrophils and overexpression of pro-inflammatory mediators such as reactive oxygen metabolites (ROM), and cytokines that contribute to a cascade of inflammatory events [3].
Intra rectal instillation of 2,4,6-trinitrobenzenesulfonic acid (TNBS) causes severe colonic inflammation and is commonly used as a model of Crohn's disease and UC [4]. One of the earliest events in TNBS-induced colitis is the development of an abnormal immune response, which is mediated predominantly by activated mast cells and leukocytes, especially neutrophils, and is characterized by enhanced formation of reactive oxygen and nitrogen species [5,6]. Tumor necrosis factor-α (TNF-α) is known to be involved in IBD [7,8], and also plays a role in experimental models of IBD such as TNBS-induced colitis [9].
ROMs produced and released by immune cells also play an important role in the pathophysiology of UC. The colonic content of malondialdehyde (MDA), a major product of lipid peroxidation, is increased in both IBD patients and experimental animal models [10]. Increases in myeloperoxidase (MPO) activity, and the subsequent generation of nitric oxide (NO), have also been demonstrated in biopsies of inflamed colon and both are related to the progression of the disease [11,12]. Excessive NO production can accelerate the progression of UC.
The increase in highly toxic ROS may exceed the limited antioxidant defense system of the intestines, thereby contributing to intestinal injury in UC patients [13,14]. The tripeptide glutathione (GSH) is the most important intracellular defense against oxidative stress and is essential for both the functional and structural integrity of the gut. GSH is often depleted during inflammation, and GSH-deficient mice show severe degradation of the colonic mucosa, develop diarrhea, and lose body weight [15].
The aerial parts of the Artemisia asiatica plant has been frequently used in traditional medicine in Republic of Korea for the treatment of diseases such as abdominal pain, bloody diarrhea, internal bleeding and gynecological disorders. The extract including eupatilin (EIE) is an ethanol extract of the dried aerial parts of Artemisiae herba, and has been reported to possess anti-oxidant and anti-inflammatory activities, and exert a mucoprotective action by increasing mucus production and prostaglandin E2 secretion [16]. The chemical structure of eupatilin is shown in Fig. 1 and EIE is now on the market in Republic of Korea.
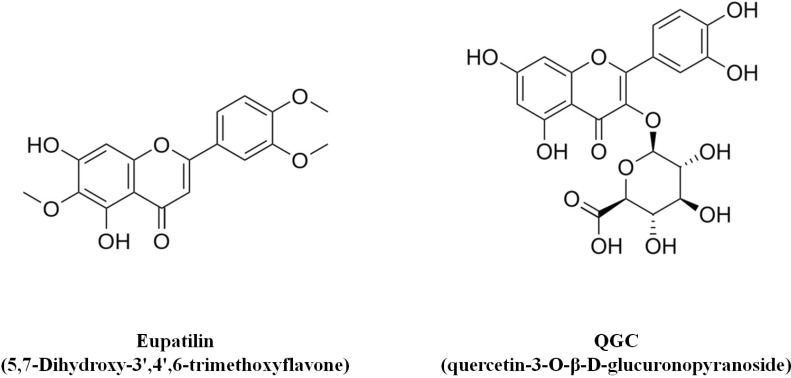
Recent study demonstrated that administration of quercetin-loaded microcapsules alleviated experimental colitis in mice [17]. Rumex aquaticus is a plant of the polygonaceae family and is used in traditional oriental medicine as a disinfectant, anti-diarrhea, and anti-pyretic drug, as well as for the treatment of edema, jaundice and constipation [18]. In a previous study performed by our group, the flavonoid quercetin-3-O-β-D-glucuronopyranoside (QGC) was shown to have a more potent effect than quercetin on inhibition of experimental reflux esophagitis [19]. QGC is contained in ethanol extracts from Rumex aquaticus herba (extract including QGC; EIQ) and in a previous study, EIQ exhibited a protective effect on gastric damage and reflux esophagitis [20,21]. The chemical structure of QGC is shown in Fig. 1.
The present study was conducted to investigate the anti-inflammatory effect of EIE and EIQ in the TNBS animal models of IBD. To do so, we examined the colon morphology and measured levels of anti-inflammatory mediators including MPO, GSH, NO, TNF-α, and MDA in colonic extracts from animals treated with EIE and EIQ.
Go to : 
METHODS
Materials
EIQ was kindly supplied by Prof. Whang (Herb Medicine Laboratory, Chung-Ang University, Seoul, Korea) and was dissolved in distilled water for animal treatments. 2,4,6-Trinitrobenzene sulfonic acid (TNBS), sodium carboxymethylcellulose (CMC-Na), 5-aminosalicylic acid (5-AS), EDTA, EGTA, urethane, hexadecyl trimethyl ammonium bromide (HETAB), hydrogen peroxidase, dimethylformamide were purchased from Sigma (St.Louis, MO, USA). EIE was kindly provided by Dong-A Pharmaceutical Co. Ltd (Yong-In, Korea) and was dissolved in CMC-Na for animal treatments. TNF-α and NO assay kits were purchased from Cayman Chemical (Ann Arbor, MI, USA).
Animals
Male Sprague-Dawley rats weighting between 180 and 200 g were supplied by Samtako Bio (Osan, Korea). The animals were group-housed in cages with wire-net floors in a room controlled for temperature (24~25℃) and humidity (70~75%) and were fed a normal laboratory diet (Samtako Bio). Rats were fasted for 24 h prior to the induction of colitis, but were allowed free access to tap water throughout. For experiments, animals were randomized into groups of n=6. The experiments were performed in accordance with the guidelines of the Institutional Animal Care and Use Committee of the Institute of Chung-Ang Pharmaceutical Science (Chung-Ang University, Seoul, Republic of Korea).
Induction of colitis and treatments
Colitis was induced according to the procedure described by Morris et al. [22]. Following a 24 h fast, rats were anesthetized with and intra peritoneal injection of urethane (0.5 g/ml) and a medical-grade polyurethane cannula (external diameter, 2 mm) was inserted into the anus and advanced to 8 cm proximal to the anal verge. TNBS was dissolved in ethanol (50% v/v) at 120 mg/ml and 0.25 ml was instilled into the colon through the cannula to induce acute colitis. Following instillation, the animals were maintained in a head-down position for 2~3 min to prevent leakage of the instillation. A normal control group received 0.9% saline in place of TNBS. EIE was suspended in 0.5% CMC-Na and EIQ were orally administered at the doses indicated in the Results section in a volume of 2 ml/kg body weight. Animals were dosed 48, 24, and 1 h prior to the TNBS instillation and then again 24 h later. Animals were sacrificed 48 h after induction of colitis. As a positive control, one group of TNBS-treated animals received 25 mg/kg 5-aminosalicylic acid (5-AS) in a volume of 2 ml/kg. Rats in a normal control group received 0.9% saline by intra colonic route in place of TNBS solution in a comparable volume. All rats were monitored daily for behavior, body weight, and stool consistency.
Assessment of colitis
The severity of colitis was evaluated by an independent observer who was blinded to the treatments. Animals were sacrificed 48 h after TNBS instillation. The distal 10-cm portion of the colon was removed and cut longitudinally, rinsed in physiological saline to remove fecal residue, and weighed. Macroscopic inflammation scores were assigned based on morphological features of the colon (score 0~10), the presence of adhesions (score 0~2), and stool consistency (score 0~1) according to the criteria of Bobin-Dubigeon et al. [9]. Pieces of inflamed colon were collected and frozen at -80℃ until measurements of biochemical parameters.
Assessment of leukocyte involvement
The MPO assay was modified from previously described method [23]. An 1 ml aliquot of leukocyte suspension from extracted from colon was centrifuged at 600 g at 4℃ for 7 min. The pellet was suspended in 1 ml of 80 mM sodium phosphate buffer, pH 5.4, containing 0.5% (wt/v) hexadecyl trimethyl ammonium bromide (0.5% HETAB), sonicated and centrifuged at 12,000 g at 4℃ for 15 min. Duplicate 30 µl samples of the resulting supernatant were aliquoted into wells of a 96-well micro titer plate. The reaction was stopped by adding 30 µl of 1.46 M sodium acetate, pH 3.0 to each well. MPO activity was calculated by measuring the absorbance of samples at 620 nm and comparing to a MPO standard.
Assessment of nitric oxide production
The concentration of nitrite, an indicator of NO production, was measured in the supernatants of colonic tissue homogenized (TMZ-20DN homogenizer, Taemin, Korea) with PBS, pH 7.2, containing 1% (wt/v) bovine serum albumin (BSA). Equal volumes of homegenate and Griess reagent (1% sulphanilic in 5% phosphoric acid and 0.1% N-[1-naphtyhl]-ethylendiamine dihydrochloride) were mixed and the absorbance was read at 450 nm. NO levels were assayed with a quantitative nitric oxide assay kit (Cayman Chemical, Ann Arbor, MI, USA).
Assessment of total GSH levels
The total GSH content of colonic tissue was determined using a modification of the method of Beutler et al. [24]. A mitochondrial fraction was prepared. Samples were added to metaphosphoric acid and allowed to stand for 5 min to precipitate proteins. Phosphate buffer and 5'5-dithiobis-2-nitro-benzoic acid were added for color development. GSH was determined by measuring absorbance at 415 nm and absolute concentrations were calculated using a GSH standard (Sigma).
TBARS assay
Lipid peroxidation was determined according to the method of Buege and Aust, by measuring the formation of thiobarbituric acid reactive substances (TBARS) spectrophotometrically. Colonic tissues were collected, homogenized in PBS (pH 7.0). The samples were centrifuged at 12,000 g at 4℃ for 15 min then 0.3 ml supernatant was removed and mixed with 0.9 ml of 8% trichloroacetic acid (TCA). The sample was again centrifuged at 10,000 g at 4℃ for 5 min. An 1 ml aliquot of supernatant was added to 0.25 ml of 1% TBA, and the resulting solution was heated at 100℃ for 20 min. The tube was cooled, 2 ml of n-butanol was added, and the tube was vortexed for 90 sec. After centrifugation at 3,000 g at 4℃ for 5 min, 1 ml of the n-butanol phase was removed and used in the TBARS assay. Finally, the absorbance at 532 nm was measured and MDA content was calculated with MDA standards.
Protein determination
Protein concentrations were measured spectrophotometrically using the Bio-Rad assay kit (Bio-Rad Chemical Division, Richmond, CA). Absorption was monitored at 595 nm.
Data analysis
The data are expressed as the means±S.E.M. Statistical differences between means were analyzed by the Student's t-test, with p<0.05 considered significant.
Go to :
RESULTS
Therapeutic efficacy of EIE and EIQ in and experimental TNBS-induced colitis model
Physical differences in rats were evident 48 h after intra colonic instillation of TNBS. Animals receiving only TNBS showed prostration, pilo erection and hypo motility, and lost significantly more body weight than control animals (Table 1).
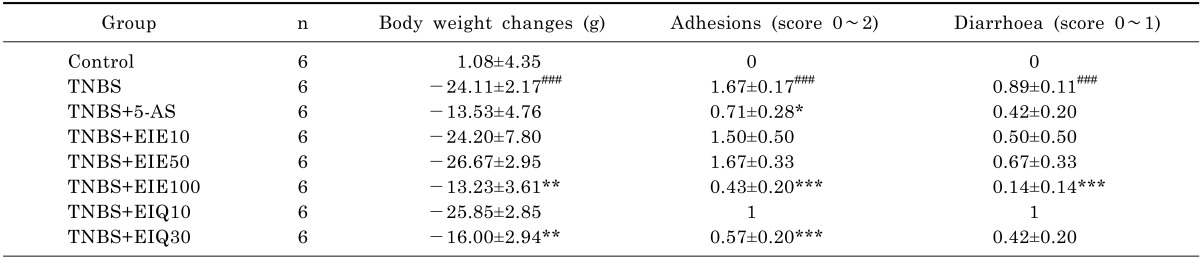
The presence of adhesions to adjacent organs, as well as diarrhea, was frequently observed in TNBS-treated rats (Table 1). Macroscopic inspection of the cecum, colon, and rectum of TNBS-treated animals showed evidence of severe colonic mucosal damage, with edema, deep ulceration and hemorrhage (Fig. 2).
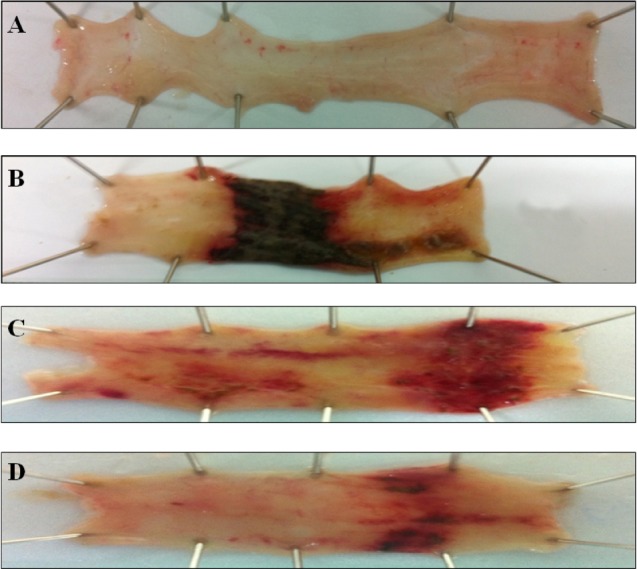 | Fig. 2Effect of EIE and EIQ administration on colonic injury in rats with TNBS-induced acute colitis. The image show representative colonic tissues from the in normal control group (A), TNBS and no treatment group (B), TNBS and EIE 100 mg/kg group (C), and TNBS and EIQ 30 mg/kg (D). TNBS lesions are characterized by focal ulceration, and treatment with the flavonoid glycosides EIE and EIQ reduced the severity of the lesions.
|
The macroscopic changes in the distal colon were also quantified (Fig. 3).
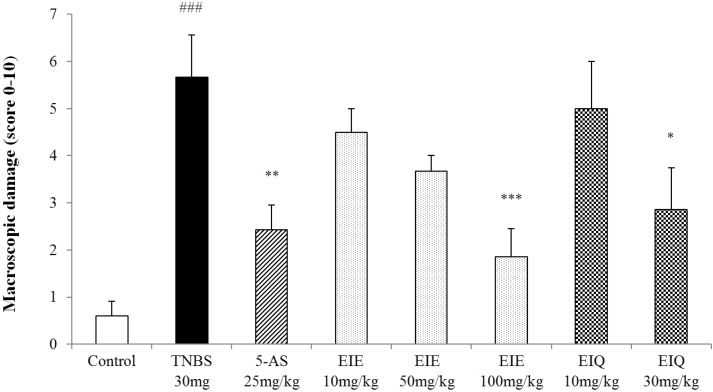 | Fig. 3Effect of acute administration of EIE, and EIQ on macroscopic colon damage in rats with TNBS-induced acute colitis. Macroscopic damage to the colon resulting from TNBS was scored on a scale of 0 to 10. EIE and EIQ dose-dependently diminished the macroscopic scores. The data are expressed as mean±S.E.M. ###p<0.001 vs. the control group and *p<0.05, **p<0.01 and ***p<0.001 vs. the TNBS alone group.
|
TNBS-treated rats also had significantly increased colon weight/length ratios (Fig. 4), an indicator of inflammation.
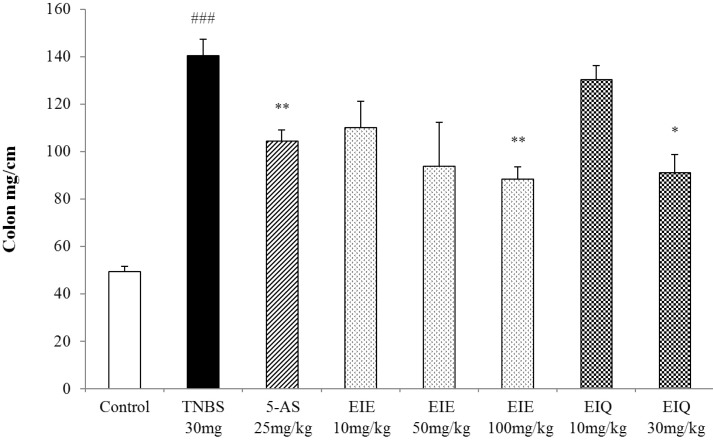 | Fig. 4Effect of EIE and EIQ administration on the colon weight to length ratio in rats with TNBS-induced acute colitis. Colon weight to length ratios were dose-dependently decreased by administration of EIE and EIQ. The data are expressed as mean±S.E.M. ###p<0.001 vs. the control group and *p<0.05 and ***p<0.01 vs. the TNBS alone group.
|
Treatment of animals with EIE (100 mg/kg) or EIQ (30 mg/kg) significantly reduced the loss in body weight, the presence of adhesions to adjacent organs, and diarrhea (Table 1). Administration of 5-AS also decreased the presence of adhesions compared with TNBS-treated animals. The ratio of colon weight/length was decreased significantly in rats treated with EIE (100 mg/kg) and EIQ (30 mg/kg) (Fig. 4).
The highest doses of EIE and EIQ also attenuated the extent and severity of colonic injury, as reflected in the lower macroscopic scores (Fig. 3).
The effects of EIE and EIQ on MPO activity in TNBS-induced colitis
In the initial inflammatory process in colitis, tissue damage caused by ROS or other factors induces infiltration of MPO-positive neutrophils. Thus, measurement of MPO activity can be used to quantitate neutrophil infiltration. MPO activity was significantly increased 48 h after instillation of TNBS compared with levels in control animals (Fig. 5).
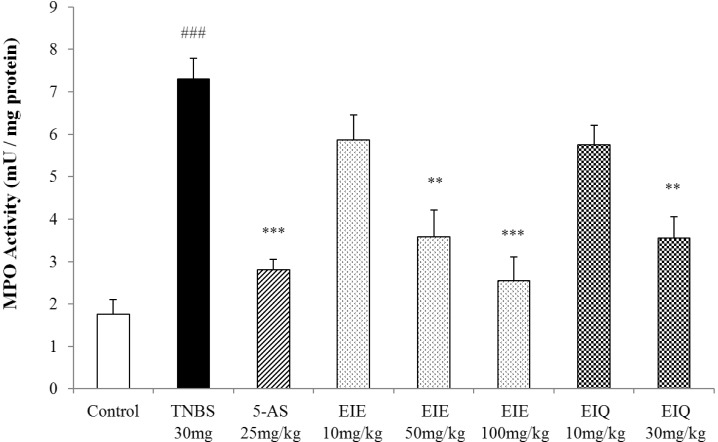 | Fig. 5Effect of EIE and EIQ administration on MPO activity in rats with TNBS-induced acute colitis. MPO activity was significantly increased by TNBS instillation compared with control group. However, MPO activity was significantly decreased by EIE (50 and 100 mg/kg) and EIQ (30 mg/kg). The data are expressed as mean±S.E.M. ###p<0.001 vs. the control group and **p<0.01 and ***p<0.001 vs. the TNBS alone group.
|
Treatment of animals with EIE and EIQ significantly decreased MPO activity in a dose-dependent manner (EIE 50 and 100 mg/kg, EIQ 30 mg/kg). At doses of 50 and 100 mg/kg EIE, MPO activity was decreased by 51% and 63%, compared with the TNBS group. Similarly, treatment with 30 mg/kg EIQ reduced MPO activity to 52% of that observed in the control TNBS-treated group. Treatment with 5-AS reduced MPO activity to 62% of that observed in the TNBS group.
The effects of EIE and EIQ on nitric oxide expression in TNBS-induced colitis
The level of NO level in the colons of animals treated with TNBS was significantly increased compared with the normal control group (Fig. 6), and this was reversed by treatment with 5-AS. Treatment with EIE and EIQ (100 mg/kg and 30 mg/kg, respectively) also significantly inhibited nitrite production (Fig. 6).
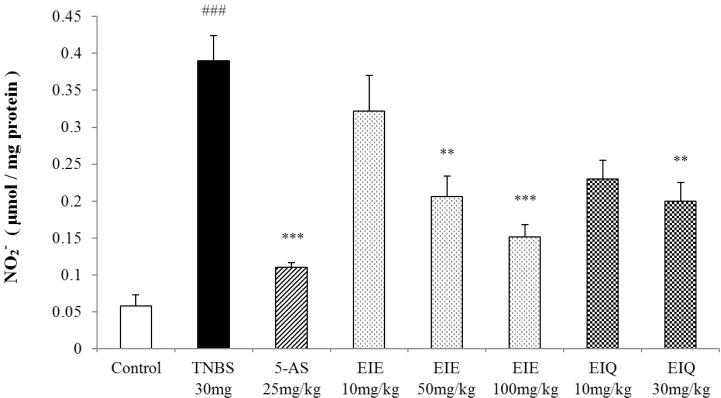 | Fig. 6Effect of EIE and EIQ administration on NO production with TNBS-induced colitis. After TNBS instillation, nitrite production was significantly increased compared with the control group. However, NO production was significantly decreased with EIE (50 and 100 mg/kg) or EIQ (30 mg/kg). The data are expressed as mean±S.E.M. ###p<0.001 vs. the control group and **p<0.01 and ***p<0.001 vs. the TNBS alone group.
|
The effects of EIE and EIQ on colonic TNF-α expression in TNBS-induced colitis
Colonic injury by acute TNBS administration was characterized by a significant increase of the pro-inflammatory Th1 cytokine TNF-α over the level seen in the normal control group. Treatment with EIE and EIQ caused a clearly dose-dependent reduction in TNF-α levels, although a statistically significant effect was observed only at the highest doses (100 mg/kg EIE, 30 mg/kg EIQ). EIE and EIQ reduced TNF-α level by 61% and 32% compared with the TNBS group (Fig. 7).
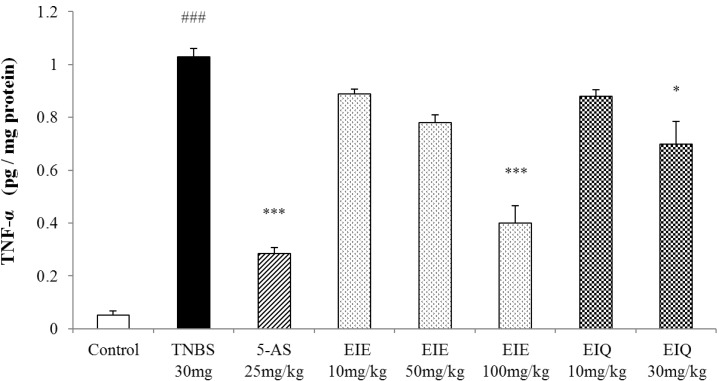 | Fig. 7Effect of EIE and EIQ administration on TNF-α expression in rats with TNBS-induced acute colitis. After TNBS instillation, TNF-α expression was significantly increased compared with the control group. However, TNF-α expression was significantly decreased by EIE (100 mg/kg) and EIQ (30 mg/kg). The data are expressed as mean±S.E.M. ###p<0.001 vs. the control group and *p<0.05 and ***p<0.001 vs. the TNBS alone group.
|
The effect of EIE and EIQ on total GSH levels in TNBS-induced colitis
Instillation of TNBS causes colonic injury and increases MDA levels. To rebalance the intracellular redox state, GSH is oxidized with toxic lipids or H2O2 through the action of glutathione S-transferase (GST). Animals with TNBS-induced colitis had 54% reduction in GSH levels in the colon compared with the normal control animals (Fig. 8). However the GSH levels were restored by treatment of rats with EIE and EIQ. At doses of 50 and 100 mg/kg EIE, and 30 mg/kg EIQ, the GSH levels were restored by 35%, 84%, and 54% respectively, compared with the TNBS-treated group. Treatment of animals with 5-AS restored the GSH levels by 82%.
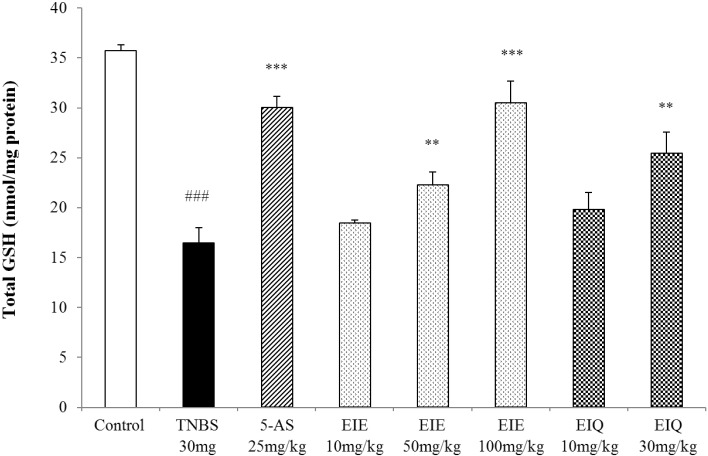 | Fig. 8Effect of EIE and EIQ administration on GSH levels in rats with TNBS-induced acute colitis. After TNBS instillation, total GSH levels were significantly decreased compared with the control group. However, GSH levels were significantly increased by administration of EIE (50 and 100 mg/kg) and EIQ (30 mg/kg). The data are expressed as mean±S.E.M. ###p<0.001 vs. the control group and **p<001 and ***p<0.001 vs. the TNBS alone group.
|
The effects of EIE and EIQ on MDA levels in TNBS-induced colitis
When colonic tissues are damaged by TNBS instillation, the increased reactivity of ROS with lipids leads to a significant increase in MDA levels. MDA levels were measured in the TNBS-treated rat colons as an indicator of lipid peroxidation. Compared with the untreated control animals, TNS instillation caused a significant increase in MDA, which was inhibited in a dose-dependent manner by treatment with EIE and EIQ (Fig. 9). Treatment of rats with 50 and 100 mg/kg EIE significantly decreased the MDA levels respectively. Similarly, animals treated with 10 and 30 mg/kg EIQ showed a reduction in MDA respectively. Treatment of animals with 5-AS decreased the MDA levels.
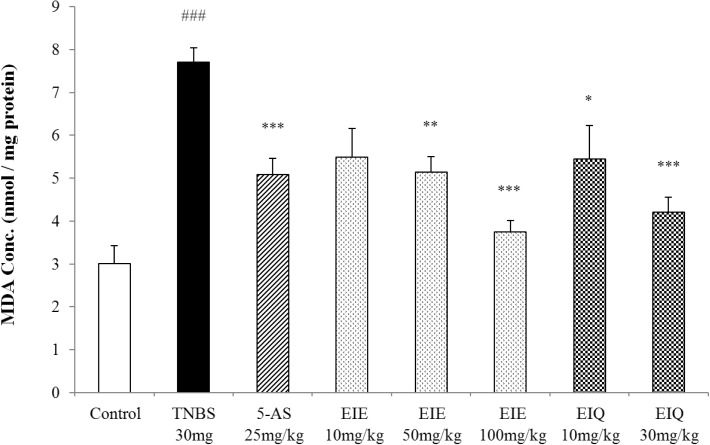 | Fig. 9Effect of EIE and EIQ administration on MDA levels in rats with TNBS-induced acute colitis. After TNBS instillation, MDA levels were significantly increased compared with control group. However, MDA was significantly decreased by administration of EIE (50 and 100 mg/kg) and EIQ (10 and 30 mg/kg). The data are expressed as mean±S.E.M. ###p<0.001 vs. the control group and *p<0.05, **p<0.01, and ***p<0.001 vs. the TNBS alone group.
|
Go to :
DISCUSSION
We found that treatment with 100 mg/kg EIE and 30 mg/kg EIQ significantly ameliorated colonic lesions and attenuated neutrophil infiltration, production of the pro-inflammatory cytokine TNF-α, and generation of the lipid peroxidation product MDA. In addition, EIE and EIQ increased levels of GSH, the intracellular defense against oxidative stress.
Infiltration of leukocytes into the mucosa has been suggested to contribute significantly to the tissue necrosis and mucosal dysfunction associated with colitis [25], because leukocytes are a major source of reactive oxygen radicals in the inflamed colon mucosa [23,26]. Quantitatively, the main free radical in tissues is superoxide anion (O2-), which is converted to the secondary oxidant H2O2 by superoxide dismutase. In our experiments, MPO activity was significantly increased by TNBS, indicating that neutrophil-derived free radicals were likely involved in the pathogenesis of TNBS-induced colon injury. However, colons from animals treated with 100 mg/kg EIE and 30 mg/kg EIQ and killed 48 h after TNBS instillation showed significantly lower MPO activity than animals treated with vehicle. These data were consistent with the histological findings that EIE and EIQ reduced the gross lesions in the colon, and suggest that the compounds have potent anti-inflammatory activity in this model of colitis. In this context, previous reports have shown that certain flavonoids have anti-inflammatory action [27,28], and can inhibit leukocyte adhesion to the endothelial layer and subsequent migration into the interstitium [29].
It is interesting to note that in our study the severity of the TNBS-induced colon damage was associated with the increase in TNF-α level. Our results are in line with previous reports indicating that upregulation of TNF-α production correlated with the development of colitis [26,30]. In our experiments, the level of TNF-α was significantly increased in animals killed 48 h after TNBS instillation, indicating that TNF-α released early in the inflammatory response is likely playing an important role in the pathogenesis of TNBS-induced colon injury. Notably, animals with TNBS-induced colitis that were treated with 100 mg/kg EIE or 30 mg/kg EIQ had TNF-α levels significantly lower than those in vehicle-treated animals.
Activated neutrophils produce reactive oxygen and nitrogen species within the intestinal mucosa, which increases oxidative stress and plays a significant role in the pathogenesis of IBD [31]. During experimental colitis, excessive production of ROMs in mucosal cells can initiate a cascade of inflammatory events that directly and indirectly damages the intestinal epithelial cells, which disrupts the integrity of the intestinal mucosa barrier [32].
MDA is a product of the lipid peroxidation that takes place as a consequence of colonic insult [33]. MDA causes cross-linking of protein and nucleic acid molecules and is thus cytotoxic. Many studies have demonstrated that colitis is associated with increased MDA levels in rats, and various agents used in the treatment of this disease can decrease levels of MDA in colonic tissues.
Because GSH deficiency is associated with severe injury such as inflammation and sepsis, treatment strategies that maintain GSH stores may decrease the incidence of organ failure. Depletion of GSH also induces formation of large lymphoid aggregates in the intestine by recruitment of lymphocytes from the peripheral circulation [34]. Depletion of tissue GSH has been implicated in the inflammatory process in IBD patients. Consistent with this, supplementation with GSH monoethylester has been reported to prevent these lymphoid aggregates [34]. Accordingly, administration of EIE and EIQ in the TNBS rat model attenuated the chemically induced acute colitis and increased mucosal levels of GSH, suggesting that GSH precursors may be of relevance in the acute relapse of IBD [35].
Reactive NO radicals play important roles in the pathogenesis of human IBD [36]. Many studies have indicated that excessive NO may exacerbate the pathological features of UC through mechanisms such as direct injury of gut epithelial cells, activation of neutrophils, and vasodilation [37]. In addition, NO can interact with superoxide and form the highly toxic peroxynitrite radical, which reversibly increases the expression of iNOS by activating NF-κB, and leads to a cycle of deleterious events [12]. These observations thus suggest that inhibition of excessive MDA and NO production by ROM inhibitors offers a promising approach for the treatment of IBD. Our study has demonstrated that EIE and EIQ significantly inhibit TNBS-colitis-associated production of NO and MDA, and restore total GSH levels in a dose-dependent manner.
The results suggest that the flavonoid compounds EIE and EIQ have protective effects in UC, and it is likely that their free radical scavenging and antioxidant properties are important to their mechanisms of action. In conclusion, Extracts including eupatilin and extracts including quercetin-3-β-D-glucuronopyranoside ameliorated the inflammatory response and colonic injury in experimental acute colitis by decreasing oxidative stress and neutrophil activation. Extracts including eupatilin and extracts including quercetin-3-β-D-glucuronopyranoside may inhibit acute colitis.
Go to :
 XML Download