INTRODUCTION
Ca
2+ is an essential element involved in initiating and controlling the excitation-contraction coupling process in cardiac myocytes. The predominant Ca
2+ source is trans-sarcolemmal Ca
2+ influx and SR Ca
2+ release [
123]. For many years, mitochondria were simply regarded as an ATP-generating factory. However, several recent reports showed that mitochondria participate in many other important processes, such as apoptosis, ischemic-reperfusion injury, aging, and other diseases [
45678]. All of those phenomena are related to Ca
2+ [
45678].
Several mechanisms of mitochondrial Ca
2+ regulation in cardiac myocytes were reported, including involvement of the mCU [
4679], RaM [
1011], the RyR [
1213], the mNCX [
14151617], and the CPX [
1819]. To date, their dynamics and quantitative roles in cardiac myocyte mitochondrial Ca
2+ regulation were unclear. Further, their exact working mechanism, molecular identity, and regulatory factors were unknown. The role of mitochondria in cytosolic Ca
2+ regulation in cardiac myocytes was controversial as well [
467920]. In order to study these issues, quantitative and real-time measurements of [Ca
2+]
m were required.
The [Ca
2+]
m range was reportedly 0.08 to 20 µM [
21222324]. The most frequently used fluoroprobe to determine this range was rhod-2. Rhod-2-AM has a positive charge, and therefore it may preferentially load into mitochondria because of the large negative potential of the mitochondrial matrix. However, rhod-2 has limitations regarding quantitative mitochondrial Ca
2+ measurement because it is not a ratiometric dye. In addition, rhod-2 can measure only up to several µM of Ca
2+ because its dissociation constant (K
d) ranged from 0.57 to 0.80 µM [
122526].
Fura-2 analogs are widely used for quantitative measurements of [Ca
2+]. The K
d value of Fura-2-FF was reportedly 18~35 µM in calibrating buffers [
2728293031] and 6~13 µM in cells [
2732]. However, this dye has potential usage problems due to NADH contamination and dye loading into mitochondria. Specifically, NADH contamination is a serious problem because most NADH is located in the mitochondria and because [NADH] change is related to mitochondrial membrane potential (Ψ
m), in turn, [Ca
2+]
m change [
33343536]. These problems have been ignored and no methods exist to avoid or overcome them.
In this report, we developed a novel online NADH correction method to measure [Ca2+]m quantitatively, as well as a method to simultaneously measure multiple parameters, including NADH, [Ca2+]m, and pH/Ψm.
Go to :

DISCUSSION
Interest in the ubiquitous role of Ca2+ in cells and cellular organelles is increasing. To study Ca2+ dynamics, the use of Ca2+ indicators has steadily increased. Mitochondria have now become a focus because of their role in many cellular processes, such as energy generation, apoptosis, ischemic-reperfusion injury in the heart, aging, etc. Ca2+ has a central role in these processes. However, quantitative and dynamic mitochondrial Ca2+ data are not yet available. For quantitative measurement of mitochondrial Ca2+, a ratiometric approach is essential. Ratiometric fluoroprobes are advantageous for quantitative measurement of [Ca2+] because dye loss due to leakage or photobleaching does not affect the calculation of [Ca2+]. These problems cannot be avoided when single excitation and single emission dyes are used to determine [Ca2+].
Fura-2 was first introduced in 1985 as a ratiometric fluorescent dye [
37]; several analogs were subsequently developed. However, Fura-2 has several disadvantages when used to measure mitochondrial Ca
2+. First, targeted dye loading into the mitochondria is not easy. Therefore, Fura-2 would likely be nonspecifically loaded into all organelles of the cell. One major Ca
2+-related organelle is the SR. However, the total SR and mitochondria percent volumes are about 3.5% and 34~36%, respectively, in rat ventricular myocytes [
4344]. Therefore, even though Ca
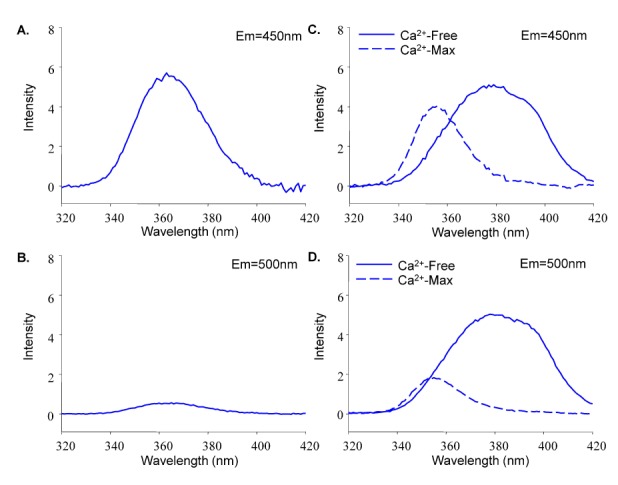
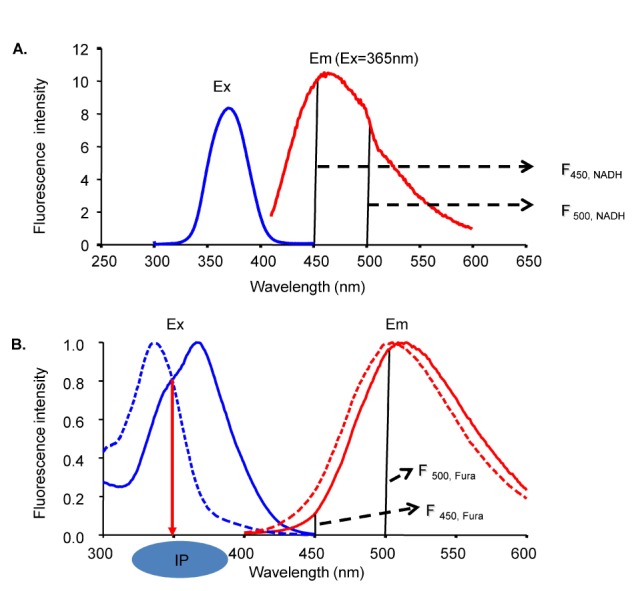
2+ in SR may affect the results, the effect would be negligible. Second, cellular autofluorescence from NADH could contaminate the Fura-2 signal. More than 90% of cellular NADH is present in the mitochondria (data not shown). Excitation and emission spectrums of NADH and Fura-2 widely overlap. Importantly, Ca
2+ changes in mitochondria could affect NADH, which, in turn, affects Fura-2 signals. Therefore, this complicated interference must be solved to quantitatively measure [Ca
2+]
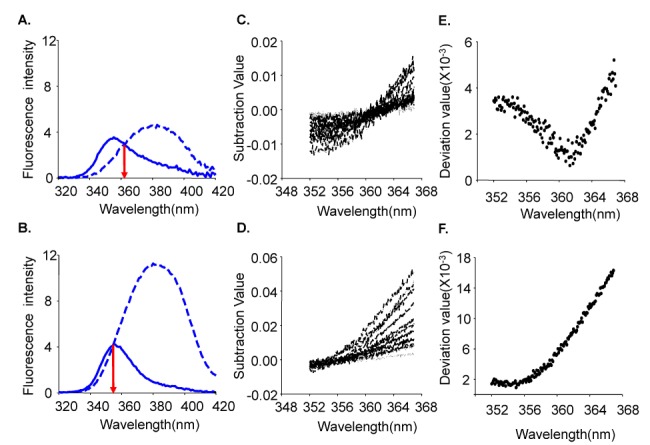
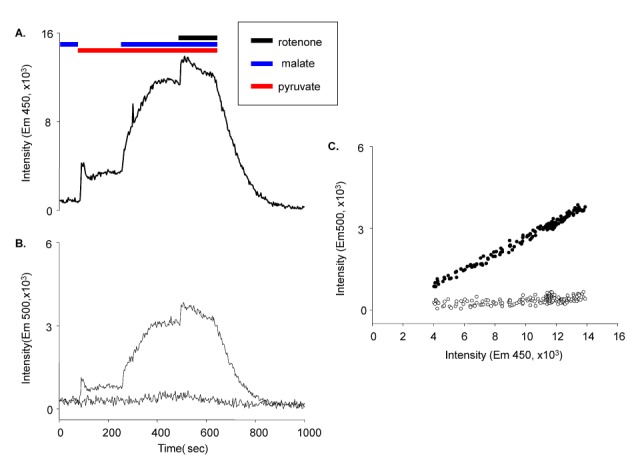
m. This problem, however, has not been systematically investigated since Fura-2 was introduced. We were able to successfully correct for the interference between NADH and Fura-2 using the spectral characteristics of NADH and Fura-2.
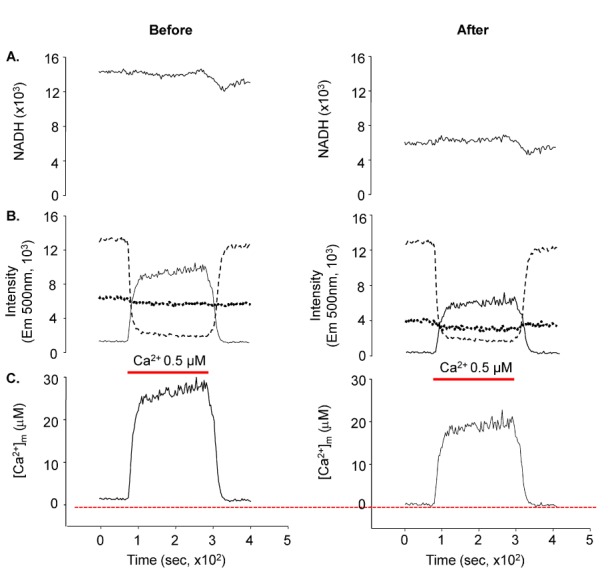
Fig. 8 shows the effect of NADH and Fura-2-FF interference. The NADH signal was considerably decreased after the correction (
Fig. 8). The corrected Fura-2-FF signal resulted in lower [Ca
2+]
m. This interference implied that data from previous reports using Fura-2 analogs could be wrong, as the NADH signal could be different based on the correction or lack thereof. We would like to further investigate this possibility in the future.
Our calibration equation (Equation 12) has many advantages over Grynkiewicz's equation. First, it only required three calibration parameters: Kd, F340,max/F400,max, and Rmin. Second, the ratio value was directly linear to the Ca2+ concentration at a constant pH. Therefore, the rate of ratio change could be directly converted to the rate of Ca2+ change. Third, obtaining the calibration parameters, particularly F340,max/F400,max, is relatively error-free. In Grynkiewicz's equation, F380,max/F380,min is prone to error because it divides the largest number by the smallest number. In addition, to obtain F380,max/F380,min, we had to accomplish real free- and saturated-[Ca2+] conditions because F380 must reach the real maximum and minimum values, respectively. If not, F380,max/F380,min can easily be faulty. However, in our new equation, the F340,max/F400,max measurement error is much smaller because it is the ratio of the largest numbers at each excitation. Fourth, as shown in Equation 13, when the isosbestic excitation value was chosen instead of 340 nm in the new equation, only Rmin is required to convert the ratio into the Ca2+ concentration if the pH was unchanged and the Kd value at that pH is known. Finally, the calibration procedure is much simpler, as Rmin is the only parameter needed.
However, there are limitations associated with use of the equation. The new equation was generated based on the assumption that the emission of Ca
2+-saturated Fura-2-FF was zero at 400-nm excitation. However, Ca
2+-saturated Fura-2-FF actually produces a small emission. This causes deflection from the linearity between the ratio and Ca
2+ concentration at very high Ca
2+ concentrations. We that found our equation could be reasonably applied to [Ca
2+]
m concentrations up to 50-fold that of the K
d. This range is reasonably acceptable under experimental conditions. The new equation still does not solve the problems of incomplete hydrolysis of the AM form of the dye, dye compartmentalization, autofluorescence, etc. Dye loading problems are inevitable, but careful loading and washing may minimize these kinds of errors (see Ref. [
45]). In the case of compartmentalization, mitochondria had the largest volume; therefore, this type of error could be ignored. We used a very careful loading procedure to minimize incomplete hydrolysis of the AM form; therefore, we believe that this error was also minimized.
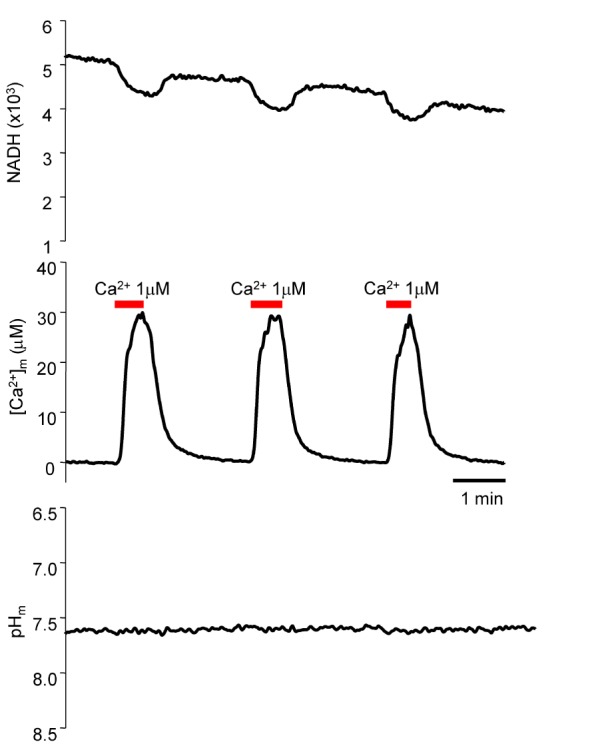
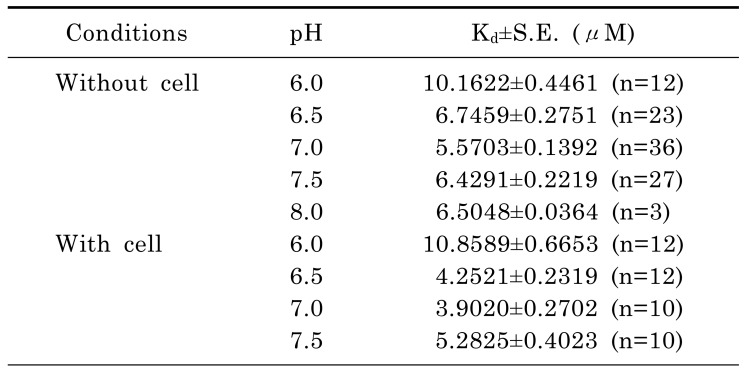
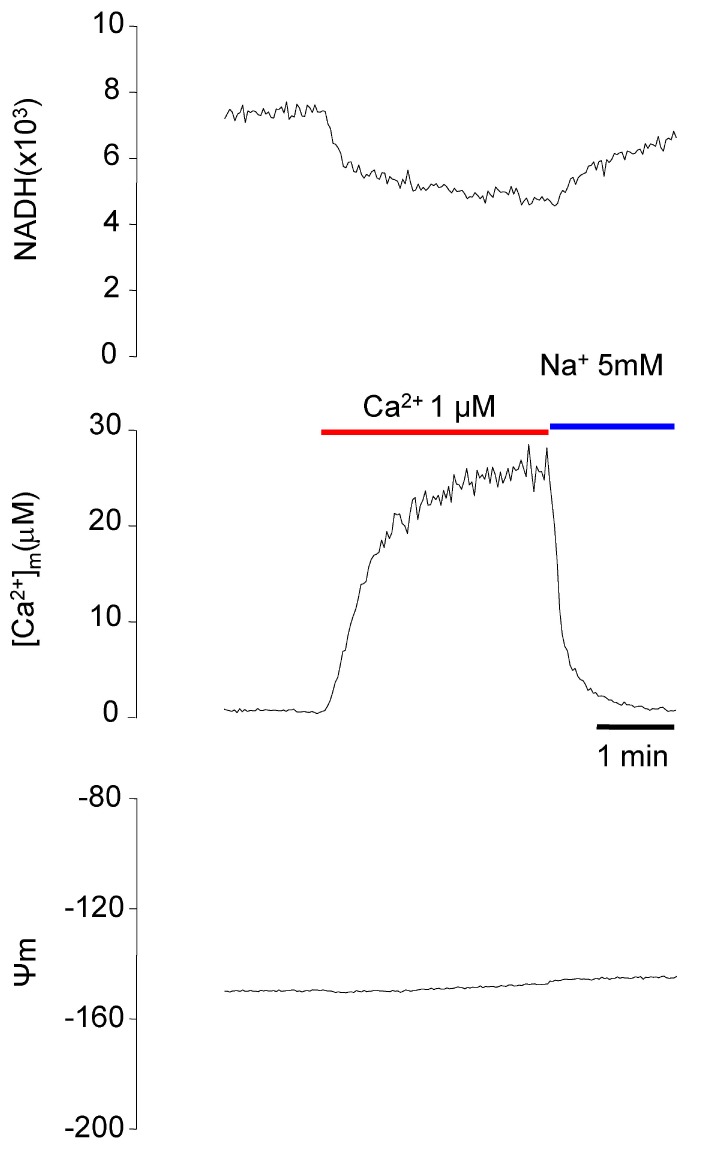
The Kd value of Fura-2-FF is pH dependent; therefore, if the procedure could cause changes in pH, we need to consider the pH effect when calculating [Ca2+]m. Cytosolic Ca2+ application increased [Ca2+]m, but the mitochondrial pH did not change. Therefore, the constant Kd at pH 7.5 was used to calculate [Ca2+]m.
Our microfluorometry system could measure NADH, [Ca
2+]
m, and pH
m simultaneously. In addition, the Ψ
m could be measured using TMRE because the excitation and the emission spectrum of TMRE overlapped with those of carboxy-SNARF-1. Therefore, we were able to successfully measure Ψ
m using TMRE (
Fig. 10).
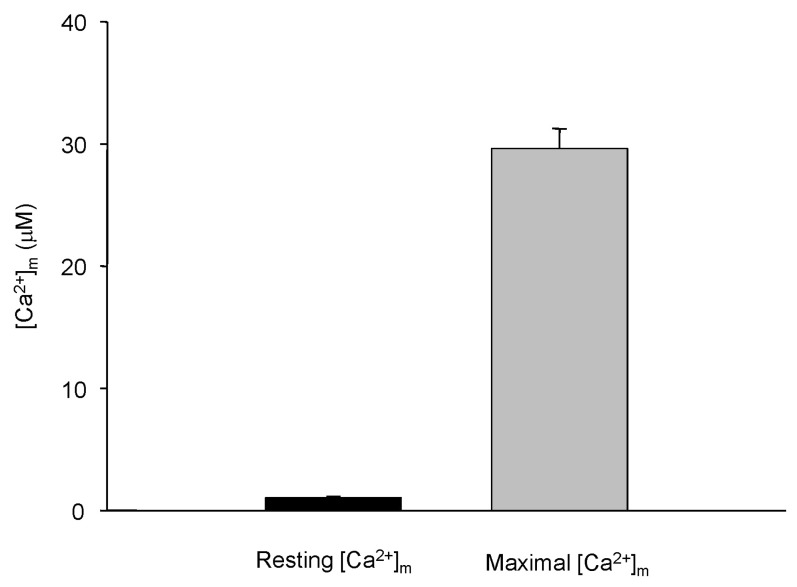
The resting [Ca
2+]
m was approximately 1.03 µM. A previous report showed that [Ca
2+]
m ranged from 0.08 to 0.17 µM [
2324]. Our study revealed a higher value than that of previous reports (see Refs. [
2324]). The change in [Ca
2+]
m plays a central role in the exercise-dependent increase in ATP by activating three mitochondrial matrix Ca
2+-sensitive enzymes (pyruvate dehydrogenase, α-ketoglutarate dehydrogenase, and NAD-dependent isocitrate dehydrogenase) [
464748495051]. Pyruvate and α-ketoglutarate dehydrogenase were almost fully activated at 1 µM because of the low K
d values, 0.77 and 0.28 µM, respectively [
51]. The K
d value of NAD-dependent isocitrate dehydrogenase was 5.4 µM [
51]. Therefore, the [Ca
2+]
m-dependent increase in ATP may be due to the activation of NAD-dependent isocitrate dehydrogenase.
The maximal attainable [Ca
2+]
m seemed to be limited. Our data showed that the maximal [Ca
2+]
m was about 30 µM at 1 µM cytosolic Ca
2+. Even when we applied more than 1 µM, the maximal [Ca
2+]
m was not increased further (data not shown). The 30 µM concentration is far below the electrochemical equilibrium because the Ψ
m is about -150 mV and the concentration of the electrochemical equilibrium must be up to 10
5 times the cytosolic [Ca
2+]. This limitation implied the strong possibility that other mechanisms exist to limit Ca
2+ increase in mitochondria. This may be a Ca
2+ efflux mechanism, an inhibitory regulator of Ca
2+ influx, or the increase in Ca
2+ buffer by a volume increase or an actual buffer increase. Until now, two mechanisms were suggested for mitochondrial Ca
2+ efflux, mNCX and CPX. Ca
2+ was applied under 0 mM Na
+ conditions; therefore, mNCX could not be the efflux mechanism involved in limiting the increase in [Ca
2+]
m. CPX may change mitochondrial pH because it causes influx of H
+ into mitochondria. However, mitochondrial pH was not changed during [Ca
2+]
m increase. The MCU, a major Ca
2+ influx pathway, did not show inactivation [
52]. The electrochemical gradient for Ca
2+ influx was huge, and thus it would likely be difficult for CPX to counteract the Ca
2+ influx to limit the [Ca
2+]
m increase. Another possibility is the opening of the MPTP. It was reported that [Ca
2+]
m overload could open the MPTP [
535455]. However, MPTP is permeable to 1.5-kDa molecules [
545556]; if the MPTP was opened, Fura-2-FF or NADH would be decreased. Further, if the MPTP was opened, the Ψ
m would be substantially depolarized. However, we did not observe these phenomena. Mitochondria are known to be a Ca
2+ sink because of their relatively larger Ca
2+ buffering capacity [
57585960]. If the limitation was caused by the buffer, [Ca
2+]
m must continuously increase, even though the speed was slower; however, this was not observed. Ca
2+ and Pi could form a precipitate [
61], and free [Ca
2+]
m may not increase because of continuous precipitate formation. Another possibility is mitochondrial swelling. Ca
2+ overload caused mitochondrial swelling, an indication of MPTP opening [
535455]. However, actual swelling may occur without MPTP opening. Mitochondria reportedly had a Pi-containing particle [
61]. Mitochondrial swelling and dissolution of those particles may increase mitochondrial buffering capacity to limit [Ca
2+]
m increase. The Pi effect on mitochondrial Ca
2+ dynamics requires further study.
In conclusion, we successfully developed a method to solve NADH and Fura-2-FF interference. This method enables more accurate Ca2+ measurements. In particular, quantitative measurement of mitochondrial Ca2+ dynamics is now possible and many uncertainties surrounding mitochondrial Ca2+ dynamics can be answered in the future using our new method.
Go to :




 PDF
PDF ePub
ePub Citation
 Print
Print




 XML Download