

 PDF
PDF ePub
ePub Citation
 Print
Print


INTRODUCTION
Endothelial cells (EC), which line the inner surfaces of blood vessels, not only act as a barrier between the plasma and vessel wall, but also play critical roles in the regulation of angiogenesis, blood vessel permeability, and contractility of blood vessels in response to physiologic and pathologic stimuli [1]. Therefore, EC dysfunction may contribute significantly to the development of vascular diseases such as thrombosis, atherosclerosis, and vacuities. Recently, we have reported that endothelial dysfunction contributes to the development of vascular diseases such as preeclampsia [2] and Fabry disease, using human samples and a mouse model of Fabry disease, α-galactosidase A knockout mice [3,4].
Mice have been widely used as animal models to investigate the underlying mechanisms of human diseases. Since primary EC are highly useful for in vitro studies in order to investigate the mechanisms underlying EC function or dysfunction, EC culture from mouse vessels has been attempted by investigators over the last few years; however, few reports on the isolation and characterization of EC from mouse vessels appear in the literature [5,6,7,8,9,10,11]. Dong et al. [11] report a strategy for isolation of EC from murine lung selected with CD-31 and magnetic beads. Suh et al. [10] describe a primary explant technique for the isolation of murine EC used in characterizing endothelial cell electrophysiology and Ca2+ signaling. However, mouse vessels are so small that it is very difficult to obtain sufficient sample EC for culture. Furthermore, mouse vessels are resistant to collagenase, which is usually used in cell isolation from vessels of large animals. Thus, the isolation of primary EC from mouse vessels is both time-consuming and costly, illustrating two major problems to be solved in murine EC culture: (a) acquiring a sufficient number of cells for culture; (b) maintaining EC in pure culture.
In this study, we used Matrigel matrix to establish mice vessel explant cultures, which enabled us to acquire enough cells for culture. The cell population was expanded into DMEM with heparin and EC growth supplement (ECGS), which inhibits smooth muscle growth and enhances EC growth, respectively. In addition, we inhibited fibroblast growth by applying shearing stress and anti-fibroblast antibody. RT-PCR analysis for EC-specific von Willebrand factor (vWF) was performed to confirm lack of contamination of smooth muscle cells (SMC) and/or fibroblasts. Western blotting for endothelial nitric oxide synthase (eNOS) and acetylated low density lipoprotein labeled with 1,1'-dioctadecyl-3,3,3',3'-tetramethyl-indocarbocyanine perchlorate (DiI-Ac-LDL) were also used to demonstrate the endothelial nature of the cells. Our method is a simple, efficient, and cost-effective alternative to other methods for EC culture from mouse vessels.
Go to : 
METHODS
Isolation of EC from mouse vessels
The investigation was approved by the local ethics committee, the Institutional Review Board of Ewha Womans University, and was in accordance with the Declaration of Helsinki; the Animal Care Guidelines of Ewha Womans University, Medical School; and the National Institutes of Health Guide for the Care and Use of Laboratory Animals.
Mice were anesthetized with an intra-peritoneal injection of pentobarbital sodium (300 mg/kg body weight) plus 500 U heparin. The aorta, branches of the superior mesenteric artery (SMA), and the cerebral artery from the circle of Willis (CA) were removed and placed in Ca2+-free phosphate-buffered saline (PBS). Periadventitial fats and connective tissues around the vessels were carefully cleaned under a dissecting microscope using forceps and iris scissors. Matrigel (BD Biosciences, San Jose, CA) was added to 24-well plates (about 250 µl in each well) and polymerized at 37℃ for 30 min.
The aorta was cut into 8~10 small pieces and opened longitudinally. These pieces were placed with the intima side down on the Matrigel in the wells (4~5 pieces in each well). Next, a small amount of culture media was added to keep the explants moist but not submerged. The explants were placed in an incubator at 37℃ in a 5% CO2 atmosphere, and cells migrated from the aortic segments. After 5~7 days, the aortic pieces were removed, and 2 ml culture medium was added to the wells.
Branches of SMA or CA were placed into the Matrigel in 24-well plates, and cut into very small pieces using iris scissors in the Matrigel. Then, culture medium was added, and the explants were placed in an incubator at 37℃ in a 5% CO2 atmosphere. Cells migrated from the vessel segments after a few days, and the migrated cells were allowed to grow to confluence over 3~4 weeks.
When the cells reached confluence, the medium was removed, and the cells were incubated for 60~90 min at 37℃ in 2 ml/10 cm2 (100 U) dispase (BD Biosciences, San Jose, CA) to detach the cultured cells from the Matrigel. Thereafter, culture medium was added to stop the dispase activity via dilution. Cells were then harvested and centrifuged for five minutes at 1000 rpm. After the supernatant was decanted, small samples of the pellet were transferred to six-well plates (passage 1). When the cells had grown to confluence, the medium was removed, and the cell pellet obtained was washed twice with Ca2+-free PBS containing 0.1 mM EDTA. After removing PBS, cells were passaged as described by Suh et al. [10] (passage 2).
The culture medium (100 ml) was composed of 80 ml Dulbecco's modified Eagle's medium (DMEM, GIBCO BRL 41965), 10 ml fetal calf serum (FCS, GIBCO BRL 10270), 7.5 mg ECGS (Sigma E-2759), 200 µl heparin (10 U/ml final), 2 ml penicillin/streptomycin (100 U/ml final, GIBCO BRL 15070), 1 ml L-glutamine (100×, GIBCO BRL 25030- 024), and 1 ml Minimal Essential Amino acids (100×, GIBCO BRL 11140-035). ECGS in the culture medium promotes EC growth, and heparin prevents vascular SMC growth.
Uptake of DiI-Ac-LDL
The cells (passages 2-5), seeded on 1% gelatine-coated glass cover slips, were incubated in growth medium containing 10 µg/ml DiI-Ac-LDL (Biomedical Technologies Inc., Stoughton, MA) at 37℃ for 4 h. After washing twice with PBS to remove free DiI-Ac-LDL, cells were fixed with 3.7% paraformaldehyde in PBS for 20 min at room temperature. Next, the cells were counterstained with 4',6-diamidino-2-phenylindole dihydrochloride (DAPI) and mounted, and images were observed with a fluorescence microscope (Axiovert 200; Carl Zeiss Co., Oberkochen, Germany).
Western blotting
After washing once in ice-cold PBS, cells were lysed in a protein extraction solution (passage 2). Electrophoresis and transfer to nitrocellulose were carried out according to the manufacturer's instructions (Bio-Rad, Hercules, CA) using SDS-PAGE gels (10~12%). The membrane was blocked for 2 h in TBST (10 mM Tris-HCl, 150 mM NaCl, and 1% Tween 20, pH 7.6) containing 5% bovine serum albumin. After incubation with anti-eNOS antibody for 3 h and three washes in TBST (each 10 min), the membrane was incubated with a horse-radish peroxidase-conjugated anti-mouse antibody for 1 h. Bands were visualized by chemiluminescence, and data collection and processing were performed using an LAS-3000 luminescent image analyzer and IMAGE GAUSE software (Fujifilm, Tokyo, Japan).
RNA isolation and RT-PCR
RNA isolation from cells and RT-PCR analysis for vWF expression performed using the RNeasy mini kit (Qiagen, Valencia, CA) and OneStep RT-PCR kit (Qiagen), according to the manufacturer's instructions. Primers for mouse vWF were 5'-CAGCATCTCTGTGGTCCTGA-3' (sense) and 5'-GATGTTGTTGTGGCAAGTGG-3' (antisense). vWF mRNA expression was normalized to the mouse house-keeping gene mouse GAPDH 5'-AACTTTGGCATTGTGGAAGG-3' (sense) and 5'-ACACATTGGGGGTAGGAACA-3' (antisense). MOVAS (CRL-2797) and NIH-3T3 (CRL-1658) were used as a positive control for SMC and fibroblasts, respectively.
Flow cytometry
When the cells were approximately 80% confluent, DiI-Ac-LDL (5 µg/ml) was loaded into the culture media. The unloaded DiI-Ac-LDL (5 µg/ml) cells were prepared as an autofluorescent blank. The following day, the cells were detached with trypsin and resuspended in PBS up to 1×10⁶ cells/ml. The cells were kept in a tube on ice until they were sorted with a flow cytometer (Beckman Coulter, Fullerton, CA), as described previously [12]. Ten thousand cells were analyzed in each sample. Autofluorescence signals from unlabeled cells were used as negative controls in each experiment.
Immunohistochemistry
We used immunohistochemical techniques to detect vWF and eNOS. For immunostaining, mouse EC of passages 2~4 were washed with Tris (hydroxymethyl)aminomethane (TRIS)-buffered saline (TBS, 50 mM TRIS-HCl, 150 mM NaCl, pH 7.5). After fixation with a 7:3 mixture of methanol/acetone (20 min at -20℃), cells were permeabilized with 0.25% Triton X 100 (in TBS) for 30 min and blocked with 5% bovine serum albumin (BSA, in TBS) for 1 h. Rabbit anti-human vWF antibody (DAKO A0082; 1:300 in TBS/1%BSA) or rat anti-mouse CD31 (PECAM-1) monoclonal antibody (PharMingen, Cat. No. 01951; 1:50 in TBS/1% BSA) was added and allowed to process overnight (4℃). Subsequently, cells were washed with TBS containing 0.1% Tween and incubated with either an alkaline phosphatase-conjugated, monoclonal anti-rabbit immunoglobulin G (IgG) (Sigma, A-2556; 1:200 in TBS/1%BSA) or goat anti-rat Ig-specific polyclonal antibody (PharMingen, Cat. No. 12113; 1:20 in TBS/1%BSA) for 1 h at room temperature. After an additional TBS wash (3'), cells were stained using nitro blue tetrazolium/5-bromo-4-chloro-3-indolylphosphate-p-toluidine (NBT, Sigma N-6876; BCIP, Roth Art. No. 6368.1), as substrates in alkaline phosphatase buffer (100 mM TRIS-HCl, pH 9.5; 100 mM NaCl; 5 mM MgCl2).
Statistical analysis
Data are presented as mean±SEM, and significant differences were detected using Student's t-test (p<0.05).
Go to :
RESULTS
EC isolation, culture, and analysis
Two to seven days after mouse vascular explants attached to Matrigel matrix, cells with large and round nuclei started to migrate from the edges of the explants. Matrigel matrix was gradually filled with proliferating cells, and the cells from the explants formed tube-like structures in the Matrigel (Fig. 1), suggesting that the cells were EC. When cells in the Matrigel were passaged by treatment with dispase, we collected about 1.5×10⁶ cells (passage 1) from aortic explants from one mouse. We obtained better cell yield by using Matrigel with high protein content (>9.5 mg/ml) compared to Matrigel with low protein content (<8 mg/ml). To confirm the origin of the cells at passages 1~5, we performed a Dil-Ac-LDL uptake test, since active uptake of Dil-Ac-LDL is a well-known characteristic of EC (Fig. 2) [13,14,15]. When the test was conducted in cells at passage 1, the ratio of Dil-Ac-LDL uptake was greater than 90%, but the ratio decreased with each additional passage. The ratio decreased to about 81% in cells at passage 2, 65% in cells at passage 3, and 35% in cells at passage 5, suggesting that growth of cell types other than EC, SMC or fibroblasts, increased with passage cycle. We, thus, examined whether SMC overgrew in the experimental setting. Among cells at passage 5, we could not find characteristics of SMC, such as α-smooth muscle actin (α-SMA) (Fig. 6F); the absence of SMC might be caused by heparin in the culture medium, because heparin inhibits SMC growth [10]. Thus, the decrease in the ratio might be caused by overgrowth of fibroblasts.
 | Fig. 1Pieces of mouse vessels explanted on/in a Matrigel support. Cells started to migrate from the edges of explants and reached confluence. (A) Aortic pieces were placed with the intima side down on Matrigel (left panel) and removed after 5~7 days (middle panel). Higher magnification images of the boxed areas, designated as a and b, are displayed in the right upper and lower sides, respectively. Cells proliferated to form a tube-like structure. (B) Schematic representations of branches of the SMA (left panel) and the CA from the circle of Willis (right panel). Branches of the SMA and the CA from the circle of Willis were explanted in Matrigel, and cells migrated from small segments of the vessels. Images were obtained by phase-contrast microscopy at 50× magnification.
|
 | Fig. 2Labeling of MAEC with DiI-Ac-LDL. (A, B) Active DiI-Ac-LDL uptake was examined by flow cytometry in MAEC at passages 1-5. MAEC at passage 1 without DiI-Ac-LDL were used as a negative control.
|
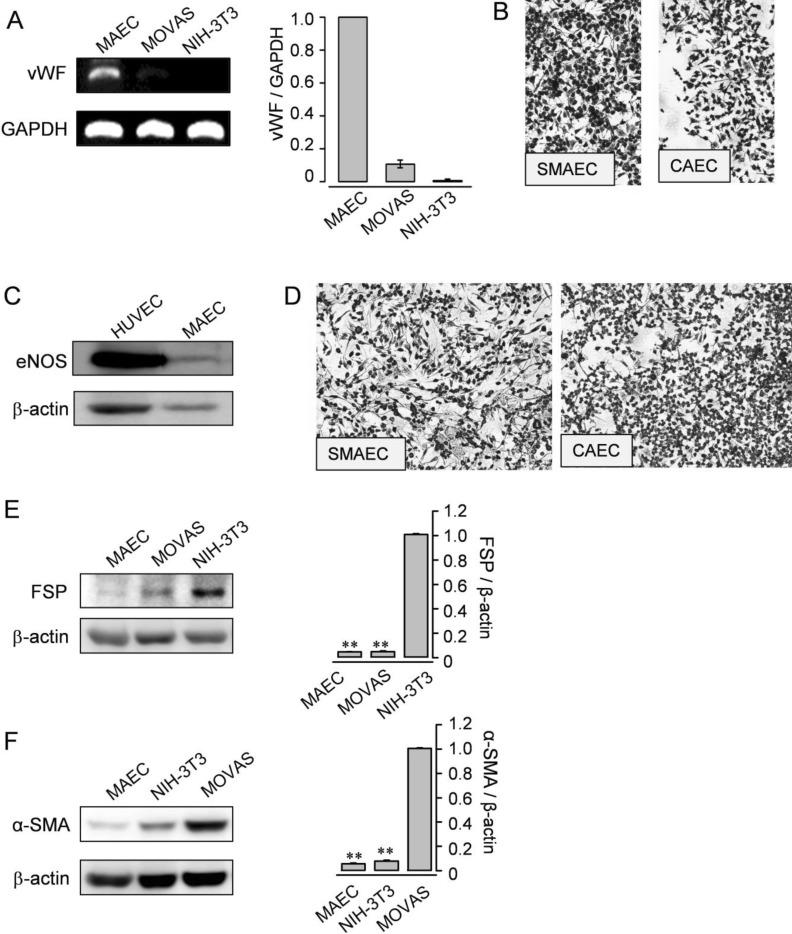 | Fig. 6Expression of typical genes and proteins from ECs. (A) RT-PCR analysis for vWF was performed (passage 5) in MAEC. SMC (MOVAS) and fibroblasts (NIH-3T3) were employed as negative controls. GAPDH was used as an internal standard. (B) Immunocytochemistry of the isolated EC from branches of the SMA or the CA for vWF. (C) Western blotting for eNOS was examined in MAEC (passage 2) and HUVEC. HUVEC were used as a positive control. (D) Immunocytochemistry of the isolated EC from branches of the SMA or the CA for eNOS. (E and F) Western blotting for FSP (E) or α-SMA (F) was examined in MAEC (passage 5), MOVAS, and NIH-3T3. NIH-3T3 or MOVAS was used as a positive control. β-actin was used as an internal standard. (A, E, and F) Results are representative of three independent experiments. The data shown are mean±SEM of three independent experiments.
|
Endothelial isolation procedure
Cells at passage 1 proliferated to form a monolayer, whereas cells at passage 2 or later started to form a multilayer; the number of cells in the multilayer gradually increased with each passage. Since EC grow to form a monolayer, cells growing to form a multilayer might not be EC. Thus, we tried to eliminate the cells in the multilayer, in order to increase the purity of EC among the cultured cells. Cells at passage 2 or 3 were pooled into a six-well plate, and anti-fibroblast antibody (100 mg/ml) (1:200) was applied via the culture medium. Then, the plates were gently rocked at very low speed (less than 50 rpm) in an incubator at 37℃ in a 5% CO2 atmosphere. The combined treatment with the antibody and gentle rocking eliminated the formation of a multilayer (Fig. 3). Almost all of the cells in the multilayer disappeared after 5~7 days of the combined treatment, at which time we stopped applying the treatments. When the cells reached confluence, we passaged the cells using the standard passage procedure for subculture. The passaged cells formed a monolayer and showed a typical endothelial morphology such as cobblestone appearance and contact-inhibited growth (Fig. 4). We performed a Dil-Ac-LDL uptake test to confirm that the proliferating cells in the monolayer were EC and compared the Dil-Ac-LDL uptake ratio with that of human umbilical vein endothelial cells (HUVEC); HUVEC showed characteristics of EC after passaging and were used as a positive control. Mouse aortic endothelial cells (MAEC) and HUVEC formed a monolayer with a Dil-Ac-LDL uptake ratio greater than 95% (Fig. 5). The ratio did not decrease after passaging. These results suggest that almost all of the cells were EC. When FCS in the culture medium was replaced with platelet-derived serum (PDS), the cells in the multilayer were more easily removed by the combined treatment (data not shown).
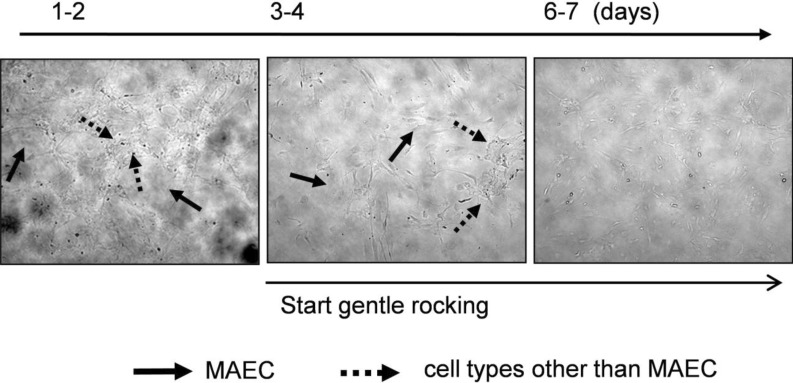 | Fig. 3Elimination of cells in the multilayer. Cells growing in the multilayer were markedly increased after passaging (left panel). When exposed to anti-fibroblast antibody and gentle rocking, cells in the multilayer gradually disappeared. Four or five days after the exposure, only cells growing in a monolayer remained. Lined arrows represent cells in a single layer, and dotted arrows are cells in a multilayer.
|
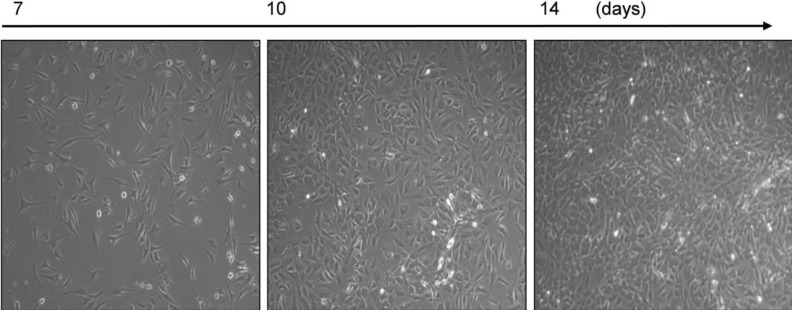 | Fig. 4Purified MAECs by elimination of cells in the multilayer. Cells from aortic explants were exposed to anti-fibroblast antibody and gentle rocking, eliminating cells in the multilayer. A confluent monolayer of MAECs was demonstrated. Note the presence of contact inhibition and cobblestone morphology in all panels. Images were obtained by phase-contrast microscopy at 100× magnification.
|
 | Fig. 5Typical EC characteristics of isolated cells. (A) Cells were stained with DiI-Ac-LDL, and HUVECs were employed as a positive control (left panel). DAPI was used for nucleus staining (center panel), and merged images are displayed (right panel). DiI-Ac-LDL uptake occurred in nearly all of the cells. (B) Flow cytometry analysis was performed in MAECs (passage 4) and HUVEC. DiI-Ac-LDL-labeled ECs showed a dominant fluorescence shift compared to unlabeled negative control cells. (C) Active DiI-Ac-LDL uptake in EC isolated from the CA (CAEC, left panel) and from branches of the SMA (SMAEC, right panel).
|
It took about 21 days to complete the procedure from starting explants to the selection of EC. At passage 3, EC were prepared for the next characterization step or frozen in a liquid nitrogen tank for future studies (Scheme 1).
EC characteristics
Western blotting or RT-PCR analysis for an EC-specific gene or protein was employed to profile characteristics of EC. vWF was dominantly expressed in MAEC at the gene level, whereas it was hardly observed in MOVAS (10%) or NIH-3T3 (Fig. 6A). We showed the presence of vWF in cells from branches of SMA or CA by using immunocytochemistry (Fig. 6B). In addition, we used immunocytochemistry to show that eNOS was expressed in MAEC at the protein level (Fig. 6C) and in cells from branches of SMA or CA (Fig. 6D). We then examined whether fibroblast- or SMC-specific protein was expressed in MAEC. The fibroblast-specific protein, fibroblast surface protein (FSP), was not observed in MAECs or MOVAS (Fig. 6E). In addition, α-SMA was observed in MOVAS, but not in MAEC or NIH-3T3 (Fig. 6F). Our observations suggest that this method can be used to isolate high purity EC.
Go to :
DISCUSSION
We describe in this paper a method of isolating EC from various vessels in mice, such as aorta, branches of the SMA and CA. The method described has two stages: the first is to produce a large amount of cells using explanted vessels on/in Matrigel. The second is to select EC by eliminating fibroblasts and SMC. The growth of SMC was easily inhibited by treatment with heparin; fibroblasts were eliminated by gently rocking the culture plates and applying anti-fibroblast antibody. The main advantage of this method is that it can be widely applied to collect EC from various vessels in mice: large vessels like aorta and small vessels like CA.
In vitro cultures of EC in vessels from mice have been reported using many different isolation methods [6,8,9,11,14,16,17,18]. These isolation methods have two stages: the first is to acquire cells by collagenase digestion of blood vessels and to multiply cells. The second is to select EC among the multiplied cells. Magnetic bead sorting or FACS analysis is widely used to select EC from a mixed population of cells by using selective markers such as DiI-Ac-LDL [13,14,15], CD31 (PECAM-1) [19] or fluorescein isothiocyanate-Bandeirea simplicifolia lectin-I [9]. These techniques can be problematic in that the procedures are not simple and yield is poor. The mouse aorta, although it is a macrovessel, is so small in diameter that it is very difficult to obtain a sufficient number of cells for culture by enzymatic digestion. Especially, branches of the SMA and CA are too small to treat the inner surfaces with collagenase, and therefore it is almost impossible to obtain EC for culture by collagenase treatment. In addition, the process to expose vessels to collagenase is very complicated and prohibitively time-consuming. Furthermore, the selection process using flow cytometric sorting or magnetic beads is complicated, and the selection markers remain in EC after selection, which might affect cellular functions.
EC isolation from mouse vessels is time consuming and costly. In addition, the isolated EC can be passaged only six or seven times before experiencing significant senescence. Thus, numerous studies have been attempted to establish immortalized cell lines from mouse EC [5,6,20], and several EC lines originating from EC of mouse vessels have been established. Immortalized MAEC express common markers of EC, including PECAM1, eNOS, VE-cadherin, and vWF, and proliferate to form tube-like structures, suggesting that the MAEC retain typical endothelial properties and phenotypes [5]. However, phenotype changes have been reported in the EC lines [21]. Therefore, a simple and reliable method for isolating primary mouse EC is needed.
Here we report that primary EC can be reproducibly isolated from various mouse vessels such as aorta, branches of the SMA and CA. This method helps obtain enough cells for EC selection and results in increased EC yield and viability. The advantages of this approach are that the procedures are simple and the resulting EC population is very pure (i.e., >90%). In addition, EC can be multiplied to a large number by passaging one or two times. Thus, this method can be applied to experiments in which primary EC from mice are necessary, and EC isolated using this method can subsequently be employed in future research regarding the pathophysiological mechanisms of vascular diseases.
The use of Matrigel to isolate EC of mouse has been previously reported as primary explant technique [10]. Our method is similar to the primary explant technique, in that explanted murine vessels on/in Matrigel are used to obtain EC. However, there are two kinds of differences between the methods. Suh et al. [10] obtained EC from aorta, but not from vessels with very small diameters such as branches of SMA. In contrast, our method could be applied to isolate primary EC not only from aorta but also from branches of the SMA and CA. In addition, we developed a selection process by using anti-fibroblast antibody and gentle rocking. Since murine vessels were placed on/into Matrigel, fibroblasts or SMC might grow out from the explanted vessels and EC must be selected from the total cell population. The combined treatment with the antibody and gentle rocking enables us to selectively separate EC from contaminating cells. Compared with other selection procedures, this selection process is very simple and can be applied to cells in culture plates in an incubator.
In summary, we have developed a reproducible in vitro culture method to isolate primary EC from mice. This method might be applied to collect EC for studying diverse EC functions, especially in mice models of human diseases and in vessels with very small diameters. A readily available source of mouse EC will facilitate research in many areas.
Go to :
 XML Download