

 PDF
PDF ePub
ePub Citation
 Print
Print


INTRODUCTION
Alcohol use is the third leading risk factor for poor health worldwide. Overall, 3 of every 10 adults (≥18 years of age) have a diagnosis of alcoholism and/or engage in alcohol abuse at some point in their lives, and this affects their families, communities, and society as a whole [1]. Harmful use of alcohol causes an estimated 2.5 million deaths every year, a significant proportion of which occur in young people, and there is emerging evidence that it contributes to the health burden caused by communicable diseases such as tuberculosis and human immunodeficiency virus/acquired immunodeficiency syndrome [2]. Approximately two of five male and female undergraduate college students engage in excessive or binge drinking in the United States [3]. The age distributions of these undergraduate college students is approximately <21 years (45.5%), 21 to 23 years (48.1%), and ≥24 years (28.5%), respectively. According to 2009 Korea national data, excessive alcohol consumption in a single session or day was reported by 10.3% of respondent students in grades 7 to 12 [4]. Young adults and adolescents who are at risk for early diabetes and prediabetes also tend to be exposed to excessive or binge drinking. Previous studies have shown that loss of beta cells and insulin resistance are important causes of diabetes mellitus and that endoplasmic reticulum (ER) stress plays a key role in the pathogenesis of diabetes [5]. In addition, alcohol is a strong enhancer of ER stress in some organs, such as the liver, pancreas, heart, and brain [6]. Therefore, ER stress is highly associated with diabetes and alcohol use.
The ER synthesizes a variety of proteins and lipids, secretes some proteins from the cell, and stores calcium [7]. ER stress is defined as any condition that affects ER function [8910]. It involves oxidative stress, ischemic insults, calcium dysregulation, and accumulation of unfolded proteins [11]. The ER contains chaperones that are involved in protein folding, notably glucose-regulated protein 78 (GRP78)/BiP. GRP78 combines double-stranded RNA-activated protein kinase-like ER kinase (PERK), inositol-requiring enzyme 1α (IRE1α), and activated transcription factor 6 (ATF6) in the ER membrane and regulates the activation of these molecules [12]. Under unstressed conditions, GRP78 is combined with the three sensors PERK, IRE1α, and ATF6; however, under stressed conditions such as the accumulation of misfolded proteins or depletion of calcium in the ER, GRP78 is dissociated from these three sensors. ER stress elicits the unfolded protein response (UPR) to sustain ER homeostasis. The adaptive response of the UPR to ER stress involves the following process: inhibition of protein synthesis, enhancement of protein degradation, and an increase in GRP78 levels. These responses are also triggered by the dissociation of GRP78 from the ER stress sensors [13]. However, the proapoptotic pathway of the UPR is ultimately induced by prolonged ER stress, resulting in the production of apoptotic signals including CHOP, JNK, and caspase 12 [111415].
The relationship between excessive or binge alcohol drinking among adolescents or young adults and the increasing trend of diabetes and prediabetes has brought about strong interest in experimental animal models. To better understand the biological mechanisms underlying excessive alcohol use among adolescents and young adults in regard to prediabetes and early diabetes, we studied Otsuka Long-Evans Tokushima Fatty (OLETF) rats (11~22 weeks of age), which have prediabetes and early diabetes induced by excessive levels of alcohol. The clinical and pathological features of OLETF rats resemble those of humans with type 2 diabetes [161718].
To the best of our knowledge, no study has comparatively evaluated changes in ER stress in the pancreas and liver in patients with prediabetes and early diabetes associated with alcohol consumption at a young age. We investigated which effects on ER stress caused by chronic alcohol consumption are involved in the liver and pancreas in prediabetes and early diabetes using OLETF rats.
METHODS
Study animals
The animals used in this study were 4-week-old male OLETF rats (Otsuka Pharmaceutical Company, Tokushima, Japan) bred in clean rooms regulated at 22℃±1℃ with a 12 h light/dark cycle in accordance with the Catholic University College of Medicine experimental animal laboratory management (IRB no. CUMC-2008-0180-01).
Diet and treatment
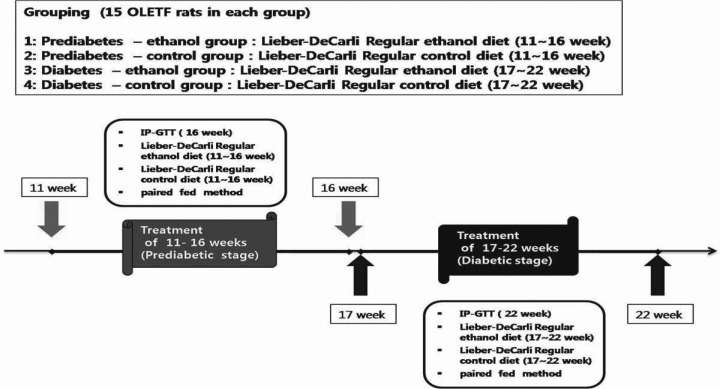
Rats aged 10 to 16 weeks consumed water freely. For the subsequent 6 weeks, 15 rats from the experimental group were fed 100 mL/day of a Lieber-DeCarli regular ethanol-containing liquid diet (35% fat, 11% carbohydrate, 18% protein, and 36% alcohol; LD102A test diet, Purina Mills, Richmond, VA, USA), and 15 rats from the control group were given a Lieber-DeCarli regular control diet (35% fat, 47% carbohydrate, and 18% protein). The ethanol was isocalorically replaced with maltose-dextrin; both diets supplied equal calories. This pair-feeding method was used regardless of any increases in body mass.
OLETF rats in the prediabetes group (aged 11~16 weeks) were categorized as follows: those fed a Lieber-DeCarli ethanol-containing liquid diet were referred to as the prediabetes/OLETF rat/alcohol diet group (Pd-O-E group, n=15), and those fed a Lieber-DeCarli regular control diet were referred to as the prediabetes/OLETF rat/control diet group (Pd-O-C group, n=15). Rats in the early diabetes group (aged 17~22 weeks) were categorized as follows: those fed a Lieber-DeCarli ethanol-containing liquid diet were referred to as the early diabetes/OLETF rat/alcohol diet group (D-O-E group, n=15), and those fed a Lieber-DeCarli regular control diet were referred to as the early diabetes/OLETF rat/control diet group (D-O-C group, n=15) (Fig. 1).
Intraperitoneal glucose tolerance test
OLETF rats were fasted for 18 h, and intraperitoneal glucose tolerance tests were performed (25% glucose solution, 2 g/kg). Blood samples were obtained by tail snipping. Blood glucose levels were measured using a glucose oxidase method with one-touch test strips (Accuchek; Roche Diagnostics, Mannheim, Germany) (Fig. 1).
Biochemical tests
Serum glutamic oxaloacetic transaminase, serum glutamic pyruvic transaminase, albumin, and plasma homocysteine levels were measured by the Green Cross Institute of Medicine (Seoul, South Korea).
Immunofluorescence microscopy examination
Each rat was sacrificed at 16 and 22 weeks, and the liver and pancreas were removed and fixed in 10% formalin solution. We created paraffin tissue blocks that were then sliced into 5µm sections. The paraffin was removed, and the tissue was stained with hematoxylin and eosin. Immunostaining was performed using citrate buffer (pH 6.0) that was boiled twice for 5 min each, and then the samples were incubated at room temperature in goat serum for 20 min. Tissue slices were incubated at 4℃ for 16 min with primary insulin (Invitrogen, Rockville, MD, USA) and glucagon (Dako, Glostrup, Denmark) antibodies and then washed three times with Tris-buffered saline, pH 7.4. Secondary antibodies were stained using a Vectastain ABC Kit (Vector Labs, Burlingame, CA, USA), and biotinylated guinea pig antibodies were incubated with insulin for 1 h. Then, insulin was incubated for 1 h at room temperature with streptavidin Alexa Fluor 546 (Invitrogen), and glucagon was incubated for 1 h at room temperature with rabbit Alexa Fluor 488 (Invitrogen). After the tissue was washed three times with Tris-buffered saline, nuclear staining was performed with 4',6-diamidino-2-phenylindole, and the tissue was mounted with conjugated mounting medium (Dako). Then the slides were photographed with a fluorescence microscope (Olympus, Tokyo, Japan).
Western blotting
Liver and pancreas cells were added to lysis buffer (150 mM NaCl, 50 mM Tris-HCl [pH 7.4], 2 mM EDTA, 1% Nonidet P-40, 10 mM NaF, 1 mM Na3VO4, 10 mM sodium pyrophosphate, 1 mM phenylmethylsulfonyl fluoride, 10 mg/mL aprotinin, 10 mg/mL leupeptin, and 0.1 mg/mL soybean inhibitor) and homogenized using a Polytron homogenizer (Brinkmann Instruments, Westbury, NY, USA). Pulverized samples were centrifuged for 10 min at 15,000 rpm at 4℃. Fats and sediments were removed, and the supernatant was collected. The protein was quantified using the bicinchoninic acid method (Thermo Fisher Scientific, Rockford, IL, USA). The sample was dissolved in Laemmli sample buffer and boiled at 100℃ for 5 min, and then the supernatant was used for electrophoresis. Electrophoresis was performed using 6~12% sodium dodecyl sulfate/polyacrylamide gel electrophoresis, and the electrophoresis gel was transferred to a 0.45µm nitrocellulose membrane. Nitrocellulose membranes were incubated with 5% skim milk in 0.1% Tween 20 TBST solution (Cell Signaling Technology, Danvers, MA, USA) for 1 h. After this, primary antibody solution (p-PERK, p-eIF2α, ATF6, Grp78/Bip, c-Jun N-terminal kinase [JNK], p-JNK, IRE1α [all from Cell Signaling Technology], and GADD153-CCAAT/enhancer-binding protein homologous protein [CHOP; Santa Cruz Biotechnology, Santa Cruz, CA, USA]) was applied to each membrane for incubation. The membranes were washed three times in TBST solution for 7 min each. Next, the samples were treated with horseradish peroxidase-conjugated anti-rabbit and anti-mouse secondary antibody solution for 1 h at room temperature, washed as previously mentioned, and assessed for coloration using an LAS 3000 luminescent image analyzer (Fujifilm Holdings, Tokyo, Japan). α-Tubulin and beta-actin (Sigma-Aldrich, St. Louis, MO, USA) were used for protein quantification. Multigauge 2.2 (Fuji Photo Film Co., Tokyo, Japan) software was used to quantify the protein bands.
Data analysis
Each experiment was repeated three times, and the study results are expressed as means±standard deviations. Statistical significance was determined using an unpaired Student's t test. Statistical analyses were performed using SAS (version 9.2; SAS Institute, Cary, NC, USA). Results were considered to be significant at a p value of <0.05.
RESULTS
Changes in body weight
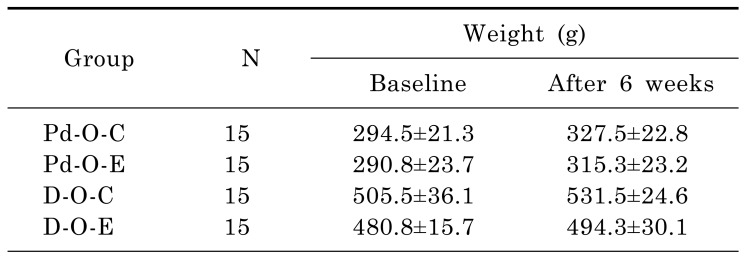
After 6 weeks on a Lieber-DeCarli diet, body weight was higher in the Pd-O-C group (from 294.5±21.3 g to 327.5±22.8 g), Pd-O-E group (from 290.8±23.7 g to 315.3±23.2 g), D-O-C group (from 505.5±36.1 g to 531.5±24.6 g), and D-O-E group (from 480.8±15.7 g to 494.3±30.1 g) than at baseline (Table 1). The average calculated amounts of liquid alcohol consumption in the Pd-O-E and D-O-E groups were 10.62 and 10.33 g/kg/day, respectively; this constituted heavy alcohol consumption. We bred the OLETF rats by the pair-fed method. In rats with prediabetes, the caloric values were 65.5 Kcal/day in the Pd-O-E group and 65.9 Kcal/day in the Pd-O-C group. In rats with early diabetes, the caloric values were 82.0 Kcal/day in the D-O-E group and 82.2 Kcal/day in the D-O-C group.
Changes in blood glucose concentration
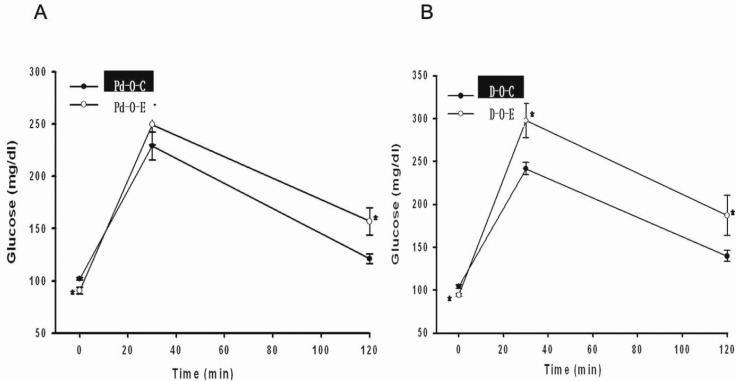
After administering alcohol to prediabetic rats from 11 to 16 weeks of age, the results of the intraperitoneal glucose tolerance test (IPGTT) performed at 16 weeks revealed that the fasting blood glucose level was 90.9±3.1 mg/dL in the Pd-O-E group and 102.1±1.3 mg/dL in the Pd-O-C group, which was statistically significant (p<0.05). However, the blood glucose level after 120 min was 156.9±13.0 mg/dL in the Pd-O-E group, which was a greater increase than that in the Pd-O-C group (121.2±4.8 mg/dL) (p<0.05) (Fig. 2).
After administering alcohol to rats with early diabetes aged 17 to 22 weeks, the results of the IPGTT performed at 23 weeks showed that the fasting blood glucose level in the D-O-E group (94.0±1.6 mg/dL) was significantly lower than that in the D-O-C group (104.2±2.3 mg/dL) (p<0.05). However, the blood glucose level in the D-O-E group increased to 297.3±19.7 mg/dL after 30 min and then decreased to 186.9±23.6 mg/dL after 120 min. This increase had greater statistical significance than that in the D-O-C group (30 min blood glucose level, 241.5±7.2 mg/dL; 120 min blood glucose level, 139.5±6.4 mg/dL) (p<0.05) (Fig. 2).
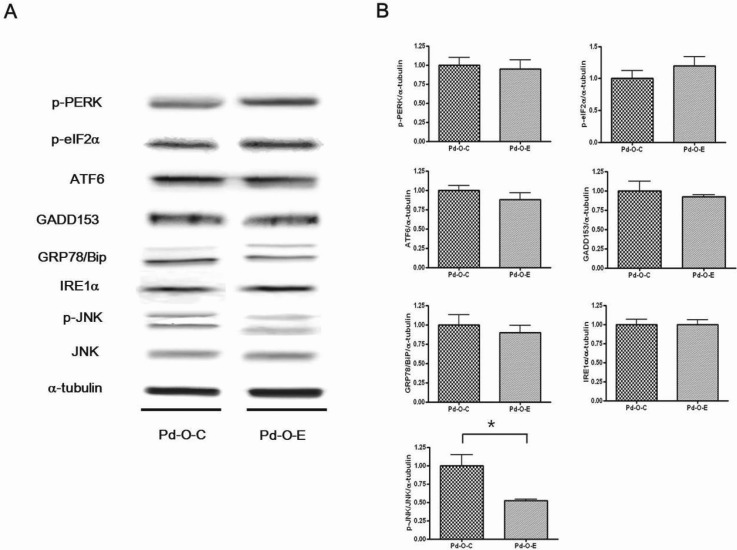
Changes in liver tissue ER stress due to administration of alcohol in the prediabetic stage
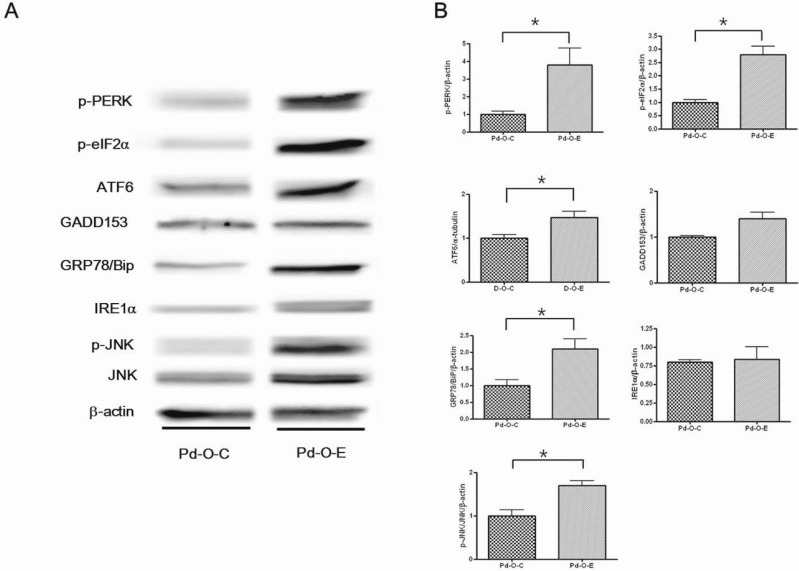
p-JNK levels decreased significantly in the Pd-O-C group compared to the Pd-O-E group (p<0.05). However, there were no statistically significant differences in ATF6, IRE1α, GADD153, Grp78, p-PERK, and p-elF2α levels (Fig. 3).
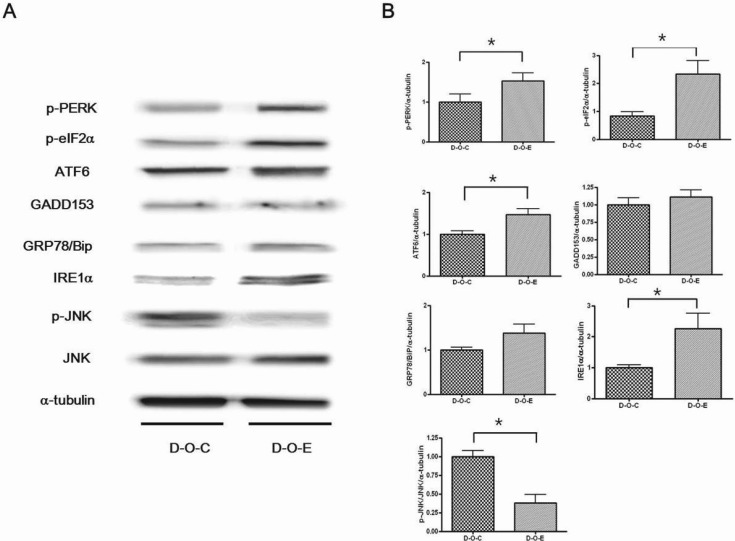
Changes in liver tissue ER stress due to administration of alcohol in the early diabetic stage
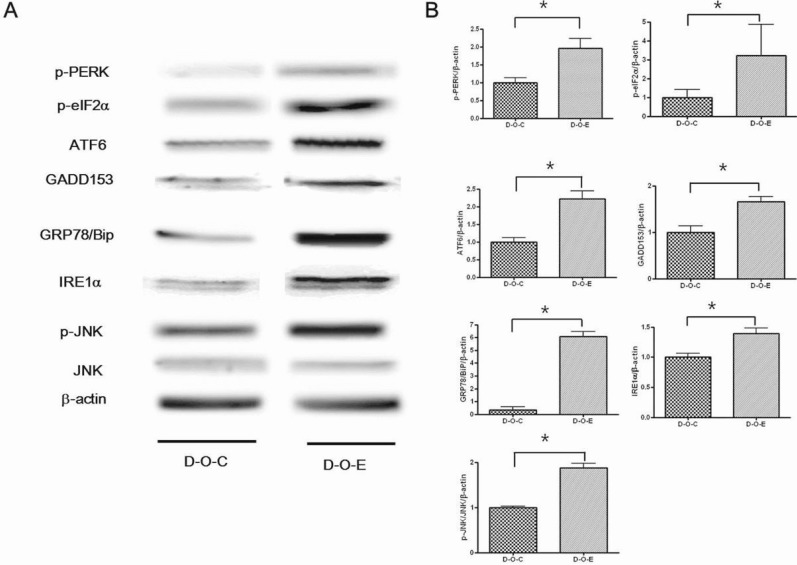
The p-PERK, p-elF2α, ATF6, and IRE1α levels were significantly higher in the D-O-E group than in the D-O-C group; however, the p-JNK level was significantly lower (p<0.05). There were no significant differences in the GADD153 or Grp78 level (Fig. 4).
Biochemical liver tissue changes due to administration of alcohol
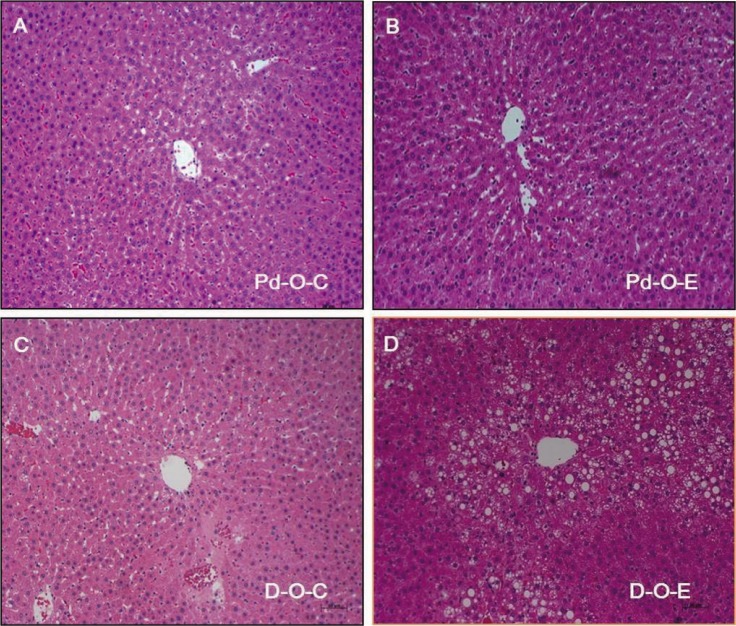
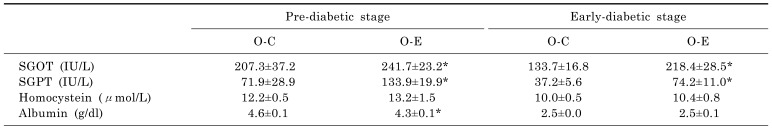
The levels of glutamic oxaloacetic transaminase and glutamic pyruvic transaminase in serum increased significantly when alcohol was administered to prediabetic and diabetic OLETF rats (p<0.05). There were no differences in homocysteine levels, although the albumin levels decreased (Table 2). When the Pd-O-E group was compared to the Pd-O-C group, deposition of fat in liver cells was intermittently observed, but no inflammation was observed in the Pd-O-E group. A significantly higher frequency of fat deposition was observed in the liver cells of the D-O-E group than the D-O-C group (Fig. 5).
Changes in pancreatic tissue ER stress due to administration of alcohol in the prediabetic stage
Levels of p-PERK, p-elF2α, ATF6, Grp78, and p-JNK were significantly higher in the Pd-O-E group than in the Pd-O-C group (p<0.05). Levels of GADD153 and IRE1α showed increasing trends, but there were no statistically significant differences (Fig. 6).
Changes in pancreatic tissue ER stress due to administration of alcohol in the diabetic stage
Levels of p-PERK, p-elF2α, ATF6, Grp78, GADD153, IRE1α, and p-JNK were significantly higher in the pancreatic tissue in the D-O-E group than in the D-O-C group (p<0.05) (Fig. 7).
DISCUSSION
The main finding of this study is that chronic alcohol consumption in OLETF rats with prediabetes or early diabetes results in greater damage to the pancreas than to the liver. In liver, the adaptive pathways of the UPR to ER stress might not occur in prediabetes, but could emerge from early diabetes onward. The pancreas supervened the transition from adaptation to the proapoptotic pathway of the UPR because of the increment of JNK during prediabetes. The proapoptotic pathway of the UPR to ER stress was aggravated during early diabetes because of the increments in JNK and CHOP in the pancreas.
We designed this experimental animal study to be similar to the clinical state because young adults and adolescents at risk for prediabetes and early diabetes are likely to be chronic alcohol drinkers. In this study, OLETF rats were separated into prediabetic and early diabetic groups and treated with chronic alcohol consumption by the pair-fed method [192021]. The average calculated amounts of alcohol consumption in prediabetes and early diabetes were 10.62 and 10.33 g/kg/day. The total amount of alcohol was 700 g/day as converted from a 70 kg human. A recent meta-analysis found that the relative risk for type 2 diabetes was most protective when consuming ethanol at 22 g/d and deteriorated at just over 50 g/d [192022]. Chronic alcoholic liver disease and pancreatitis could be induced by administration of the Lieber-Decali liquid diet for 6 weeks in rats [20232425].
GRP73/BiP is an ER chaperone, and under normal or unstressed conditions is bound to the luminal domains of the three transmembrane proteins in the ER. Under stress conditions, GRP73 is released from these transmembrane proteins. In our study, when chronic alcohol was administered to prediabetics, expression of GRP78/BiP decreased slightly (but nonsignificantly) in the liver; it increased slightly (but nonsignificantly) in early diabetics. However, in the pancreas, its expression substantially increased in both prediabetics and early diabetics. This shows that the UPR of the liver in prediabetes is not stimulated by alcohol. In early diabetes, the liver demonstrates an adaptive process of the UPR to ER stress.
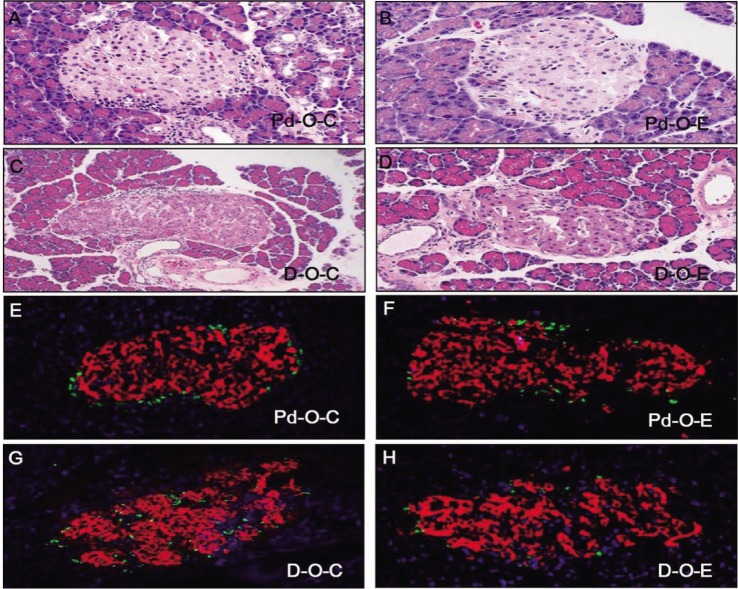
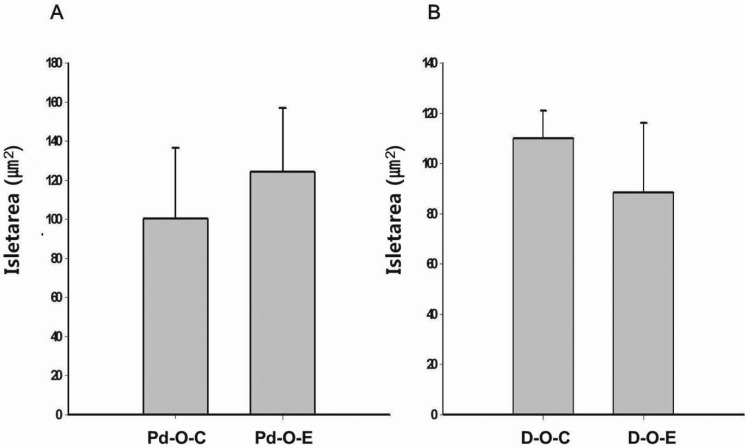
The PERK-elF2α-ATF4-CHOP pathway induces apoptosis in pancreatic beta cells [2627]. The mutation in PERK and elF2 kinase causes Wolcott-Rallison syndrome, which results in insulin-dependent diabetes mellitus at a young age and indicates that the PERK pathway is involved in diabetes mellitus. When phosphorylation of elF2α is inhibited in the PERK pathway, pancreatic beta cells are damaged, which is a known cause of diabetes mellitus [28]. The activated CHOP pathway can result in cell death in liver tissue [27]. In the present study, we found no elevation of ER stress in the liver as a result of chronic administration of alcohol during prediabetes. Alcohol administration to the liver during early diabetes stimulates the PERK-elF2α pathway, but has no effect on the CHOP pathway. Unlike liver tissue, administration of alcohol to the pancreas during prediabetes or early diabetes affects the PERK-elF2α pathway. In pancreatic tissue, CHOP/GADD153, which is the next step in the elF2α pathway, is unaffected during prediabetes but increases during early diabetes. Our data show that liver tissue stained with hematoxylin and eosin was not changed during prediabetes by chronic alcohol exposure. In early diabetes, the liver tissue exhibited lipid drop formation and severe changes in inflammation, but no cell death was demonstrated with heavy levels of alcohol. In prediabetes, chronic alcohol exposure affected the pancreas by morphologically increasing the size of the islets; in early diabetes, the islets exhibited an irregular shape and were destroyed compared to those not treated with alcohol. But, there were no significant differences between control group and ethanol group.
The ATF6 pathway inhibits insulin secretion in the pancreas [29]. The increase in ATF6 expression in pancreatic beta cells reportedly inhibits the expression of PDX-1, BETA2, RIPE3b1/MafA, and the insulin gene [29]. ATF6 inhibits phosphoenol-pyruvate carboxykinase (PEPCK) and glucose-6-phosphatase (G6Pase) by repressing cAMP response element binding protein activity [29]. Thus, because PEPCK and G6Pase are key hepatic gluconeogenic enzymes, this process decreases hepatic gluconeogenic gene expression and blood glucose levels. In the present study, there was a statistically significant increase in pancreatic ATF6 expression in prediabetes and early diabetes. Thus, blood fasting glucose levels can be reduced in early diabetes secondary to increased ATF6 expression in the liver. In prediabetes, however, further studies are needed to determine the cause of the decreased fasting glucose levels despite the absence of increased ATF6 expression in the liver. A possible explanation is that alcohol inhibits the production of new glucose from amino acids and other products by increasing the reduced/oxidized ratio of nicotinamide adenine dinucleotide [30].
The IRE1α/XBP-1 signaling pathway plays an important role in protein synthesis and secretion in healthy pancreatic cells and hepatocytes [63132]. ER stress induces the IRE1 α-JNK pathway and apoptosis [33]. Our data show that administration of alcohol causes no changes in IRE1α expression, but suppresses JNK expression in the prediabetic liver; however, we observed significantly increased IRE1α expression and significantly decreased JNK expression during early diabetes. Some studies have shown that the level of JNK decreases in the livers of alcohol-treated subjects [3435]. The suppression of JNK may reflect the nonapoptotic stress signaling process in the development of hepatic injury secondary to alcohol and obesity [35]. Meanwhile, the JNK pathway is reportedly associated with cell apoptosis, insulin gene expression, and PDX-1 DNA-binding ability [3637]. In this experiment, a slight increase in IRE1α levels and a significant increase in JNK levels were observed in the pancreas due to alcohol administration during prediabetes. IRE1α and JNK levels significantly increased in early diabetes.
In contrast to hepatocytes, pancreatic beta cells have a high susceptibility to H2O2 toxicity and other reactive oxygen species (ROS) because of low levels of catalase and glutathione peroxidase [38]. In addition, ROS produced via mitochondrial dysfunction are closely associated with increased ER stress. Chronic ER stress and activation of the UPR may also result in oxidative stress, causing toxic accumulation of ROS within the cell [39]. Moreover, the relationship between ER stress and oxidative stress is not one-sided because ROS generated through inflammation or damage to organelles (such as mitochondria) could accelerate ER dysfunction [40]. Alcohol causes β-cell apoptosis through mitochondrial dysfunction that is manifested by increased ROS and decreased ATP production [41]. Excessive ER stress triggers lipid accumulation and ROS production in various cell types, including beta cells and hepatocytes [38]. Therefore, alcohol-induced ROS may have a more deleterious effect on the pancreas than the liver.
ER stress caused by alcohol consumption occurs secondary to increased homocysteinemia and acetaldehyde levels as well as cytochrome P450 2E1 (CYP2E1) enzyme induction caused by alcohol. Alcohol consumption and the lack of folic acid activate CYP2E1, increase ER stress, and promote steatosis and apoptosis [424344454647]. A microarray examination of rats that received intragastric alcohol injections compared to pair-fed rats showed a change in gene expression of the ER stress response [48]. Therefore, we checked homocysteine levels, but the levels were not elevated in serum.
This study had some limitations. First, we could not separately evaluate the exocrine and endocrine functions of the pancreas. Therefore, our IPGTT data did not exactly demonstrate the effects of alcohol on pancreas endocrine function. Second, we did not evaluate the state of autophagy before apoptosis. Third, we did not assess the muscle, which is the main organ of insulin resistance. Nevertheless, our study demonstrates that chronic alcohol drinking can be harmful to glycemic control during prediabetes or early diabetes. Future studies of the effects of alcohol on adolescents and young adults should be performed.
Our results shed further light on the mechanisms of chronic alcohol consumption underlying adaptation of the UPR to ER stress and the proapoptotic pathway of the UPR to ER stress in prediabetes and early diabetes.
 XML Download