

 PDF
PDF ePub
ePub Citation
 Print
Print


INTRODUCTION
Lung cancer has been in the first place worldwide in respect of both incidence and mortality [1]. Among two classes of lung cancer, non-small cell (NSCLC) and small cell lung cancer (SCLC), the majority of lung cancer is NSCLC (about 85% to 90%) which grows slowly and is insensitive to chemotherapy, compared to SCLC. Platinum-based chemotherapy has been the most effective treatment for NSCLC. However, one of the difficulties to be faced during chemotherapy is the intrinsic and developed resistance to chemotherapeutic drugs, which leads to poor prognosis [2]. To avoid such resistance and take synergistic effect between drugs, combination therapy has been used for the last two decades, but long-term survival rate is not strikingly improved, yet.
Among 58 receptor tyrosine kinases (RTK), the TAM family includes three structurally related RTKs; Tyro-3 (also called Sky), Axl, and Mer [3]. All of them have same extracellular domains (each of two immunoglobin-like domains as well as fibronectin type III domains) and cytoplasmic domain with kinase activity [4]. Their ligand is also in common, which is vitamin K-dependent protein, growth arrest-specific 6 (Gas 6) [5]. TAM receptor-mediated signaling pathway has been reported to promote cell proliferation, inhibit apoptosis and be highly activated in cancer cells through overexpression of these RTKs as well as their ligands. Of note, overexpression of Axl, Mer, and/or Gas 6 was observed in various cancer cell lines and patient samples including acute leukemia [6], breast cancer [7,8], colorectal carcinoma [9], lung cancer [10], melanoma [11], ovarian cancer [12] and prostate cancer [13]. Therefore, TAM family members and their ligands are deeply involved in initiation, progression and physiology of cancer and could be potential biomarker for diagnosis and prognosis of cancer [14].
Epigallocatechin gallate (EGCG), one of the green tea polyphenols, has been known as an effective antioxidant, anti-inflammatory, anticancer agent. Many investigators have reported various underlying mechanisms that explain its cytotoxic effect; induction of apoptosis [15,16], modulation of cellular proteins such as P-glycoprotein [17,18] and the estrogen receptor [19], and direct binding with anti-apoptotic Bcl-2 family proteins such as Bcl-xL and Bcl-2 [20].
In this study, we provided another evidence that EGCG is capable of inhibiting the proliferation of both parental (chemo-sensitive) and their variant (chemo-resistant) lung cancer cells through downregulation of Axl and Tyro 3 receptor tyrosine kinases.
Go to : 
METHODS
Reagents and antibodies
Epigallocatechin gallate (EGCG) was from Sigma-Aldrich (St. Louis, MO, USA). Primers for Axl, Tyro 3, GAPDH were synthesized from domestic company, Bioneer Inc (Daejoun,Korea). TRI reagent was from Solgent (Daejoun, Korea). AmpliTaq DNA polymerase was obtained from Roche Inc (Indianapolis, IN). Enzyme-linked immunosorbent assay (ELISA) kit for Interleukin 6 (IL-6) was obtained from R&D Systems (Minneapolis, MN, USA). For Immunoblotting, specific antibodies against Axl, Tyro 3, GAPDH and secondary antibodies were obtained from Santa Cruz Biotechnology Inc (Dallas, TX, USA).
Cell culture
A549 and H460 cells were purchased from the American Type Culture Collection. Both cells were grown in RPMI 1640 (Gibco BRL, Grand Island, NY, USA) containing 10% FBS, 2 mM L-glutamine, 10 U/ml penicillin, and 10 g/ml streptomycin at 37℃ in 5% CO2 in a water-saturated atmosphere.
Establishment of cisplatin-resistant variant cells
The variants of A549 and H460 cells, A549/Cis and H460/Cis, which are cisplatin resistant of each cells, were established by stepwise exposure of the parental cells to escalating concentrations of cisplatin, ranging from 3 nM to 2 mM for more than 6 months.
RT-PCR
Cells (3×10⁵) were seeded in 60 mm culture dish and grown overnight at 37℃ and then treated with the indicated concentrations of EGCG for the 24 hours. Total RNA was extracted using TRI reagent and subjected to the cDNA synthesis and PCR. The specific primers were as follows: Axl, sense 5'-AACCTTCAACTCCTGCCTTCTCG-3' and antisense 5'-CAGCTTCTCCTTCAGCTCTTCAC-3'; Tyro3, sense 5'-GTGTGTGGCTGACTTCGGAC-3' and antisense 5'-CACGTCCTCCATACACTCCG-3'; GAPDH, sense 5'-GGAGCCAAAAGGGTCATCAT-3' and antisense 5'-GTGATGGCATGGACTGTGGT-3'.
Western blot analysis
Cells were treated with the indicated concentration of EGCG for 24 hours. Total cell lysates were prepared from those cells using lysis buffer (1% Triton X-100, 50 mM Tris (pH 8.0), 150 mM NaCl, 1 mM PMSF, 1 mM Na3VO4, and protease inhibitor cocktail). Protein concentrations were determined using Bio-Rad protein assays. Proteins from cell lysates (20~40 µg) were separated on 12% SDS-PAGE, and electrotransferred to nitrocellulose membranes. Membranes were blocked for 30 minutes at room temperature in Tris buffered saline-0.05% Tween-20 (TTBS) containing 5% non-fat dry milk, and then incubated with TTBS containing a primary antibody for 4 h at room temperature. After 3×10 min washes in TTBS, membranes were incubated with peroxidase-conjugated secondary antibody for 1 hr. Following 3 additional 10 min washes with TTBS, protein bands of interest were visualized using an enhanced chemiluminescence detection system (Amersham).
Clonogenic assay
Cells were seeded in 35 mm culture dishes (2×10³ cells/dish) and allowed to grow for 7 to 10 days in the presence of and/or absence of EGCG to form colonies. Colonies of more than 50 cells were visualized by crystal violet (in 60% methanol, Junsei Chemical, Japan) staining and images were taken by RAS 3000 Image Analysis System (Fuji Film, Japan).
Cell viability assay
The viability of cells was measured using Cell Counting Kit-8 assay kit (Dojindo Laboratories, Kumamoto, Japan). Cells (1×10³ cells/well) were seeded in 96 well plates and grown overnight at 37℃ and then treated with the indicated concentrations of EGCG for the 24 hours. At the end of treatment, 10 µl of CCK-8 solution was added and further incubated for 4 h. The absorbance at 450 nm was measured using a microplate reader (Model 680 microplate reader, Bio-Rad Laboratories). Values are the mean±SD for triplicate wells and normalized to that of control group to determine the % of viability.
ELISA
To determine IL-6 level, cells were incubated for 24 h in the presence or absence of EGCG. After treatment, conditioned media were harvested and assayed for IL-6 by ELISA according to the manufactures' protocol. The data are the representative of at least three independent experiments.
Statistical analysis
Data are expressed as the mean±SD of triplicate samples or at least three independent experiments. To determine statistical significance, Student's t-test was used with a threshold of p values which is less than 0.05.
Go to :
RESULTS
Long-term cisplatin exposure results in acquisition of resistance in human lung cancer cells
Emergence of resistance during chemotherapy is a chief obstacle in effective cancer treatment [2]. To understand the underlying mechanism of cisplatin resistance, we established the cisplatin resistant human lung cancer cells, A549/Cis and H460/Cis, by exposure of parental A549 and H460 cells to gradually escalating concentrations of cisplatin for more than 6 months, respectively. Chemoresistance of A549/Cis and H460/Cis was assessed by survival ability of these cells and their parental cells upon cisplatin treatment. Both cisplatin-sensitive parental cells and cisplatin-resistant cells were treated with 3, 10, or 30 µM cisplatin for 24 h and cell viability was measured by CCK-8 assay. As shown in Fig. 1A, viability of both sensitive and resistant cell was decreased in dose-dependent manner. However, upon higher than 10 µM cisplatin, the parental lung cancer cells, A549 and H460, were more sensitive than their variants, A549/Cis and H460/Cis, with acquired chemo-resistance.
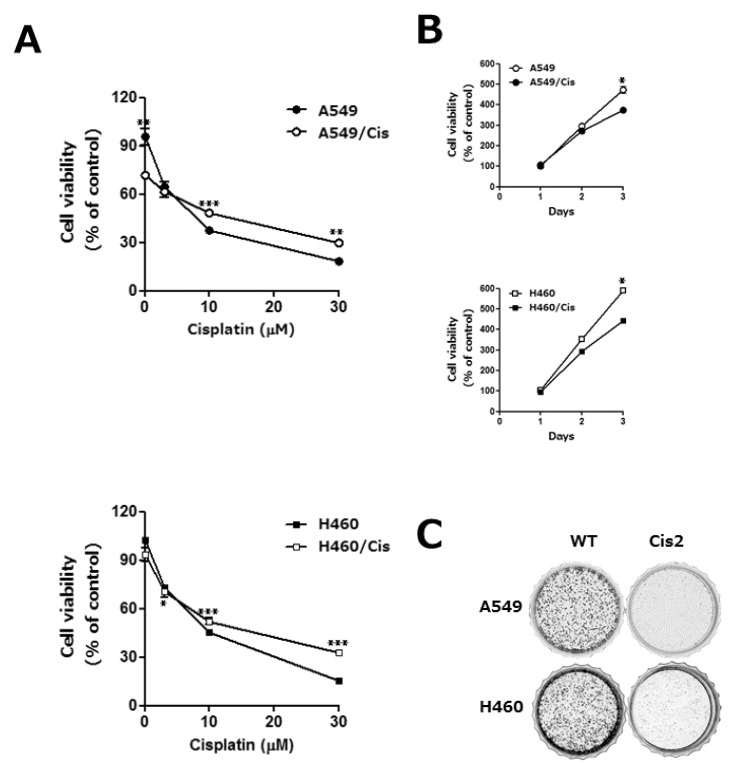 | Fig. 1The acquisition of cisplatin resistance results in the reduction of proliferative capability in human lung cancer cells. A549 and H460 cells were exposed to increasing concentrations of cisplatin in a stepwise manner, which resulted in the development of their variants with cisplatin resistant, A549/Cis and H460/Cis, respectively. (A) Both parental, A549 and H460, and each of chemoresistant variants, A549/Cis and H460/Cis, were treated with the indicated concentrations of cisplatin for 24 h. Cell viability was measured by CCK-8 assay. Each error bar represents mean±SD of at least three independent experiments. The asterisks indicate the significant difference compared to the control value (*p<0.05 H460 vs H460/Cis at 3 µM cisplatin, **p<0.01 A549 vs A549/Cis at 0, 30 µM cisplatin, ***p<0.001 A549 vs A549/Cis at 10 µM cisplatin and H460 vs H460/Cis at 10, 30 µM cisplatin). (B) Cells (1×10³ cells/well) were seeded onto 96-well plates and allowed to grow for 72 h. The proliferation rate was determined by CCK-8 assay. Data are expressed as mean±SD from three independent experiments. Data are expressed as mean±SD of three independent experiments. The asterisks indicate the significant difference compared to the control value (*p<0.001 A549 vs A549/Cis and H460 vs H460/Cis at day 3) (C) Cells (2×10³ cells/dish) were seeded onto 35 mm dishes and allowed to grow for 7 to 10 days until to form colonies. The colonies were visualized by crystal violet staining. The data shown is representative of at least three independent experiments.
|
Acquisition of cisplatin resistance gives rise to the reduction of proliferative capability
Next, characteristics of the established cisplatin resistant cells were examined. We found that cell growth rate of both A549/Cis and H460/Cis was slightly decreased, compared to that of their parental A549 and H460 cells, respectively (Fig. 1B). Reduction of proliferative capability of cisplatin resistant cells was further confirmed by colony-forming assay. As shown in Fig. 1C, clonogenicity of both A549/Cis and H460/Cis was significantly decreased. In addition, the size of those colonies as well as the number of cells per colony was also much smaller than that of parental cells. These results indicate that the prolonged population doubling time of cisplatin resistant cells is one of the characteristics accompanying with development of drug resistance.
EGCG inhibits proliferation of both parental and cisplatin resistant cells
Since epigallocatechin gallate (EGCG), a well-known phytochemical of green tea, has been found to have anti-proliferative effect on various cancer cells [21], we inquired if it could exert cytotoxic activity against cisplatin resistant cells. EGCG treatment reduced the viability of both parental and cisplatin resistant cells in dose-dependent manner (data not shown). Treatment of 80 µM EGCG for 24 h resulted in only 78% (A549), 29% (A549/Cis), 67% (H460), and 40% (H460/Cis) survival of cells, respectively (Fig. 2A). It is noteworthy that cytotoxic activity of EGCG seems to be more efficient in cisplatin resistant cells. Colony-forming assay further ascertained anti-proliferative effect of EGCG on lung cancer cells. As shown in Fig. 2B, the parental cells, A549 and H460, as well as cisplatin resistant cells, A549/Cis and H460/Cis, almost failed to grow into colony in the presence of EGCG. These data indicate that EGCG inhibits proliferation and colony formation of lung cancer cells, regardless of responsiveness to cisplatin.
 | Fig. 2EGCG inhibits proliferation of both parental and cisplatin resistant lung cancer cells. (A) Cells (3×10³ cells/dish) were seeded onto 100 mm dishes, grown overnight and treated with 80 µM EGCG for 24 h. After treatment, cells were harvested, stained with tryphan blue, and the number of viable cells was counted. Data are represented as mean±SD of at least three independent experiments. The asterisks indicate the significant difference compared to the control value (*p<0.005 A549 vs A549/Cis and **p<0.0001 H460 vs H460/Cis at 80 µM EGCG). (B) Cells (2×10³ cells/dish) were seeded onto 35 mm dishes and allowed to grow in the absence or presence of 80 µM EGCG for 7 to 10 days. The colonies were visualized by crystal violet staining. The data shown is representative of at least three independent experiments.
|
IL-6/STAT 3 axis is not associated with the anti-proliferative effect of EGCG
Signal transducers and activators of transcription (STAT) family proteins play a critical role in tumor cell growth, proliferation and metastasis [22]. In almost 50% of lung cancers, constitutive STAT3 activation is observed and known to be resulted from the increased expression of upstream effectors including interlukine-6 (IL-6) [23]. We examined if the inhibition of lung cancer cell growth by EGCG is related to its regulatory effect on IL-6 expression and concomitant STAT3 phosphorylation. Enzyme-linked immunosorbent assay (ELISA) result showed that total amount of IL-6 in culture media was a bit decreased by EGCG treatment (data not shown), whereas IL-6 output per cell was increased, especially in the case of cisplatin resistant A549/Cis cells (Fig. 3A). We next found that EGCG treatment had no effect on phosphorylation status of STAT3 in both parental and cisplatin resistant cells (Fig. 3B). Consistent with the increased IL-6 production from single cell, STAT3 phosphorylation was also fairly increased in cisplatin resistant cells. Taken together, these results indicate that IL-6/STAT3 signaling pathway is not involved in EGCG-induced growth inhibition.
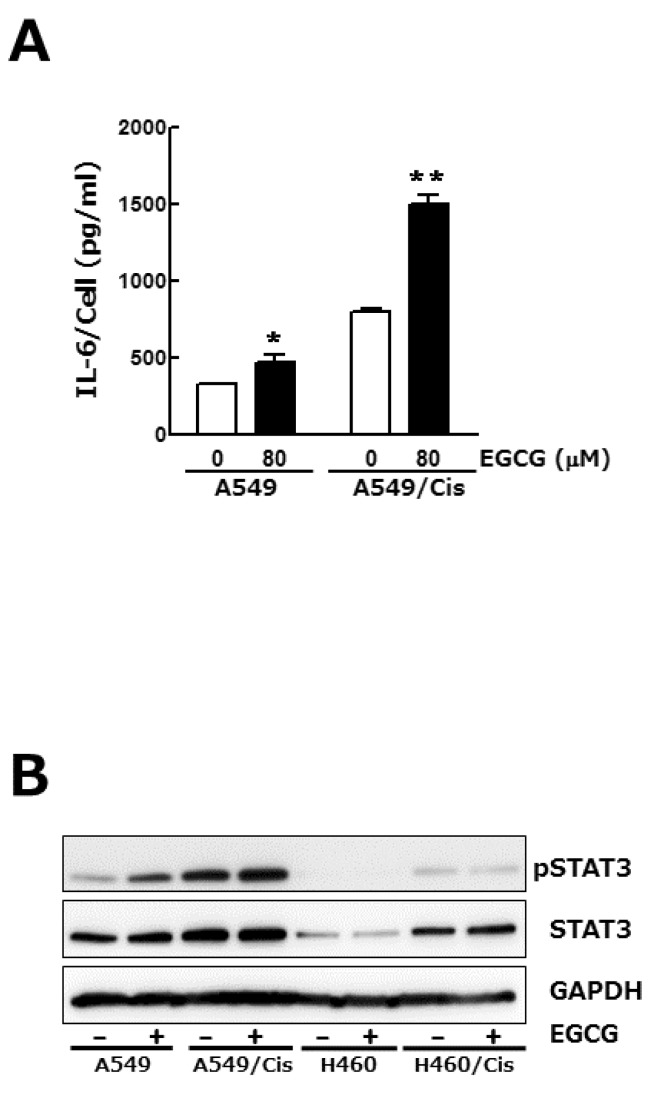 | Fig. 3IL-6/STAT 3 axis is not associated with the anti-proliferative effect of EGCG. Cells (3×10³ cells/dish) were seeded onto 100 mm dishes, grown overnight and treated with 80 µM EGCG for 24 h. (A) Conditioned media were harvested and used for IL-6 ELISA. To assess its production per cell, the total amount of IL-6 was normalized by the number of viable cells. Results are from three independent experiments. Data are expressed as the mean±SD of triplicate samples conducted in three independent experiments. The asterisks indicate the significant difference compared to the control value (*p<0.05 A549 vs A549/EGCG and **p<0.001 A549/Cis vs A549/Cis/EGCG). (B) In parallel, Western blot analysis was conducted to determine the phosphorylation status of STAT3. The level of total STAT3, an internal control, and of GAPDH, a loading control, was also detected. The data shown is representative of three independent experiments.
|
EGCG inhibits the expression of Axl and Tyro 3 receptor tyrosine kinases
Since TMA family of receptor tyrosine kinases (RTK), Axl, tyro3, and Mer has known to transduce cell survival, growth and migratory signal, we then explored if EGCG affects the expression of receptor tyrosine kinases. Among TAM family members of RTK, both Axl and tyro3 expression were examined at protein and mRNA level after exposure of cells with 80 µM EGCG for 24 h. Western blot analysis showed that EGCG treatment caused significant reduction of both Axl and Tyro3 protein level in both parental and cisplatin-resistant cells (Fig. 4A). Down-regulation of Axl and Tyro3 expression in EGCG-treated cells was further confirmed by RT-PCR. As shown in Fig. 4B, the mRNA levels of Axl and Tyro3 were decreased by EGCG treatment, which is consistent with Western blot results. Of note, both Axl and Tyro 3 expression in cisplatin resistant cells was pretty reduced, compared to that in their parental cells, indicating that long-term exposure of cells to cisplatin resulted in the downregulation of Axl and Tyro 3 expression.
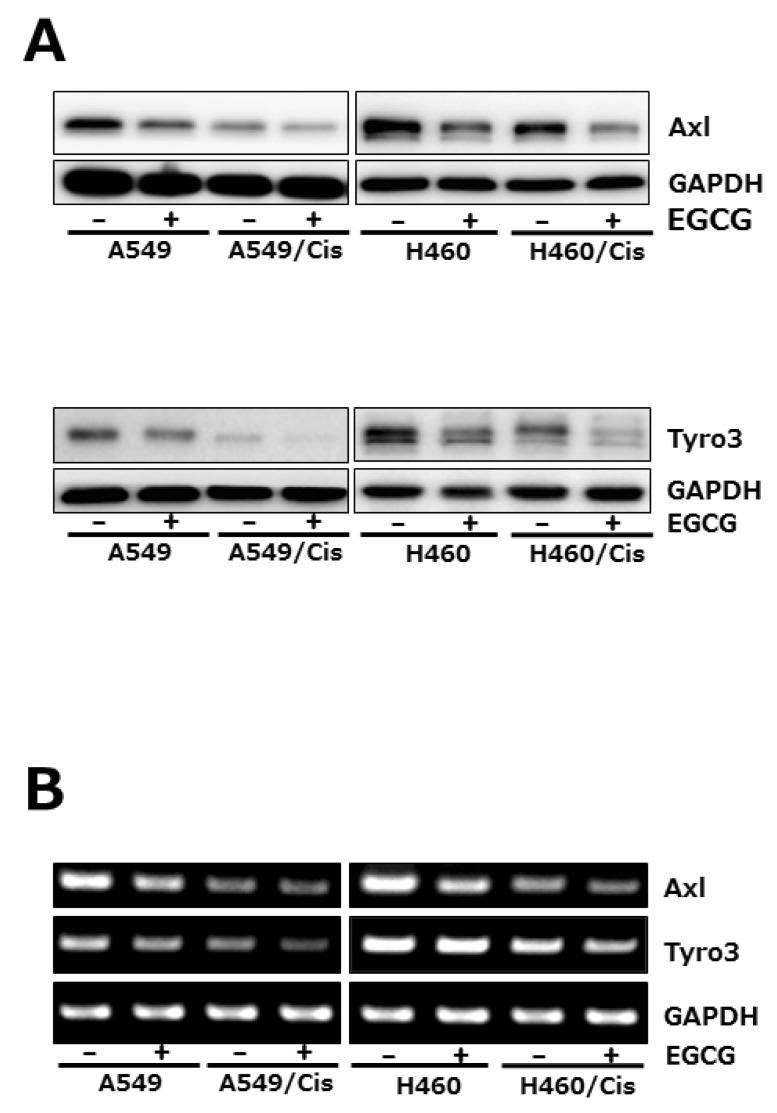 | Fig. 4EGCG suppresses the expression of Axl and Tyro 3 RTKs. Cells (3×10³ cells/dish) were seeded onto 100 mm dishes, grown overnight and treated with 80 µM EGCG for 24 h. (A) The protein level of Axl and Tyro 3 was assessed by Western blot analysis to determine the effect of EGCG on their expression. GAPDH was used as a loading control. Results are from three independent experiments. (B) For RT-PCR, total RNAs from those cells were isolated and used for analysis of Axl and Tyro 3 mRNA expression. The level of Axl and Tyro 3 mRNA was normalized to that of GAPDH. The data shown is representative of three independent experiments.
|
Go to :
DISCUSSION
Cisplatin-based chemotherapy is still the first line therapeutic treatment for lung cancer [24]. However, the intrinsic and acquired resistance to cisplatin limits its anti-tumor efficacy [2]. To understand the characteristics of acquired resistance and molecular mechanisms involved in the acquisition process, we developed the cisplatin resistant non-small cell lung cancer (NSCLC) cells, A549/Cis and H460/Cis, as a variant of each parental cell. In addition to resistance to cisplatin, the growth rate of these resistant cells was found to be rather slower than that of their parental cells, indicating that the population doubling time (PDT) lengthened as a consequence of long-term exposure and such prolonged PDT seems to be a strategy to survive under cisplatin.
Several studies have demonstrated the synergistic cytotoxic effect of EGCG in combination with the selected anti-cancer agents such as cisplatin, oxaloplatin, paclitaxel, or 5-fluorouracil on various cancers [25-27]. Especially, a recent report showed that co-treatment of EGCG and sulforaphane induced apoptosis of paclitaxel-resistant ovarian cancer cells, which suggest that EGCG could be a useful phytochemical to overcome chemo-resistance. Consistent with these reports, we also found that EGCG treatment was able to inhibit proliferation of both parental and cisplatin resistant lung cancer cells.
Signal transducers and activators of transcription (STAT) proteins have been known to be constitutively activated in various tumors [22], which were resulted from the elevated level of upstream effectors such as interlukine-6 (IL-6) [28]. We found that EGCG increased IL-6 production per cell, but did not affect STAT3 phosphorylation, suggesting that IL-6/STAT3 signaling pathway is not associated with anti-proliferative effect of EGCG. However, our results that IL-6 production from single cell as well as STAT3 phosphorylation was pretty increased in cisplatin resistant cells suggest that activation of IL-6/STAT3 axis seems to be one of the survival mechanisms which was developed during resistance acquisition.
Among TAM family members, Tyro3, Axl and Mer, overexpression of Axl, initially identified as an oncogene of human leukemia cells [29,30] has been reported in many cancers. Of note, the expression of Axl, Mer, and their ligands was found to be increased in more than half of NSCLC cell lines [31,32]. A clinical importance of Axl was also suggested by the data that in 48.3% of lung adenocarcinoma tissues, Axl level was high and proportional to lymph node metastasis as well as disease stage [10]. Furthermore, targeting of Axl with RNA interference or specific monoclonal antibodies has been shown to inhibit proliferation of NSCLC cells and even tumor cells growth in mouse xenograft model [33]. We found that Axl expression was suppressed in cisplatin resistant cells, explaining their reduced proliferative capability. Next, we also observed for the first time, EGCG treatment suppressed Axl expression at transcriptional level, indicating that such inhibitory effect of EGCG on Axl expression seems to be associated with its cytotoxicity in both parental and chemo-resistant lung cancer cells. Last year, two groups of investigators reported at the same time that development of resistance to EGFR inhibitor such as erotinib is resulted from Axl activation in NSCLC [34,35]. Consistent with these reports, proliferation rate of cisplatin resistant cells, A549/Cis and H460/Cis, of which Axl expression was down-regulated, was found to be reduced. In addition, EGCG treatment further suppressed Axl expression in both parental and chemo-resistant cells, resulting in the inhibition of both cells' proliferation, which corresponds to the reversal of chemo-resistance in the case of cisplatin resistant cells, A549/Cis and H460/Cis.
In conclusion, our data demonstrate that EGCG is cytotoxic to both chemo-sensitive and chemo-resistant lung cancer cells and the down-regulation of Axl and Tyro 3 expression by EGCG was found to be an underlying mechanism to mediate its anti-proliferative effect on lung cancer cells.
Go to :
 XML Download