

 PDF
PDF ePub
ePub Citation
 Print
Print


INTRODUCTION
The salivary gland is an exocrine organ that secretes saliva. The secretion of fluid and electrolytes requires the coordinated regulation of membrane transporters, receptors, and ion channels [1]. It has been well known that fluid secretion is activated by an increase in intracellular free calcium concentration ([Ca2+]i) in salivary gland acinar cells [2,3,4].
Transient receptor potential (TRP) family channels are non-selective cation channels that are involved in multiple cellular functions. Transient receptor potential vanilloid subtype 1 (TRPV1) is a member of the TRP family, which can be activated by capsaicin (CAP), heat (>43℃), or acidic conditions [5,6,7,8]. TRPV1 was originally found in nociceptive neurons, but recent evidence indicates that TRPV1 is also expressed in various non-neuronal cells, such as bronchial epithelial cells [9], keratinocytes [10], synovial fibroblasts [11], and salivary glands [12,13,14].
It has been reported that TRPV1 is expressed in both rabbit and rat submandibular glands (SMG), and that capsaicin promoted salivary secretion partly by an increase in paracellular permeability [14,15]. Previously, we have reported that capsaicin induces anti-inflammatory effects in HSG cells [16]. The capsaicin-induced anti-inflammatory effects were not mediated by TRPV1, but by inhibition of NF-κB pathway. However, the study for capsaicin-induced Ca2+ response mediated by TRPV1 in salivary gland epithelial cells (SGEC) has not been rigorously studied. The functional role of TRPV1 in salivary secretion is also unclear. Therefore, in this experiment, we have investigated the expression of TRPV1 in SGEC, and its physiological role in salivary secretion in relation with [Ca2+]i response.
Go to : 
METHODS
Reagents
Capsaicin, carbachol, and pilocarpine (Sigma Aldrich, St.Louis, MO, USA), Fura-2/AM (Molecular Probes, Eugene, OR, USA), TRPV1 antibody (Abcam, Cambridge, UK; Santa Cruz Biotechnology; Santa Cruz, CA), AQP5 antibody (Abcam, Santa Cruz Biotechnology), Alexa Fluor® 594 donkey anti-rabbit IgG and Alexa Fluor® 488 donkey anti-goat IgG (Invitrogen Corporation, Carlsbad, CA, USA), and normal donkey serum (Jackson ImmunonoResearch, West Grove, PA, USA), were used in this study.
Cell Preparation
Primary cultures of mSMG were prepared as previously described [16]. TRPV1-/- mice were obtained from the Jackson Laboratory (Bar Harbor, ME, USA). All procedures were conducted in accordance with the Institutional Animal Care and Use Committee at the School of Dentistry, Seoul National University (120417-2). The dissociation of primary hSMG cells was performed as described in a previous publication [17]. hSMG tissue was acquired from patients who had SMGs resected as a treatment for a range of oral tumors. After surgical excision, the glands were immediately placed in cold (4℃) physiological saline and transported to the laboratory for processing.
Cell Culture
The HSG cells were a generous gift from Professor Kazuo Hosoi in Tokushima University in Japan. The cells were grown in suspension using 10-ml tissue culture plates at 37℃ in 95% air-5% CO2 and were maintained in a minimum essential medium supplemented with 10% fetal bovine serum. Each plate was refreshed twice a week. The rat SMG cell line SMG-C6 was cultured as described in a previous publication [14].
Reverse-transcriptase-polymerase chain-reaction
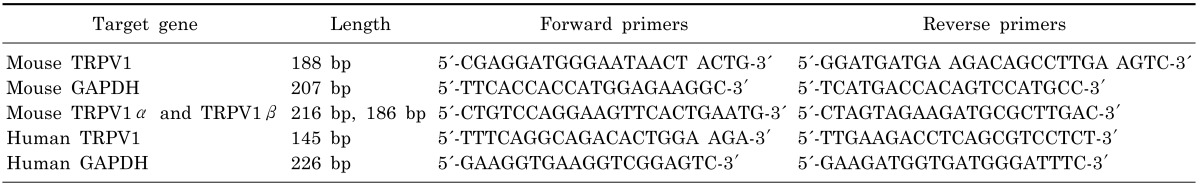
Total RNA was extracted from mouse dorsal root ganglion (DRG), mSMG, hSMG, and HSG cells with Trizol (Invitrogen Corporation). Reverse transcriptase with an oligo-dT primer (Invitrogen Corporation) was used to prepare cDNA from 1 µg of total RNA. PCR with specific primers was performed with 1 µL of cDNA. PCR conditions were as follows: 35 cycles of denaturation at 95℃ for 30 sec, annealing at 55℃ for 30 sec, extension at 72℃ for 30 sec, and a final step at 72℃ for 10 min. The primers used are listed in Table 1.
Quantitative Real-time PCR
Total RNA was extracted from DRG and SMG in mice with Trizol (Invitrogen) according to the manufacturer's protocol. One microgram of total RNA was converted to cDNA with Superscript II rervese transcriptase (Invitrogen) and oligo-(dT) primers according to the manufacturer's protocol. Quantitative real-time PCR was performed in a reaction containing cDNA and SYBR PCR master mix (Applied BioSystems, Foster City, CA, USA). Samples were analyzed with the ABI PRISM 7500 sequence detection system (Applied BioSystems). All PCRs were performed in triplicate, and the specificity of the reaction was determined by melting curve analysis at the dissociation stage.
Western Blotting
Cultured cells were collected and protein concentration was measured by means of a BCA protein assay kit (Pierce, Rockford, IL, USA) with bovine serum albumin as standard. Protein samples were separated by 8% SDS-PAGE (Bio-Rad, Hercules, CA, USA). After electrophoresis in a Power-PacTM Basic system (Bio-Rad), the proteins were transferred to nitrocellulose membranes (Whatman, Dassel, Germany). The membranes were blocked with 10% non-fat milk (Seoul-milk, Seoul, Korea) and probed with the following antibodies, anti-TRPV1 antibody (1:200) (Santa Cruz Biotechnology), (1:1000 dilution) (Abcam), then incubated with HRP-conjugated secondary antibody (Santa Cruz Biotechnology). The immunoreactive protein was visualized by ECL reagent (iNtRON Biotechnology, Sungnam, Korea).
Immunofluorescence
mSMG and hSMG were fixed with 4% paraformaldehyde for 3h. The tissues were rinsed and dehydrated in ethanol followed by xylene, embedded in paraffin, and cut at a thickness of 5µm. Dewaxed paraffin sections of SMGs were pretreated with 0.5% pepsin for 10 min for antigen retrieval. HSG cells were fixed, permeabilized, and blocked as previously described [18]. mSMG, hSMG, and HSG cells were incubated at 4℃ overnight with primary antibody (1:200), then secondary antibody (1:200) for 1 hr at 37℃. Nuclei were stained with 4,6-diamidino-2-phenylindole. Fluorescence images were captured by confocal microscopy (LSM 700, Carl Zeiss, Japan). Normal donkey IgG was used as a negative control.
Measurement of intracellular free calcium concentration ([Ca2+]i)
[Ca2+]i was determined with the fluorescent Ca2+ indicator Fura-2/AM as previously described [17]. Briefly, the cell suspension was incubated with solution containing Fura-2/AM (2 µM) for 30 min at room temperature. Fluorescence ratios were monitored with dual excitation at 340 and 380 nm, and emission at 510 nm. The MetaFluor®version 6.1 imaging system (Universal Imaging, West Chester, PA, USA) was used for recording and analysis.
Saliva Collections
Mice were anesthetized with sodium pentobarbital (50 mg/kg, i.p.). Whole saliva was stimulated with PILO (2 mg/kg, i.p.) alone or PILO+CAP (3 µg/kg, i.p.) as described previously [19]. Salivation generally occurred in less than 3 min. Saliva was collected in Eppendorf tubes every 5 min for 15 min using a micropipette with a yellow tip. Mice were positioned on their side with the head slightly downward to facilitate pipetting every 10~5 sec.
Transepithelial electrical resistance (TER) measurement
Confluent monolayers of SMG-C6 cells were grown in 24-well Transwell™ chambers (polycarbonate membrane, filter pore size: 0.4 mm; filter area: 0.33 cm2; Costar, USA) for 5~7 days. TER was measured at 37℃ using an epithelial volt ohm meter (EVOM; WPI, FL, USA) as described previously [20]. The background value of the blank filter (90 Ω) was subtracted, and all measurements were performed on a minimum of three wells.
Statistics
All experiments were conducted in triplicate. Statistical analysis was performed by paired Student t test with Graph Pad Prism5 software (GraphPad Software, Inc., La Jolla, CA, USA). All data are presented as means±SD. p<0.05 was considered statistically significant.
Go to :
RESULTS
Expression of TRPV1 in mouse and human salivary glands
We first examined whether TRPV1 genes are expressed in mouse DRG, mSMG, hSMG, and HSG cells using RT-PCR. The mRNA transcripts of TRPV1 were detected from DRG and SMG in mice (left panel in Fig. 1A) as well as in hSMG and HSG cells (right panel in Fig. 1A). In this experiment, mouse DRG was used as positive controls. We also performed Western blot analysis to confirm TRPV1 expression at the protein level in these tissues. A band with a molecular mass of approximately 95 kDa corresponding to TRPV1 from mSMG (left panel in Fig. 1B), and hSMG and HSG cells was found (right panel in Fig. 1B). However, the expression levels of TRPV1 were different between DRG and SMG in mice. Our real-time PCR data shows 1.067±0.025 (n=4) and 0.169±0.018 (n=4) in DRG and SMG, respectively (Fig. 1C). The results demonstrate that expression level of TRPV1 in mSMG is very low compared to that of DRG.
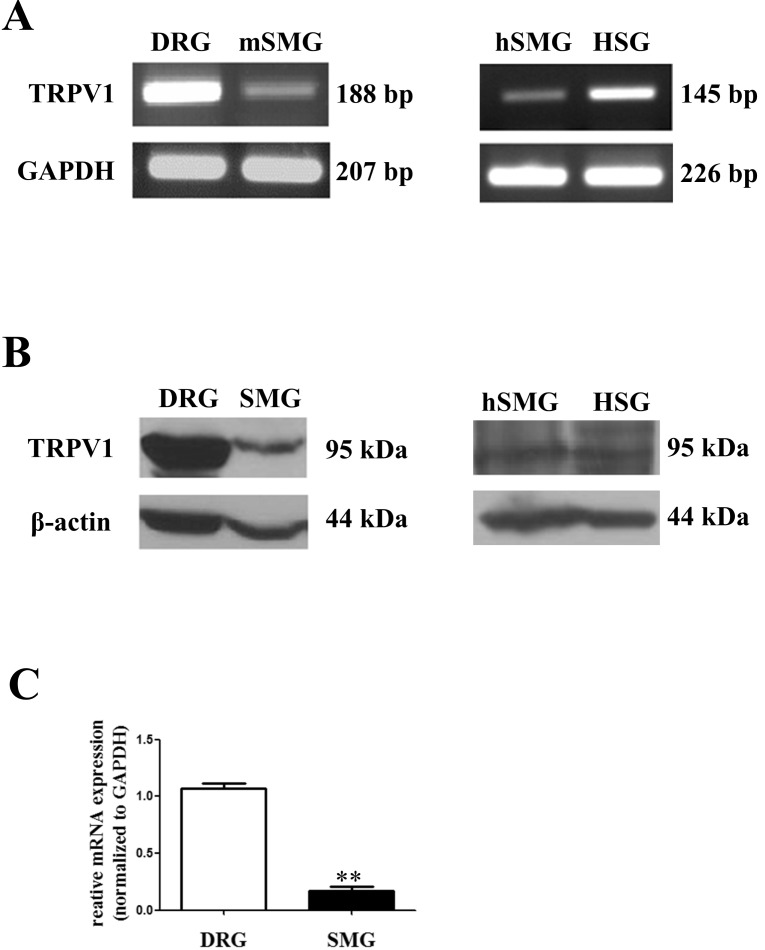 | Fig. 1Expression of TRPV1 in salivary gland epithelial cells (SGEC). (A) Expression of TRPV1 mRNA in mouse SMG (mSMG), human SMG (hSMG), and HSG cells by RT-PCR, with GAPDH as an internal control. (B) Expression of TRPV1 protein in mSMG, hSMG, and HSG cells by Western blot. Approximately 50 µg of protein was separated on 8% SDS-polyacrylamide gel electrophoresis and TRPV1-immunoreactivity was determined using a polyclonal anti-TRPV1 antibody. The blot is representative of five separate experiments with similar results. (C) Quantitative analysis of TRPV1 between DRG and SMG in mice by real-time PCR. TRPV1 mRNA levels are represented as ratios to the mRNA level of the housekeeping gene, GAPDH. Results are presented as mean±SD (n=4, **p<.001).
|
Distribution of TRPV1 in mouse and human salivary glands
We then studied location of TRPV1 using confocal microscopy. Fig. 2A shows TRPV1 proteins in mSMG (green color). TRPV1 was mainly detected at the apical membrane in acinar cells and at the basolateral membrane in ductal cells. We used AQP5 as a marker for acinar cells that was exclusively expressed in the apical membrane of acinar cells (red color). Thus, the merged orange color in Fig. 2A indicates that expression of TRPV1 at the apical membrane in acinar cells. In hSMG, TRPV1 was not expressed in acinar cells (Fig. 2B). Only AQP5 was expressed at the apical membrane of acinar cells. While, TRPV1 was expressed diffusely in cytosol in the ductal cells (green color). In HSG cells, TRPV1 was also diffusely located at the membrane and in the cytoplasm (Fig. 2C). Normal donkey IgG was used as a negative control (data not shown).
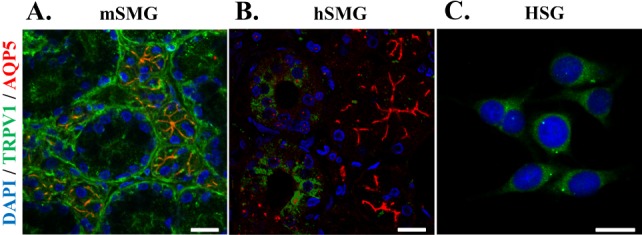 | Fig. 2Distribution of TRPV1 in salivary gland epithelial cells (SGEC). Representative immunofluorescence labeling of TRPV1 in mSMG (A), hSMG (B), and HSG cells (C). SMGs sections and HSG were immunostained with anti-TRPV1 antibody and AQP5 antibody, then incubated with Alexa Fluor-linked anti-rabbit IgG (red) and Alexa Fluor-linked anti-goat IgG (green). Nuclei (blue) were labeled with 4,6-diamidino-2-phenylindole. (A) TRPV1were mainly detected in apical membrane in acinar cells and in basolateral membrane in ductal cells. AQP5 was used as a marker for acinar cells that was exclusively expressed in the apical membrane of acinar cells (red color). The merged orange color indicates that expression of TRPV1 at the apical membrane in acinar cells. (B) In hSMG, higher expression levels of TRPV1 was observed in ductal cells compared to acinar cells. (C) In HSG cells, TRPV1 was widespread in the cytoplasm. Scale bar indicates 20 µm. The results are representative of four independent experiments.
|
Calcium response of TRPV1 to capsaicin in mouse and human salivary glands
It is well known that activation of TRPV1 results in the elevation of intracellular free calcium concentration ([Ca2+]i) via calcium influx [5]. Thus, we examined Ca2+ mobilization mediated by TRPV1 in these cells. In mouse DRG, 1 µM capsaicin (CAP) markedly increased [Ca2+]i. After the [Ca2+]i peak, [Ca2+]i was sustained at a plateau, which was higher than basal levels for about 2 min (Fig. 3A). In contrast, the same concentration of CAP did not evoke [Ca2+]i increase in mSMG acinar cells (Fig. 3B). 10 µM CAP has little effect on [Ca2+]i, either (Fig. 3Ba). Neither acidic condition (pH 5.4) nor heating, raising temperature from 37℃ to 42℃ in bath solution, evoked [Ca2+]i increase (Figs. 3Bb, 3Bc). We confirmed that the cells we tested are healthy, since 10µM carbachol (CCh) consistently increased [Ca2+]i in these cells. The effect of CAP on [Ca2+]i in hSMG acinar cells and HSG cells were similar to those in mSMG (Fig. 3C, D). In most of the cells, capsaicin had little effect on the [Ca2+]i in hSMG. The results demonstrate that CAP did not evoke an increase of [Ca2+]i in acinar cells from mSMG, hSMG, and HSG cells we have tested.
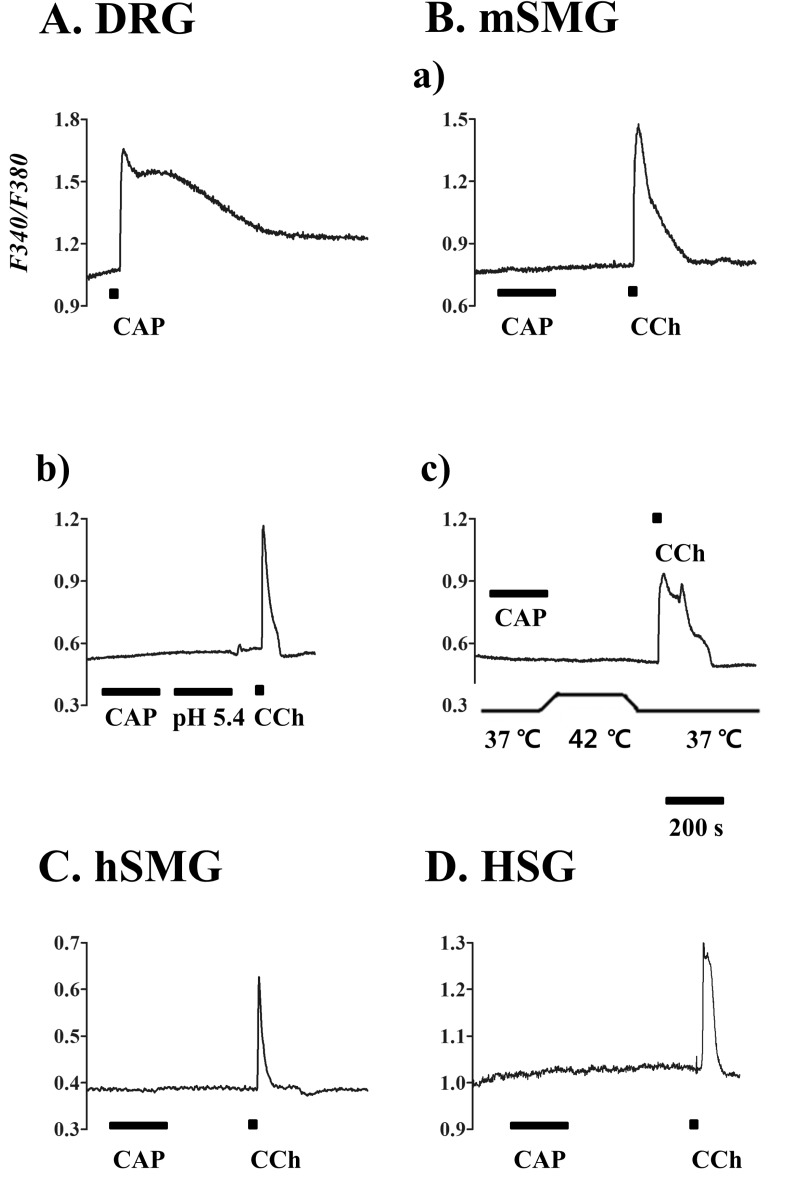 | Fig. 3Calcium response to capsaicin in salivary gland epithelial cells (SGEC). [Ca2+]i responses induced by capsaicin (CAP) in mouse dorsal root ganglion (DRG) (A), mSMG (B), hSMG (C), and HSG cells (D). (A) CAP 1 µM in DRG as positive control. (B) CAP 10 µM (a), acidic solution with pH 5.4 (b), and hot temperature of 42℃ (c) in the acinar cells from mSMG. CAP 10 µM in the acinar cells from hSMG (C) and HSG cells (D). It is of note that 10 µM carbachol (CCh) applied at the end of each experiment consistently increased [Ca2+]i. Data for each trace were obtained from ≥30 cells in at least 5 separate experiments.
|
Effect of capsaicin on salivary secretion and TRPV1 splice variants expression
We further investigated the role of TRPV1 in salivary secretion. Pilocarpine (PILO) was administered by intraperitoneal injection in wild-type and TRPV1 knock-out mice. There was no significant difference in salivary flow rate between wild-type and TRPV1 knock-out mice upon PILO stimulation (Fig. 4A). Next, we investigated the effect of capsaicin on salivary secretion; PILO alone or PILO plus CAP was administered by intraperitoneal injection. The PILO-induced salivary flow rate was used as a positive control. In each period, salivary flow rate showed insignificant change in mice treated with PILO plus CAP compared with that in mice treated with PILO alone (Fig. 4B). The results demonstrate that capsaicin did not affect saliva secretion.
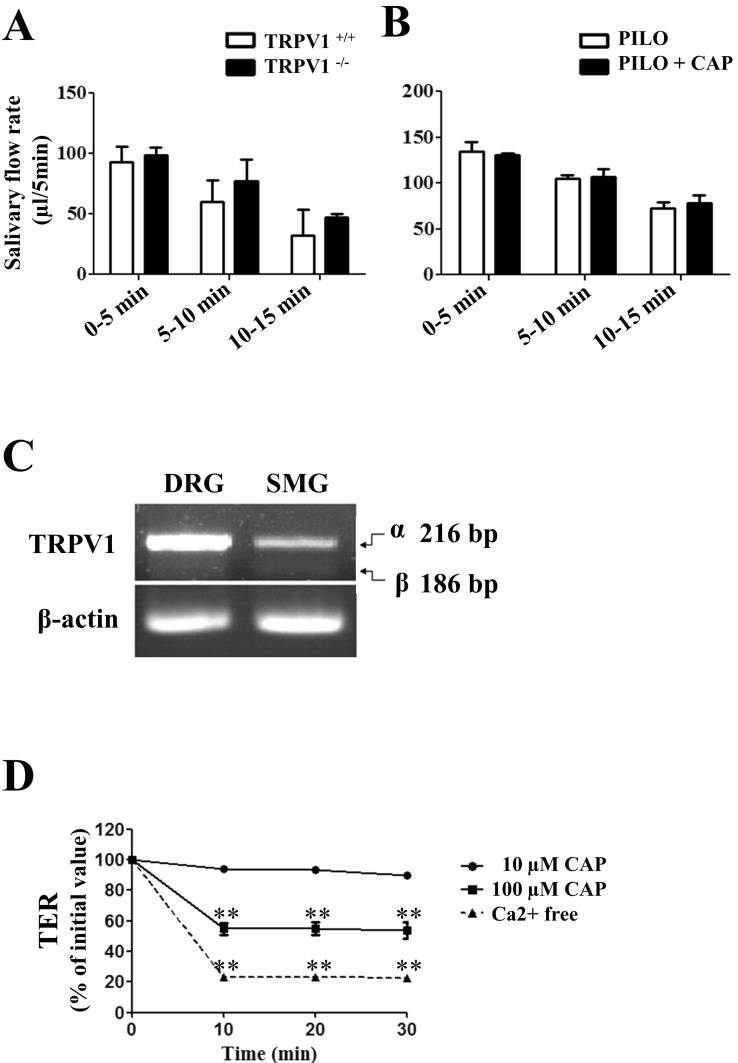 | Fig. 4Effect of capsaicin on salivary secretion and TRPV1 splice variants expression. (A) To measure the whole saliva volume, pilocarpine (PILO) was administered by i.p. injection in wild-type and TRPV1 knock-out mice. (B) PILO alone (white columns) or PILO+CAP (dark columns) were administered by i.p. in wild-type mice. Data are shown as mean±SD for collections made on four mice in each group. Statistically insignificant differences are shown between columns. (C) Expression patterns of α and β isoforms of TRPV1 in mouse DRG and mSMG by RT-PCR. The mRNA transcripts of 216 bp and 186 bp corresponding to TRPV1 isoforms were detected. The upper band represents TRPV1α, while lower band denotes TRPV1β. Data are representative of four independent experiments. (D) Decrease of paracellular permeability in SMG-C6 cells by CAP application. Time course of TER was measured using an EVOM. Although 10 µM CAP had no effect on TER values, the high concentration of CAP, 100 µM, evoked a significant decrease in TER from 10 to 30 min (n=3, **p<.001). Incubation of cells in a Ca2+-free medium, as a positive control, caused a decrease in TER values from 10 to 30 min (n=3, **p<.001).
|
TRPV1β, which is a splice variant of mouse TRPV1, negatively regulates TRPV1 channel activity [21]. Thus, we examined the expression patterns of TRPV1α and TRPV1β in mSMG. The two splice variants of TRPV1 were 216 bp and 186 bp, respectively. As shown in Fig. 4C, DRG and mSMG expressed TRPV1α. TRPV1β was barely detectable from both DRG and mSMG. The relative levels of TRPV1β were low as compared with that of TRPV1α in DRG. mSMG also expressed a relatively high proportion of TRPV1α, suggesting that failure of [Ca2+]i response by TRPV1 activation does not appear due to the dominant expression of TRPV1β in mSMG. Finally, we evaluate the effect of TRPV1 activation via paracellular pathway using TER measurement [20,22]. 10 µM CAP did not induce any change to TER values within 30 min, but 100 µM CAP evoked a significant drop in TER values from 10 to 30 min (Fig. 4D). As a positive control, incubation of SMG-C6 cells in a Ca2+-free medium for 30 min caused a dramatic decrease in TER values due to its effects on tight junction disassembly and paracellular opening.
Go to :
DISCUSSION
TRPV1 is predominantly expressed in specialized sensory neurons [5,6,7,8,23]. However, recent reports suggests that TRPV1 is also expressed in non-neural cells, including SGEC. However, its role in salivary secretion remains elusive. We report here that although TRPV1 is expressed in various SGEC, TRPV1 does not play a direct role in salivary secretions.
We have several lines of evidence supporting our conclusion. First, expression levels of TRPV1 mRNA and TRPV1 were much lower than those of TRPV1 in DRG neurons, which were used as positive control in our experiments. Our real-time PCR data have demonstrated that expression level of TRPV1 in SMG are much lower than that of DRG in mice. In addition, TRPV1 was barely detected in basolateral membrane of acinar cells from mSMG and hSMG, as shown by our immunofluorescence data. Second, stimulation of TRPV1 with CAP did not induce a consistent increase of [Ca2+]i in these cells. We further tested TRPV1 function in SGEC by application of low pH or noxious heat, which also could activate TRPV1 [6,7,8]. However, neither low pH nor noxious heat evoked [Ca2+]i response in our experiments. We also examined whether CAP induces [Ca2+]i increase using whole-cell patch-clamp technique. CAP did not evoke any inward currents in HSG cells (data not shown). It has been also reported that pre-GPCR activation can induce TRPV1 activation [24,25,26]. Thus, we finally tested this hypothesis in our experiment. Subsequent stimulation of the cells with CAP after carbachol or bradykinin stimulation had little effect on the [Ca2+]i response (data not shown). Third, our behavior test showed that there is no substantial increase in salivary flow rate by CAP treatment. There was no difference in PILO-induced salivary secretion between two groups, wild-type, which express TRPV1, and TRPV1 knock-out mice. Furthermore, PILO-induced secretion in wild-type was not changed by the addition of CAP, either.
It is known that there are two types of splice variants in mouse TRPV1, TRPV1α and TRPV1β. Thus, we further examined whether TRPV1β is a dominant isoform in mSMG, since TRPV1β activation does not evoke [Ca2+]i [21]. We confirmed that there are two splice variants of TRPV1 in mSMG as well. The expression levels of TRPV1β were not much higher than that of TRPV1α, suggesting that failure of [Ca2+]i response by TRPV1 activation does not appear due to the dominant expression levels of TRPV1β. We found that CAP induces very slow, small increase of [Ca2+]i in only the subpopulation of hSMG, which was statistically insignificant. Thus, we concluded that these bare [Ca2+]i responses are negligible, since these [Ca2+]i responses are very rare, local, and its magnitude was too small to evoke biological responses.
It has been known that capsaicin has an anti-inflammatory effect [27]. We found that TLR stimulation induces a release of pro-inflammatory cytokines including TNF-alpha and IL-6 in HSG cells in which TRPV1 is expressed, and capsaicin inhibits the release of these cytokines [16,28]. However, these anti-inflammatory effects of capsaicin were not mediated by TRPV1 in SGEC, suggesting that TRPV1 expressed in SGEC hardly function. To investigated the effect of CAP on the paracelluar permeability, we used rat SMG-C6 cells in our experiments, since measurement of TER is only possible from the cell lines which can form tight junctions. We found that CAP decreased TER values only in high concentration of CAP, 100 µM. We conclude that TRPV1 does not play a role in water and electrolytes transport via transcellular pathway at least in salivary gland acinar cells. However, we cannot rule out the possibility of its minor contribution to salivary secretion, for example, by increasing paracellular permeabilities via tight junctions [14].
Go to :
 XML Download