

 PDF
PDF ePub
ePub Citation
 Print
Print


INTRODUCTION
γ-Aminobutyric acid (GABA) is a major inhibitory neurotransmitter in the brain and is involved in the regulation of excitability, generation of network oscillation, and precise timing of neuronal firing [1]. GABAergic transmission also regulates neuronal plasticity by setting the excitation-inhibition (E-I) balance of the neuronal network [2]. GABA receptor type A (GABAAR) is the main GABA receptor mediating inhibitory Cl- currents [3]. GABAAR-mediated inhibition is divided into phasic and tonic inhibition depending on the subcellular receptor location, the sources of GABA, and the timing of receptor activation [4]. Phasic inhibition is mediated by the fast activation of synaptic GABAARs from synaptically released GABA. Tonic inhibition depends on the sustained activation of peri- and extrasynaptic GABAARs by ambient GABA in the extracellular space.
In the visual cortex, inhibition is important for the processing of visual signals [5,6]. GABAAR-mediated inhibition is also a critical regulator of synaptic plasticity in the visual cortex [7,8]. As the threshold level of inhibition is important for plasticity in the visual cortex [9], the mechanisms involved in the maintenance and regulation of inhibitory tone have been of interest. GABAARs could be modulated by several signaling cascades involving protein kinases A and C (PKA and PKC), Ca2+/calmodulin-dependent protein kinase II (CaMKII), and tyrosine kinases [10,11]. Phosphorylation of GABAARs and associated proteins affects the conductance and activation kinetics of GABAARs and also regulates membrane trafficking of receptors [2]. These modulations depend heavily on the subunit composition of GABAARs [10,11]. Since phasic and tonic inhibition are mediated by GABAARs with different subunit composition [12,13], phosphorylation-mediated regulation might be different between phasic and tonic inhibition. Thus, regulation of phasic and tonic inhibition should be regarded collectively to understand how signaling pathways involved in the regulation of GABAAR-mediated inhibition control the neural network. However, the regulation of phasic and tonic inhibition has rarely been investigated concurrently.
In the present study, we investigated the signaling pathways involved in the maintenance of both phasic and tonic GABAAR-mediated currents in the layer 2/3 pyramidal neurons of the rat visual cortex. Phasic inhibition was maintained and regulated by intracellular Ca2+ and CaMKII. In contrast, tonic inhibition depended on cAMP and PKA. The differential regulation of phasic and tonic inhibition suggests that they might be independently regulated by various neuromodulators in the functioning brain.
Go to : 
METHODS
Slice preparation
Visual cortical slices were prepared from 5-week-old Sprague-Dawley rats of either sex (Orientbio Inc., Sungnam, Korea), maintained under standard conditions (23±1℃, 12/12 h light/dark cycle). Animal care and surgical procedures were conducted under the approval of the Institutional Animal Care and Use Committee of School of Medicine at The Catholic University of Korea (approval no. 2012-0098-01). The animals were sedated with chloral hydrate (400 mg/kg, i.p.) and the brains were removed quickly to ice-cold dissection medium after the tail pinch reflex disappeared. Coronal sections of the occipital cortex (thickness, 300 µm) were prepared on a vibrotome (Campden Instruments, Leics, UK). The slices were allowed to recover in a submerging chamber for 40 min at 37℃ before being maintained at room temperature. The dissection and storage medium consisted of 125 mM NaCl, 2.5 mM KCl, 1 mM CaCl2, 2 mM MgSO4, 1.25 mM NaH2PO4, 25 mM NaHCO3, and 10 mM D-glucose, bubbled with carbogen (95% O2/5% CO2). The slices were transferred to a recording chamber containing carbogenated artificial cerebrospinal fluid (ACSF, 1.5-2 ml/min) (125 mM NaCl, 2.5 mM KCl, 2 mM CaCl2, 1 mM MgSO4, 1.25 mM NaH2PO4, 25 mM NaHCO3, and 10 mM D-glucose) at 32~33℃.
Electrophysiological recording
Whole-cell responses were recorded using a whole-cell patch-clamp recording technique with an EPC8 amplifier (HEKA Elektronik, Lambrecht, Germany) and pClamp 9.0 software (Axon Instruments, Foster City, CA, USA). Recording electrodes (3~4 MΩ) were pulled from borosilicate glass pipettes (1B150F-4, World Precision Instruments, Inc., Sarasota, FL, USA) using a micropipette puller (MODEL P-97, Sutter Instrument Co., Novato, CA, USA). In the experimental set to evaluate inhibitory postsynaptic potential (IPSP), the intracellular solution consisted of (in mM) 130 K-gluconate, 10 KCl, 4 Mg-ATP, 10 Na2-phosphocreatine, 0.3 Na3-GTP, and 10 HEPES (pH 7.25 with KOH). CsCl-based internal solution was used for the recording of inhibitory postsynaptic current (IPSC) and tonic inhibitory current and consisted of (in mM) 145 CsCl, 4 Mg-ATP, 10 Na2-phosphocreatine, 0.3 Na3-GTP, 10 HEPES, and 3 QX-314 (pH 7.25 by CsOH). Pyramidal neurons in layer 2/3 of the primary visual cortex were identified visually using IR-DIC video-microscopy with an upright microscope (BX51WI fitted with a 40×/0.80NA water immersion objective; Olympus, Tokyo, Japan), and their regular spiking patterns were confirmed for the experiments using the K-gluconate-based pipette solution without exception. Typical access resistance was 15~20 MΩ. The calculated junction potentials for the K-gluconate- and CsCl-based pipette solutions were 14 and 4 mV, respectively, and the membrane potential was not corrected for the junction potential. Synaptic responses were evoked by applying extracellular stimulation in layer 4 beneath the recorded cell. IPSPs were measured with the K-gluconate-based pipette solution at a holding potential of 0 mV in the presence of the N-methyl-D-aspartic acid (NMDA) receptor antagonist D-aminopentanoate (D-AP5, 50 µM), the alpha-amino-3-hydroxy-5-methyl-4-isoxazolepropionic acid (AMPA) receptor antagonist 6,7-dinitroquinoxaline-2,3-dione (DNQX, 20 µM), and the GABAB receptor antagonist CGP 52432 (1 µM) to suppress neurotransmitter receptors other than GABAAR. IPSCs and tonic currents were measured using the CsCl-based pipette solution at a holding potential of -75 mV with D-AP5, DNQX, and CGP 52432. The amplitude of tonic inhibition was analyzed as the difference between the holding currents measured before and after the application of the GABAAR antagonist bicuculline (10 µM). The holding current was calculated from 100 msec epochs, containing no obvious spontaneous synaptic events, taken every 4 sec over an 80 sec period, as in our previous study [14]. In the previous study on tonic inhibition, we characterized the effect of the GABA transporter 1 (GAT-1) inhibitor, NO-711, on tonic GABAA currents. We also investigated how evoked IPSC (eIPSC) might be affected by NO-711. Tonic currents were enhanced and the decay of eIPSC was slowed by NO-711. However, the amplitude of eIPSC was not affected by NO-711 when the amplitude was about 300~400 pA (data were not shown). Thus, we investigated the amplitude changes of eIPSCs with 300~400 pA amplitude and regarded it as the changes in phasic inhibition in this study. In another experimental set, spontaneous IPSC (sIPSC), the amplitude of which was also not affected by NO-711, was investigated as phasic inhibition. To measure the effects of intracellular kinase inhibitors on tonic inhibition, bicuculline was applied at least 15 min after establishing the whole-cell configuration.
Chemicals
The PKA inhibitor 6~22 amide (PKI) was purchased from Calbiochem (La Jolla, CA). D-AP5, DNQX, bicuculline, CGP 52432, myristoylated form of PKI, and the PKC inhibitor chelerythrine were purchased from Tocris (Bristol, UK). Other chemicals were purchased from Sigma (St. Louis, MO, USA).
Statistical analysis
Data are expressed as the mean±SE. Statistical comparisons were performed with paired or unpaired two-tailed Student's t-tests. One-way ANOVA followed by a Tukey's post hoc test was also used for multi-group comparisons (Systat v11, SYSTAT Software, Inc., Richmond, CA, USA). The level of significance was set at p<0.05.
Go to :
RESULTS
In a previous study investigating the E-I ratio [15], we noticed that IPSPs increased with time when measured at 0 mV of membrane potential. In this study, we investigated the underlying mechanism for the increase in IPSP and elucidated the signaling pathways involved in the maintenance and regulation of phasic and tonic GABAAR-mediated inhibition.
Calcium- and CaMKII-mediated regulation of phasic inhibition
We initially investigated the time course of the depolarization-induced potentiation of inhibition. After characterizing the regular spiking patterns of cells at resting membrane potential (RMP) with the K-gluconate-based pipette solution, cells were depolarized to 0 mV and electrical stimulation was applied to induce IPSPs in the presence of the AMPA, NMDA, and GABAB receptors blockers DNQX (20 µM), D-AP5 (50 µM), and CGP 52432 (1 µM). Stimulation was applied every 10 sec. IPSPs increased with time and stabilized after about 5 min (126.05±3.21%, n=9, p<0.001 at 8~10 min compared to 0~2 min) (Fig. 1A). In our previous study, 5-HT-mediated enhancement of phasic inhibition was mediated by Ca2+ and CaMKII [16]. Thus, we investigated how inclusion of the Ca2+-chelator BAPTA (10 mM) and the CaMKII inhibitor KN-93 (10 µM) in the pipette solution would affect the depolarization-induced potentiation of IPSPs (Fig. 1A). BAPTA and KN-93 not only completely blocked the increase in IPSPs but also even decreased the IPSPs (87.4±1.82%, n=9, 86.68±2.14%, n=9, for BAPTA and KN-93, p<0.001, p<0.001, respectively vs. control, p<0.001, p<0.001, respectively vs. baseline measured at 0~2 min). However, KN-92 (10 µM), an inactive analog of KN-93, did not affect the depolarization induced potentiation of IPSPs (128.28±2.99%, n=9, p=0.619 vs. control). Next, we investigated if the depolarization-induced increase in phasic inhibition could be maintained at around the RMP (Fig. 1B). The CsCl-based pipette solution was used to record IPSCs evoked with electrical stimulation at a -75 mV holding potential, which is close to average RMP of layer 2/3 pyramidal neurons. After stabilizing the baseline IPSC recording, the membrane potential was held at 0 mV for 5 min and then recovered to -75 mV. IPSCs were potentiated for at least 15 min after the depolarization (124.73±3.88%, n=7, p<0.001 at 10~15 min after the depolarization compared to baseline) (Fig. 1B). BAPTA and KN-93 again completely blocked the potentiation (93.3±2.25%, n=7, 87.61±3.22%, n=7, for BAPTA and KN-93, p<0.001, p<0.001, respectively vs. control, p<0.05, p<0.01, respectively vs. baseline) and KN-92 had no effect (123.04±3.15%, n=7, p=0.742 vs. control). Thus, the depolarization-induced potentiation of phasic inhibition might be mediated by Ca2+ and CaMKII. During the experiment, the paired-pulse ratio (PPR) of the IPSCs remained unchanged (0.82±0.03 to 0.81±0.04, p=0.379 for control, 0.8±0.05 to 0.81±0.04, p=0.412 for KN-93) (Fig. 1C). Since inclusion of BAPTA or KN-93 in the pipette solution was enough to block the potentiation and the PPR was not changed, the potentiation of phasic inhibition by intracellular Ca2+ and CaMKII might be postsynaptically mediated.
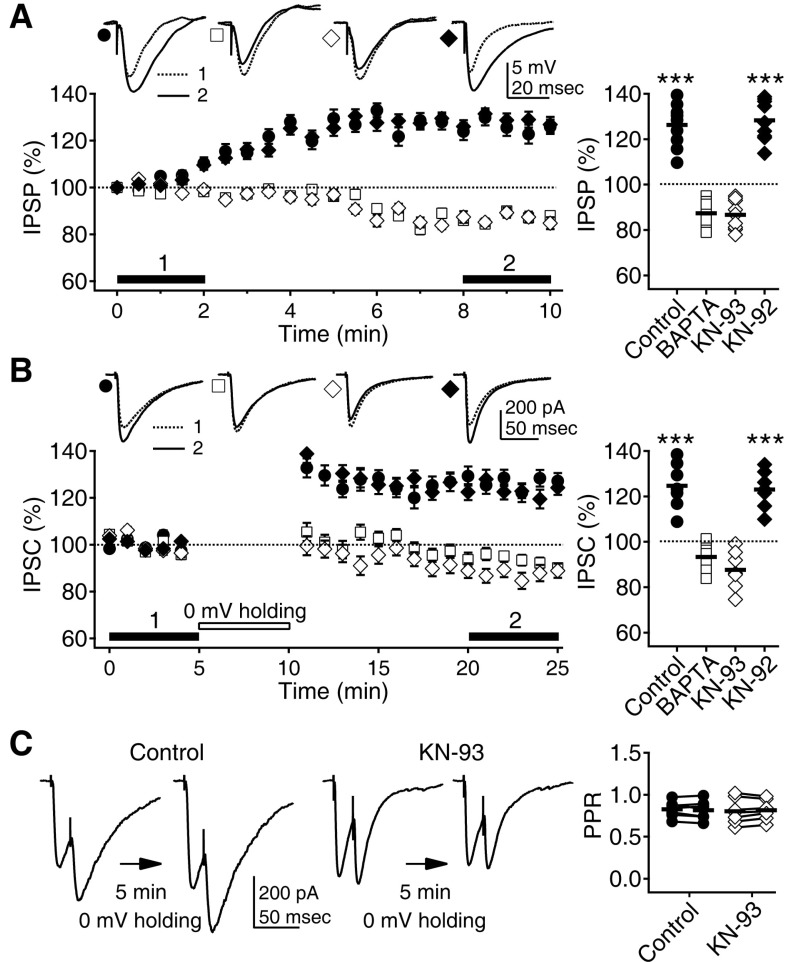 | Fig. 1Depolarization-induced potentiation of phasic inhibition depends on Ca2+ and CaMKII. (A) IPSPs increased with time at a 0 mV membrane potential (solid circle). IPSPs were recorded with K-gluconate-based pipette solution in the presence of the AMPA, NMDA, and GABAB receptors blockers DNQX (20 µM), D-AP5 (50 µM), and CGP 52432 (1 µM) and were evoked with electrical stimulation. The inclusion of the Ca2+-chelator BAPTA (10 mM, open square) and the CaMKII inhibitor KN-93 (10 µM, open diamond) in the pipette solution even depressed the IPSPs. However, KN-92 (10 µM, solid diamond), an inactive analog of KN-93, did not affect the depolarization induced potentiation of IPSPs. Left panel shows the time courses of changes in IPSPs while the membrane potential was held at 0 mV. Insets show representative traces of averaged IPSPs at the indicated period. Right panel plots individual data (symbols) and averages (thick solid lines). ***p<0.001 vs. BAPTA or KN-93. (B) Five min of 0 mV holding potentiated IPSCs recorded with CsCl-based pipette solution at a -75 mV holding potential in the presence of DNQX, D-AP5, and CGP 52432 (closed circle). BAPTA (open square) and KN-93 (open diamond) blocked the potentiation. KN-92 (solid diamond) had no effect. Left panel shows the time courses of changes in IPSCs. Insets show representative traces of averaged IPSCs at the indicated period. (C) PPR was not affected by the 5min of 0 mV holding, suggesting postsynaptic changes. Paired responses were 20 msec apart. Left panels show representative traces of paired IPSCs before and after the 0 mV holding. Right panel plots individual data showing PPRs before and after the 0 mV holding (symbols linked by lines) and averages (thick solid lines).
|
The decrease in phasic inhibition by BAPTA and KN-93 (Fig. 1A, B) suggest that phasic inhibition might also be maintained by intracellular Ca2+ and the basal activity of CaMKII. To test this possibility, we investigated the effects of BAPTA and KN-93 on a continuous recording of IPSCs at a -75 mV holding potential (Fig. 2A). In the control condition, IPSCs were well maintained for 30 min with CsCl-based pipette solution (96.54±2.46%, n=7, at 25~30 min compared to 0~5 min). However, including BAPTA or KN-93 in the pipette solution decreased the IPSCs with time (77.58±3.46%, n=7, 74.1±3.53%, n=6, for BAPTA and KN-93, p<0.001, p<0.001, respectively vs. control, p<0.001, p<0.001, respectively vs. baseline). Including the PKA, PKC, and tyrosine kinases inhibitors PKI (100 µg/ml), chelerythrine (50 µM), and genistein (100 µM) in the pipette solution did not affect the IPSCs (100.9±1.94%, n=7, 97.62±1.9%, n=7, and 94.2±2.4%, n=6, for PKI, chelerythrine, and genistein, p=0.189, p=0.733, and p=0.513 vs. control, respectively) (Fig. 2B). These results suggest that phasic GABAAR-mediated inhibition is maintained by intracellular Ca2+ and the basal activity of CaMKII but not by PKA, PKC, or tyrosine kinases.
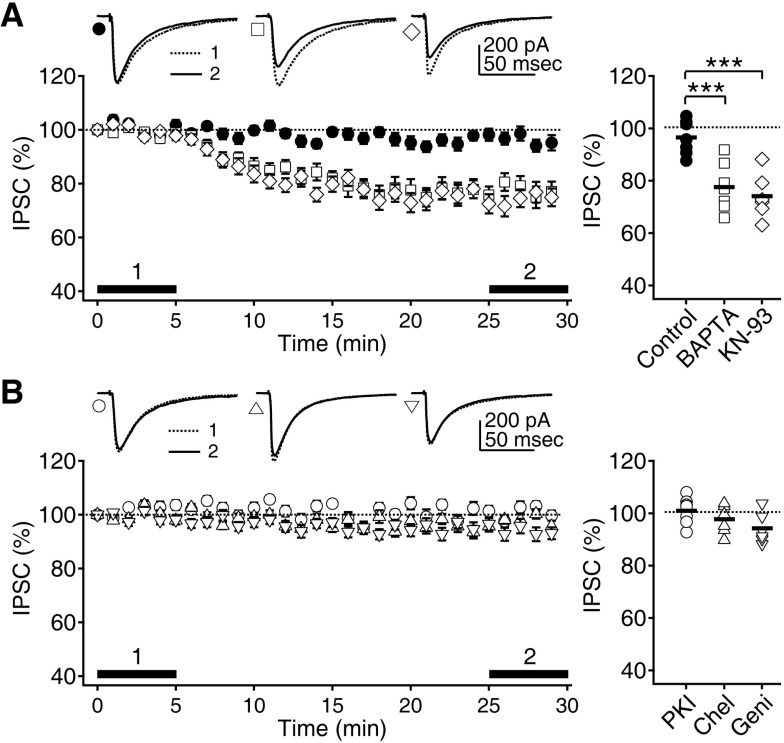 | Fig. 2Maintenance of phasic inhibition depends on Ca2+ and CaMKII. (A) IPSCs recorded with CsCl-based pipette solution at a -75 mV holding potential were well maintained for at least 30 min (closed circle). Inclusion of BAPTA (open square) and KN-93 (open diamond) in the pipette solution decreased IPSCs with time. Left panel shows the time courses of changes in IPSCs. Insets show representative traces of averaged IPSCs at the indicated period. Right panel plots individual data (symbols) and averages (thick solid lines). ***p<0.001 between groups linked by line. (B) Inclusion of the PKA, PKC, and tyrosine kinases inhibitors PKI (100 µg/ml, open circle), chelerythrine (50 µM, 'Chel', open triangle), and genistein (100 µM, 'Geni', open inverse triangle) in the pipette solution did not affect the IPSCs.
|
Maintenance of tonic inhibition by the activity of PKA
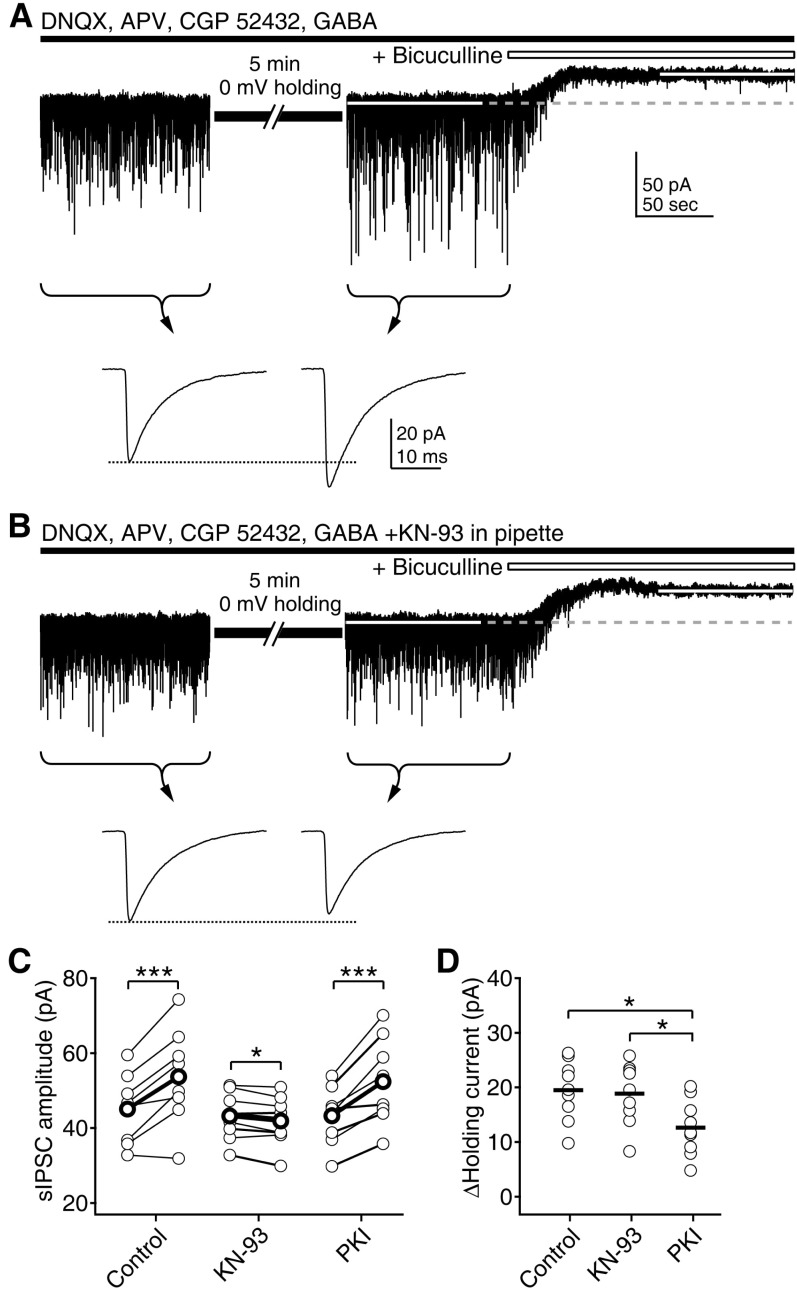
Since tonic GABAAR-mediated inhibition could also be regulated by phosphorylation [11], we investigated how kinases inhibitors affect tonic currents. Tonic currents were measured as the changes in holding currents by the application of the GABAAR blocker bicuculline (10 µM), recorded at a -75 mV holding potential. During the recording, AMPA, NMDA, and GABAB receptors were blocked by DNQX, D-AP5, and CGP 52432. Tonic currents under the control condition were 12.6±1.29 pA (n=12) (Fig. 3A). BAPTA or KN-93 in pipette solution had no effect on tonic currents (11.83±1.48 pA, n=11, 13.24±1.42 pA, n=11, p=0.698, p=0.743 vs. control, respectively) (Fig. 3B, C). However, PKI reduced the amplitude of tonic currents (7.43±1.27 pA, n=12, p<0.01 vs. control) (Fig. 3D). Since the PKA inhibitor reduced tonic currents, we tried to enhance PKA activity by including the PKA activator 8-Br-cAMP (10 µM) in the pipette solution. Tonic currents were slightly increased by 8-Br-cAMP to 16.2±1.68 pA (n=12, p=0.105 vs. control) (Fig. 3E). Chelerythrine or genistein did not affect the tonic currents (13.04±1.57 pA, n=11, 12.03±1.37 pA, n=11, p=0.831, p=0.764, vs. control, respectively) (Fig. 3F). Next, we investigated how the application of PKI and 8-Br-cAMP in the midst of recording affects the holding currents and the amplitude of sIPSCs (Fig. 4). Since PKI is impermeable to cell membrane, we used a cell-permeable myristoylated form of PKI in this experiment. Myristoylated PKI (1 µM) decreased holding currents by 6.59±0.83 (n=10, p<0.001) (Fig. 4A). On the contrary, 8-Br-cAMP (10 µM) increased currents by 4.11±0.93 (n=10, p<0.01) (Fig. 4B). The amplitudes of sIPSCs were not changed by both drugs (38.59±2.45 pA to 38.75±2.41 pA, 41.3±2.91 pA to 40.91±2.67 pA, for PKI and 8-Br-cAMP, p=0.82, p=0.469, respectively). Thus, in contrast to phasic inhibition, tonic GABAAR-mediated inhibition seemed to be maintained based on PKA activity in layer 2/3 pyramidal neurons of the visual cortex.
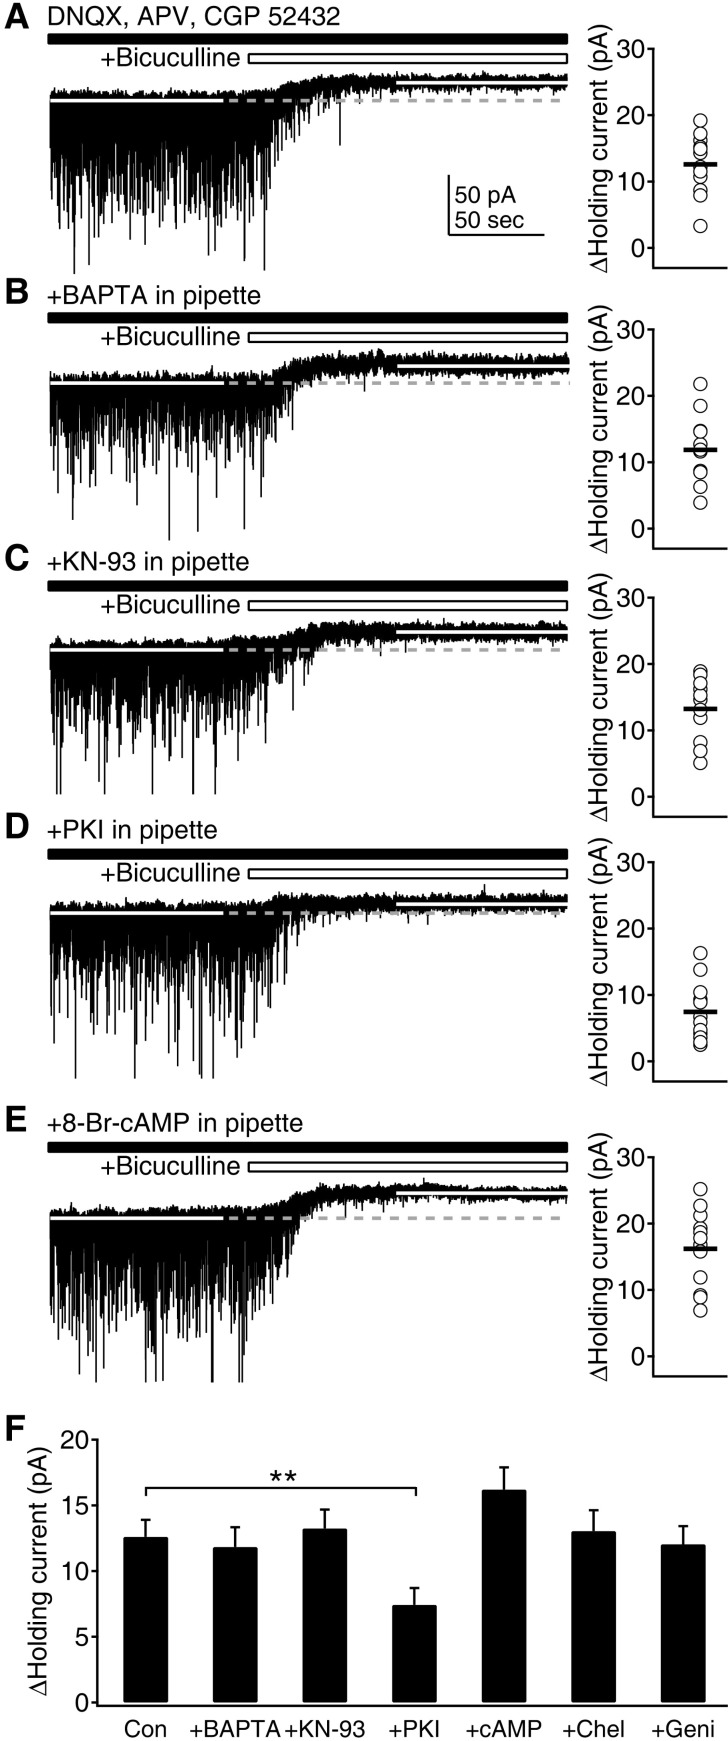 | Fig. 3Maintenance of tonic inhibition depends on cAMP and PKA. (A) Tonic GABAAR-mediated currents were measured as changes in holding currents by the application of the GABAAR blocker bicuculline (10 µM) at a -75 mV holding potential in the presence of DNQX, D-AP5, and CGP 52432. Left panel shows a representative trace of current recording to measure the tonic current. Right panel plots individual data (symbols) and averages (thick solid lines). (B) Measurement of tonic currents with BAPTA in the pipette solution. (C) Measurement of tonic currents with KN-93 in the pipette solution. (D) Measurement of tonic currents with PKI in the pipette solution. (E) Measurement of tonic currents with the PKA activator 8-Br-cAMP (10 µM) in the pipette solution. (F) Average tonic currents were plotted for control condition ('Con'), BAPTA, KN-93, PKI, 8-Br-cAMP ('cAMP'), chelerythrine ('Chel'), and genistein ('Geni') in the pipette solution. **p<0.01 between groups linked by line.
|
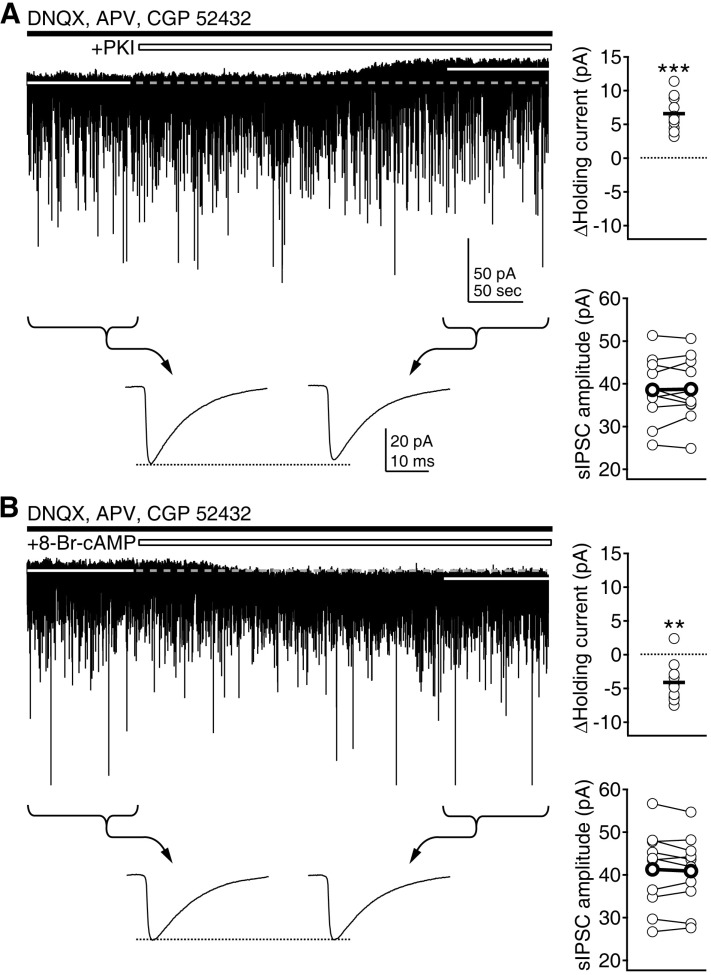 | Fig. 4Regulation of tonic inhibition by PKA. (A) Cell-permeable myristoylated PKI (1 µM) was applied during the continuous recording of currents. Changes in holding currents and the amplitude of sIPSCs were investigated. Left upper panel shows a representative trace of current recording. Average amplitude of sIPSCs for 100 sec period before and after the application of drug was compared (indicated by braces and arrows in lower traces, showing averaged sIPSCs at the indicated period). Right panels plot individual data (symbols and thin symbols linked by lines) and averages (thick solid lines and thick symbols linked by lines). ***p<0.001 vs. baseline. (B) 8-Br-cAMP (10 µM) was applied during the continuous recording of currents. **p<0.01 vs. baseline.
|
Independent regulation of phasic and tonic inhibition
From the experiments described above, we could conclude that phasic and tonic inhibition might be independently maintained by different mechanisms. We also showed that depolarization could potentiate phasic inhibition (Fig. 1). This depolarization-induced potentiation implies that the tone of inhibition might be regulated depending on activity of the neural network. However, it is unclear how different the activity-dependent regulation of phasic and tonic inhibition might be. To address this, we concurrently investigated the effects of depolarization on phasic and tonic inhibition in the same set of recordings. In this experiment, average amplitude of sIPSC was regarded as phasic inhibition, and tonic inhibition was measured as changes in holding currents by the application of bicuculline as described in the previous section. In the midst of the continuous current recording at a -75 mV holding potential, membrane potential was held at 0 mV for 5 min. Depolarization to 0 mV might mimic the condition of high network activity. In such a high activity condition, level of ambient GABA might be elevated because of the high activity of GABAergic interneuron. Thus, we added 5 µM of GABA in bath solution to further investigate how elevated ambient GABA affects the overall changes in GABAergic inhibition induced by depolarization. In the presence of GABA (5 µM), control tonic currents measured without depolarization was increased from 12.6±1.29 pA (as in Fig. 3A, F) to 20.46±1.56 pA (p<0.001).
The average amplitude of sIPSCs was compared before and after the 0 mV holding and then bicuculline was applied to measure tonic currents (Fig. 5). The amplitude of sIPSC was increased by the 5 min of 0 mV holding (45.07±2.91 pA to 53.72±4.04 pA, n=9, p<0.001) (Fig. 5A, C). However, tonic currents measured after 0 mV holding were not different from the currents measured without 0 mV holding (19.51±1.83 pA vs. 20.46±1.56 pA, for tonic currents after 0 mV holding as in Fig. 5A, D vs. without 0 mV holding, p=0.698). The CaMKII inhibitor KN-93 reversed the increase in sIPSC (43.21±2.04 pA to 41.92±2.1 pA, n=9, p<0.05) but had no effect on tonic currents (18.86±1.86 pA, p=0.52) (Fig. 5B, C, D). The suppressed increase in sIPSC by the CaMKII inhibitor was consistent with the results obtained with evoked IPSCs (Fig. 1A, B). The PKA inhibitor PKI did not affect the increase in sIPSC caused by the depolarization (43.26±2.44 pA to 52.41±3.64 pA, n=9, p<0.001) but decreased the amplitude of tonic currents (12.63±1.7 pA, p<0.05) (Fig. 5C, D), consistent with the decrease in tonic currents in Fig. 3D. Thus, depolarization had no effect on either tonic inhibition itself or the PKA maintenance of tonic inhibition. Furthermore, increased ambient GABA in high activity condition might not alter the CaMKII and PKA modulation of phasic and tonic inhibition. These results suggest that phasic and tonic inhibition might not only be maintained by independent signaling pathways but also be independently regulated in response to changes in the activity level of the neural network or changes in neuromodulators which could alter the signaling cascades involved in the maintenance and regulation of phasic or tonic inhibition.
 | Fig. 5Depolarization selectively enhances phasic inhibition via CaMKII. (A) Selective enhancement of sIPSCs by 5min of 0 mV holding. After stabilizing the current recording at a -75 mV holding potential, membrane potential was held at 0 mV for 5 min. Average amplitude of sIPSCs for 100 sec period before and after the depolarization was compared (indicated by braces and arrows in lower traces, showing averaged sIPSCs at the indicated period). Then, bicuculline was applied to measure tonic GABAAR-mediated currents. (B) The inclusion of KN-93 in the pipette solution inhibited the enhancement of sIPSCs. (C) Individual data of changes of sIPSC before and after the depolarization (thin symbols linked by lines) and averages (thick symbols linked by lines) were plotted for the control condition, KN-93 and PKI in the pipette solution. *p<0.05, ***p<0.001 between the sIPSCs before and after depolarization. (D) Individual data (symbols) and averages (thick solid lines) of tonic currents measured after the depolarization. *p<0.05 between groups linked by line.
|
Go to :
DISCUSSION
In the present study, we demonstrated that different phosphorylation mechanisms independently control phasic and tonic inhibition.
Regulation of GABAA receptor function by phosphorylation
GABAAR function is critically regulated by phosphorylation [10,11]. Both the activity and the membrane trafficking of GABAARs could be regulated by phosphorylation. Signaling cascades involved in the phosphorylation of GABAARs vary depending on the subunit composition of GABAARs [2]. Since GABAAR composition is different between brain regions [17], the effects of neuromodulatory signals on GABAAR function could be diverse in different brain areas. Furthermore, phasic and tonic inhibition are mediated by GABAARs with distinct subunit composition [13,18]. Thus, it has been assumed that phosphorylation might also differentially affect phasic and tonic inhibition [11]. In the present study, we showed that Ca2+ and CaMKII might be the main regulators of phasic inhibition in layer 2/3 pyramidal neurons of the rat visual cortex. In contrast, tonic inhibition depended on the activity of PKA. These results support the assumption that phasic and tonic inhibition might be differentially regulated by phosphorylation. In our previous study, tonic currents in thick-tufted pyramidal neurons of layer 5 responded to the α5 subunit-specific inverse agonist L-655,708, but not in layer 2/3 pyramidal neurons [14]. Thus, subunit composition of GABAARs and phosphorylation-mediated regulation of inhibition might also be distinct between cell types in the same brain region. In that previous study, we also demonstrated that the application of THDOC (100 nM), a δ subunit-specific agonist at low concentration [19], did not enhance tonic inhibition. This result suggests that GABAARs mediating tonic inhibition in the rat visual cortex might not contain the δ subunit. We also identified that diazepam (1 µM) selectively enhances phasic inhibition in an unpublished experiment. Based on the regional expression patterns of GABAARs and L-655,708, THDOC, and diazepam sensitivity [2,20,21], we propose that phasic and tonic inhibition might be mediated by GABAARs composed of α1βγ2 and α4βγ2, respectively, in the layer 2/3 pyramidal neurons of the rat visual cortex. The differences in the subunit composition might underlie the specific regulation of phasic and tonic inhibition by CaMKII and PKA.
In addition, different plasticity mechanisms could control the same inhibitory modality differentially. For example, phasic inhibition could be differentially regulated by depolarization in cerebellar Purkinje cells. Depolarization could induce potentiation of phasic inhibition in cerebellar Purkinje cells. This potentiation, so-called rebound potentiation, is mediated by postsynaptic Ca2+ signaling and CaMKII [22], similar to the depolarization-induced potentiation of phasic inhibition in the present study. In contrast, in the same cerebellar Purkinje cells, depolarization could also reduce phasic inhibition by endocannabinoid-mediated presynaptic depression of GABA release [23]. These diversities in the regulation of inhibition suggest that detailed studies on the distinctive regulation of both phasic and tonic inhibition are necessary to understand how the neural network acts in different brain states.
Importance of the maintenance and regulation of inhibitory tone
Maintenance of E-I balance is critical for the proper functioning of the nervous system [24,25]. In the sensory cortex, the fine balance between excitation and inhibition is necessary for sensory processing [26]. Thus, their balance should be tuned by sensory experience during development [27]. Because of the importance of E-I balance for the proper functioning of the nervous system, it is maintained by homeostatic mechanisms which detect and restore a disruption in the balance [28,29]. Disruption of E-I balance could lead to the development of disease such as autism or epilepsy [30,31,32]. Since inhibitory plasticity is critical in the maintenance of E-I balance [33], it is important to investigate how inhibitory tone is maintained and regulated to understand the pathogenetic mechanisms of many neuropsychiatric disorders. In addition to balance, the threshold level of inhibition should also be maintained for the plasticity of the neural network [9,34]. Thus, it is also important to understand the mechanisms maintaining the basal inhibitory tone. In the present study, we showed that phasic and tonic inhibitory tones might be independently maintained and regulated by the activity of CaMKII and PKA, respectively. The normal or pathological signals which alter the activity of those kinases could lead to the alteration of inhibitory tones and information processing in the neural network. Neuromodulators such as serotonin and acetylcholine might be examples of such signals which alter the E-I balance [35,36].
Differential regulation of phasic and tonic inhibition
Phasic and tonic inhibition seem to share some common functional roles in the regulation of learning and memory, network oscillation, and sensory processing [4,20,37]. However, they also have been thought to exert different roles based on the theoretical consideration that hyperpolarizing inhibition modulates offset and shunting inhibition modulates gain [11]. Basically, phasic inhibition might control the flow of specific signals and tonic inhibition might regulate overall excitability [25]. The distinct roles played by the two inhibitory modalities suggest that they might be differentially maintained and regulated by independent mechanisms. In the present study, we demonstrated that phasic and tonic inhibition are actually independently regulated respectively by CaMKII and PKA. Thus, neuromodulatory signals might exert diverse control on each inhibitory modality independently. This independent regulation could confer more flexibility to the neural network for regulating information processing.
Go to :
 XML Download