

 PDF
PDF ePub
ePub Citation
 Print
Print


INTRODUCTION
Interleukin-1 (IL-1), an alarm cytokine, stimulates both local and systemic inflammatory responses to multiple chemicals and infectious agents [1]. IL-1 promotes inflammation by inducing production of a network of cytokines, chemokines, and small molecule mediators and expression of adhesion molecules on leukocytes and endothelial cells [2,3,4]. Therefore, the IL-1 signaling pathway is linked to inflammatory diseases, including atherosclerosis. Expression of IL-1 is detected primarily in macrophages of human atherosclerotic plaques [5], and the absence of IL-1 receptor 1 (IL-1R1) results in reduced aggravation of atherosclerotic lesions in mice fed a high-cholesterol diet and infected with Porphymonas gingivalis [6]. These results indicate involvement of the IL-1 signaling pathway in aggravation of hypercholesterolemia-induced atherosclerosis coupled with bacterial infections.
Toll-like receptors (TLRs) are pattern recognition receptors (PRRs) that recognize molecules that are broadly shared by pathogens, i.e., pathogen-associated molecular patterns (PAMPs), but distinguishable from host molecules [7]. In addition to initiation of host-defense against pathogens after recognition of PAMPs [8], TLRs appear to be involved in aggravation of atherosclerosis due to infectious pathogens. Intraperitoneal administration of TLR2/6 synthetic agonists mimicking bacterial PAMPs results in enhanced formation of local lesions in low density lipoprotein (LDL) receptor deficient (LDLR-/-) mice fed a high fat diet and this augmentation is not observed in TLR6 deficient LDLR-/- mice [9]. These results indicate that TLR6 is necessary for enhancement of atherogenesis in the presence of bacterial PAMPs. However, molecular mechanisms linking TLR6 and enhanced development of atherosclerosis are unknown.
Oxidized metabolites of cholesterol, cholesterol oxides, are present in atherosclerotic plaques. Cholesterol accumulated in the artery undergoes oxidative modification to cholesterol oxides, oxysterols, non-enzymatically via in vivo oxidation or enzymatically during cholesterol catabolism [10]. Of oxidative modified cholesterol derivatives, 27-hydroxycholesterol (27OHChol) is the most abundantly detected form of oxysterol in atherosclerotic plaques from different sites [11,12]. Oxysterols are considered to play active roles in progression of atherosclerosis because some of them exhibit more potent atherogenic cellular effects than cholesterol itself, by triggering apoptosis [13] and by inducing expression of pro-inflammatory chemokines including CCL2 and CCR5 ligands [14,15,16], which enhanced recruitment of monocytic cells and CCR5-positive T lymphocytes, respectively [14,15]. However, pro-inflammatory roles of oxysterols in terms of TLR6 signaling have not been reported.
In the current study, we attempted to determine whether cholesterol or 27OHChol influences response to PAMP via PRRs. We selected FSL-1, a synthetic diacyl lipopeptide recognized by Toll-like receptor 2/6 (TLR2/6) heterodimers, to mimic bacterial infections. In addition, we attempted to identify cellular signaling molecules involved in production of IL-1α in order to elucidate molecular mechanisms underlying TLR6-mediated expression of inflammatory cytokines.
Go to : 
METHODS
Cells and reagents
THP-1 cells were purchased from and maintained as recommended by the American Type Culture Collection (ATCC, Manassas, VA, USA). THP-1 cells in passages between 7 and 10 were used for experiments. Cholesterol and 27 OHChol were purchased from Research Plus, Inc. (Barnegat, NJ, USA). FSL-1 was purchased from Invivogen (San Diego, CA, USA). U0126, SB202190, and Akt inhibitor IV (Akti IV) were purchased from Cell Signaling Technology (Danvers, MA, USA). LY294002 and SP600125 were purchased from Sigma-Aldrich (St. Louis, MO, USA).
Reverse transcription (RT)-polymerase chain reaction (PCR)
Total RNAs were isolated using TRIzol reagent and reverse-transcribed to complementary DNA (cDNA) for 1 h at 42℃ with Moloney Murine Leukemia Virus reverse transcriptase using the oligod(T)15 primer (Promega, Madison, WI, USA), followed by non-quantitative and quantitative real-time PCR. For non-quantitative PCR, transcripts of genes of interest were amplified using Hot Start Taq Polymerase (Promega). The cDNA was denatured at 90℃ for 5 min followed by 25 cycles of PCR (95℃ for 30 sec, 55℃ for 30 sec, 72℃ for 30 sec) in the presence of forward and reverse primers of the genes. Glyceraldehydes-3-phosphate dehydrogenase (GAPDH) was amplified as an internal control. Real-time quantitative PCR was performed in triplicate using the LightCycler® 96 Real-Time PCR System (Roche, Germany); each 20-µl reaction consisted of 10 µl of SYBR Green Master Mix, 2 µl of forward and reverse primers (10 pM each) of genes to be analyzed, and cDNA template. Thermal cycling conditions were as follows: 95℃ for 10 min, and 45 cycles at 95℃ for 10 sec, 50℃ for 10 sec, and an elongation period for 10 sec at 72℃. The relative expression of each gene was then calculated as a ratio to GAPDH using LightCycler® 96 software (Version 1.1.0.1320). The primers were IL-1α: 5'-aatgacgccctcaatcaaag-3' (forward) and 5'-tgggtatctcaggcatctcc-3' (reverse); TLR6: 5'-agggctggcctgattcttat-3' (forward) and 5'-tggcacaccatcctgagata-3' (reverse); and GAPDH: 5'-gagtcaacggatttggtcct-3' (forward) and 5'-tgtggtcatgagtccttcca-3' (reverse).
Flow cytometric analysis
THP-1 cells were harvested, washed with phosphate buffered saline (PBS), and immunolabeled with anti-TLR6 antibody (Santa Cruz Biotechnology, Santa Cruz, CA, USA) diluted in PBS (1:50) for 1 h at 4℃. Subsequently, cells were washed twice with cold PBS and incubated for 40 min with fluorescein isothiocyanate (FITC)-conjugated secondary antibody diluted in PBS (1:100) at room temperature. After washing twice with PBS, cells were resuspended in 1% paraformaldehyde/PBS solution. Fluorescence was analyzed by flow cytometry using the BD FACSCanto™ II (BD Biosciences, San Jose, CA, USA).
Enzyme-linked immunosorbent assay (ELISA)
The amount of IL-1α secreted from THP-1 cells was measured using a commercially available IL-1 alpha/IL-1F1 Quantikine ELISA kit (R&D Systems, Minneapolis, MN, USA) following the manufacturer's instructions. Recombinant standards of IL-1α provided in the kit and isolated culture media were added to wells of the plate in the kit. After incubation for 2 h, wells were washed and incubated with the conjugate for 1 h at room temperature. After several washes, the substrate solution was added, and the color intensity was measured. A standard curve was used for determination of the amount of IL-1α present in the samples. Data are expressed as average±standard deviation of triplicate experiments.
Statistical analysis
Error bars represent the standard deviation of triplicate experiments. Statistical analysis by 1-way ANOVA followed by Dunnett's multiple comparison test was performed using PRISM (version 5.0) (GraphPad Software Inc., San Diego, CA, USA). A p-value less than 0.05 was considered statistically significant.
Go to :
RESULTS
Upregulation of TLR-6 expression in the presence of 27OHChol
We investigated the question of whether cholesterol or 27OHChol influenced expression of TLR6. TLR6 transcripts were detected from THP-1 cells using RT-PCR, and transcription of the gene was induced in the presence of 27OHChol, but not of cholesterol (Fig. 1A). The level of TLR6 transcripts increased by 7.5-fold in the presence of 27OHChol compared with unstimulated (control) cells, as determined by realtime PCR (Fig. 1B). We also determined the effects of cholesterol and oxysterols on expression of surface TLR6. In unstimulated state of THP-1 cells, the mean fluorescence intensity (MFI) for TLR6 was 147 and it increased to 206 in the presence of 27OHChol. However, treatment with cholesterol did not result in change of the MFI (Fig. 1C). Collectively, these results indicated that 27OHChol induced an increase in transcription of TLR6 and the level of its gene product on the cell surface.
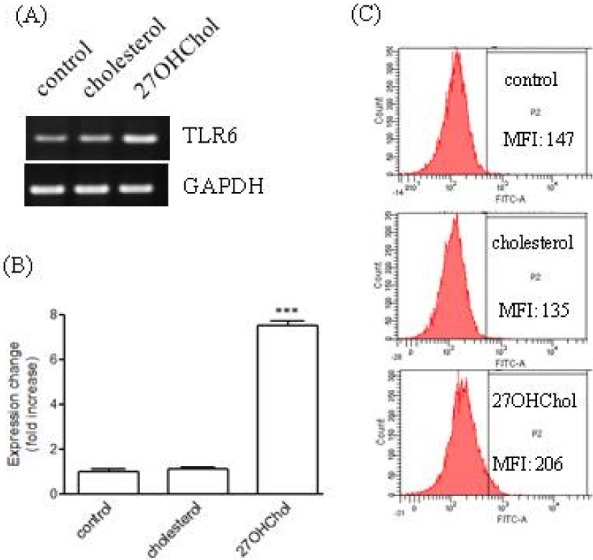 | Fig. 1Expression of TLR6 in THP-1 cells in response to cholesterol and 27OHChol. (A) THP-1 cells (1×10⁶ cells/60 mm culture dish) were serum starved in 0.1% BSA (endotoxin free) in RPMI 1640 for 24 h and treated with cholesterol (5 µg/ml) or 27OHChol (2.5 µg/ml) for 48 h. Total RNA was isolated from the cells, and TLR6 transcripts were amplified using RT-PCR. (B) THP-1 cells were serum starved in 0.1% BSA in RPMI 1640 for 24 h and treated with cholesterol (5 µg/ml) or 27OHChol (2.5 µg/ml) for 48 h. Total RNA isolated from the cells was reverse-transcribed, followed by real-time PCR in order to assess the levels of TLR6 transcripts. (C) Serum-starved THP-1 cells were treated with cholesterol or 27OHChol for 48 h, after which THP-1 cells were immunostained for cell surface TLR6. Flow cytometry was performed for analysis of fluorescence.
|
Induction of IL-1α expression by a TLR6 agonist in the presence of 27OHChol
Because 27OHChol induced upregulation of TLR6, we attempted to determine whether the TLR6-mediated pathway could be activated in the presence of this cholesterol oxide. THP-1 cells were treated with cholesterol or 27OHChol, followed by addition of FSL-1, a synthetic TLR6 agonist, and transcription of IL-1α and secretion of its corresponding gene product were then analyzed by realtime-PCR and ELISA, respectively. THP-1 cells secreted a low amount of IL-1α, which was not influenced by cholesterol, 27OHChol, or FSL-1 alone. Exposure of 27OHChol-treated THP-1 cells to FSL-1 resulted in significantly increased secretion of IL-1α. However, such enhanced secretion of IL-1α did not occur in cholesterol-treated THP-1 cells (Fig. 2A). Regarding transcription of IL-1α, the pattern of effects observed for treatment with 27OHChol and FSL-1 was similar to that observed with its secretion (Fig. 2B). Compared with control, the level of IL-1α transcripts was elevated by 6.8-fold in the presence of 27OHChol plus FSL-1. However, treatment with FSL-1, cholesterol, or 27OHChol alone or cholesterol plus FSL-1 did not influence the gene transcription of IL-1α.
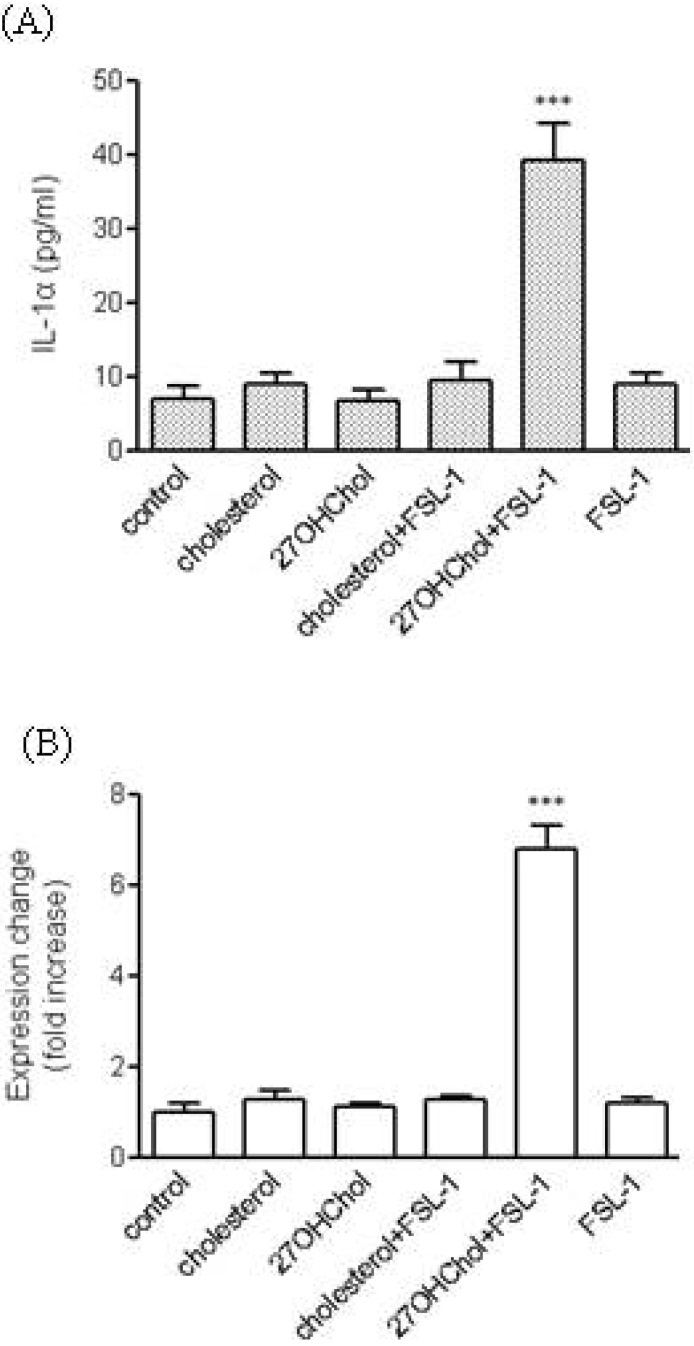 | Fig. 2Effects of cholesterol and 27OHChol on TLR6-mediated expression of IL-1α. (A) Serum-starved THP-1 cells were treated with cholesterol (5 µg/ml) or 27OHChol (2.5 µg/ml) for 24 h and incubated for another 24 h after addition of FSL-1 (100 ng/ml). The amount of IL-1α secreted into culture media was measured by ELISA. ***p<0.001 vs. control. (B) Serum-starved THP-1 cells were treated with cholesterol (5 µg/ml) or 27OHChol (2.5 µg/ml) for 24 h and incubated for another 24 h after addition of FSL-1 (100 ng/ml). Total RNA isolated from the cells was reverse-transcribed, followed by real-time PCR in order to assess the levels of IL-1α transcripts. ***p<0.001 vs. control.
|
Roles of phosphoinositide 3-kinase (PI3K)/Akt in TLR6-mediated expression of IL-α
Stimulation of monocytic cells with 27OHChol or FSL-1 leads to activation of Akt [14,17]. Therefore, the question of whether the PI3K/Akt pathway played roles in IL-1α expression was investigated using inhibitors of LY294002 and Akti IV. First, we examined effects of inhibition of PI3K/Akt on expression of TLR6. Transcription of TLR6 increased by treatment with 27OHChol was significantly reduced in the presence of Akti IV (Fig. 3A). As described above, the amount of IL-1α released from THP-1 was markedly increased after stimulation with 27OHChol and FSL. However, the increase was significantly attenuated and almost completely inhibited in the presence of LY294002 and Akti IV, respectively (Fig. 3B). Two inhibitors, however, exhibited differences in their effects on transcription. The level of IL-1α transcripts increased after stimulation with 27OHChol plus FSL-1 in comparison with control, which was significantly reduced in the presence of Akti IV. In contrast, LY294002 had a marginal effect on transcription of IL-1α (Fig. 3C). The inhibited production of IL-1α was not due to cytotoxicity as AktiV did not influence viability of THP-1 cells, as determined by trypan blue dye exclusion (data not shown).
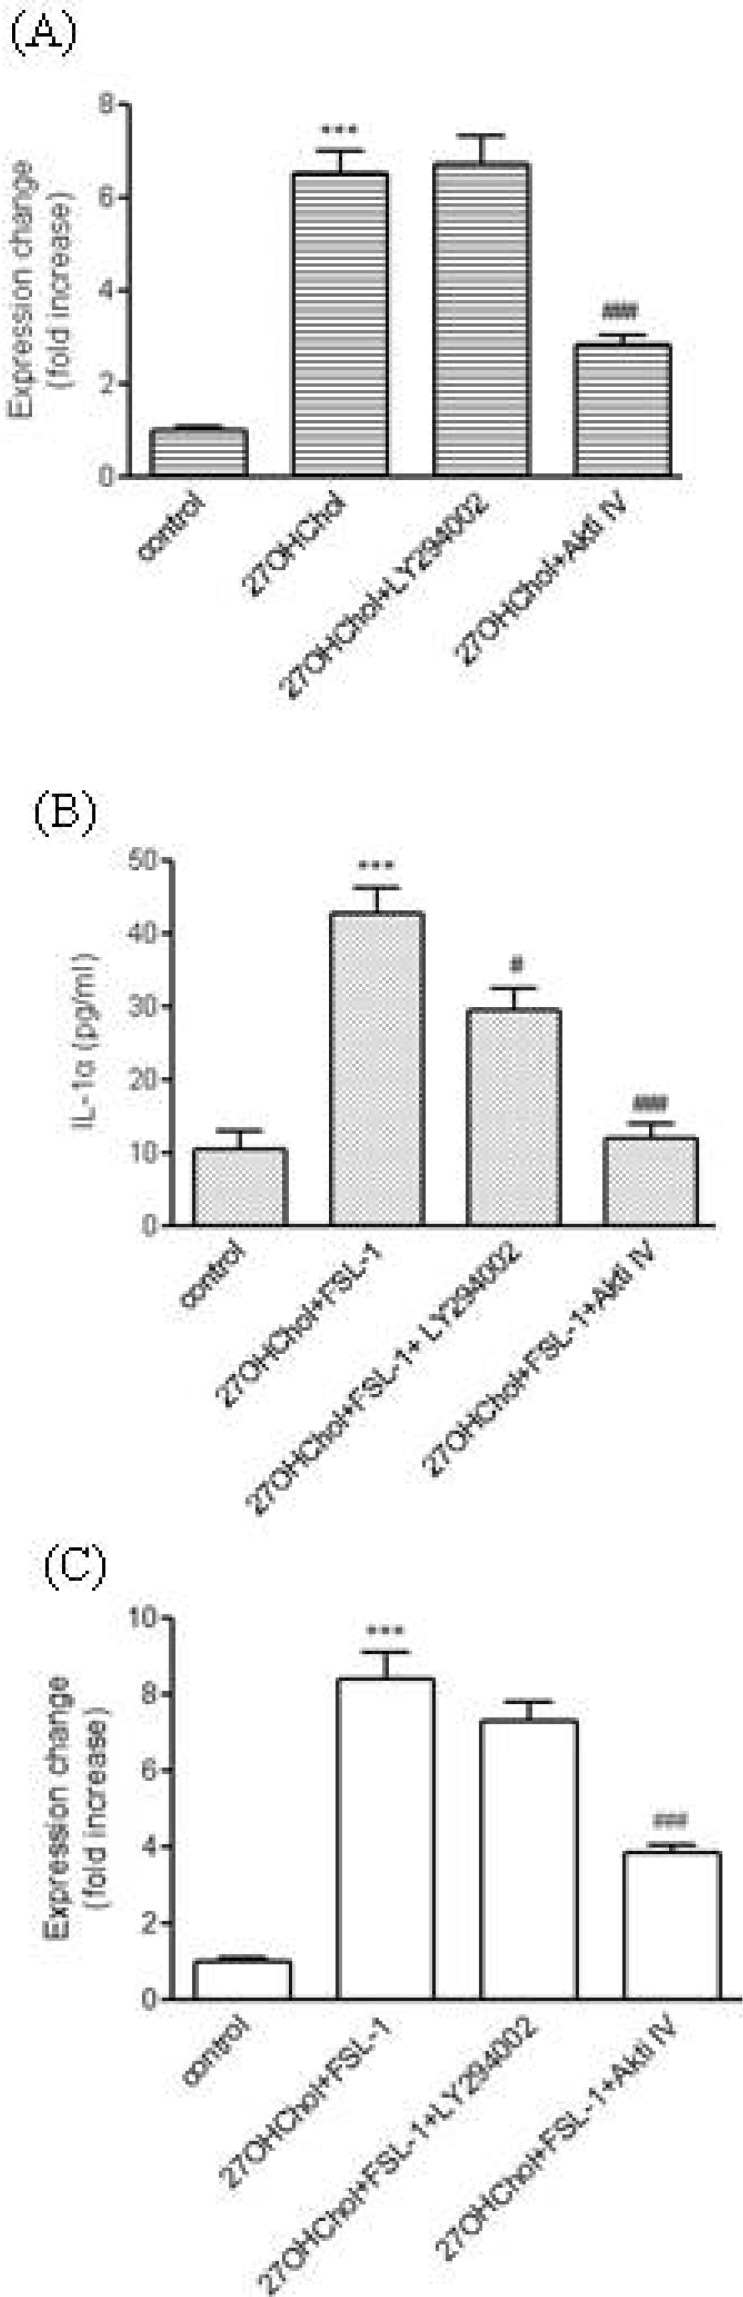 | Fig. 3Effects of inhibitors of the PI3K/Akt pathway on TLR6-mediated expression of IL-1α. (A) Serum-starved THP-1 cells were treated with 27OHChol (2.5 µg/ml) for 24 h after pre-incubation for 2 h in the absence or presence of LY294002 or AktiIV (5 µM each). Total RNA isolated from the cells was reverse-transcribed and real-time PCR was performed for determination of the relative levels of TLR6 transcripts. ***p<0.001 vs. control; ###p<0.001 vs. 27OHChol. (B, C) Serum-starved THP-1 cells were treated with 27OHChol (2.5 µg/ml) for 24 h after pre-incubation for 2 h in the absence or presence of the indicated inhibitors (5 µM each), followed by stimulation with FSL-1 (100 ng/ml) for 24 h. (B) The amount of IL-1α secreted into culture media was measured by ELISA. ***p<0.001 vs. Control; #p<0.05 vs. 27OHChol+FSL-1; ###p<0.001 vs. 27OHChol+FSL-1. (C) Total RNA isolated from the cells was reverse-transcribed, followed by real-time PCR in order to assess the relative levels of IL-1α transcripts. ***p<0.001 vs. control; ###p<0.001 vs. 27OHChol+FSL-1.
|
Roles of mitogen-activated protein kinases (MAPKs) pathway in TLR6-mediated expression of IL-α
MAPKs play critical roles in secretion of multiple cytokines [18]. In addition, activation of MAPKs including extracellular signal-regulated kinase (ERK), p38 MAPK, and c-jun N-terminal kinase (JNK) by FSL-1 has been reported [17]. Therefore, using inhibitors of SB202190 (a p38 MAPK inhibitor), SP600125 (a JNK inhibitor), and U0126 (an MAPK kinase inhibitor), we investigated the question of whether the kinases played roles in expression of TLR6 and IL-1α. Addition of the inhibitors did not affect cell viability (data not shown). Transcription of TLR6 increased by treatment with 27OHChol was significantly reduced in the presence of U0126 (Fig. 4A). Significantly attenuated secretion of IL-1α induced by 27OHChol plus FSL-1 was observed in the presence of U0126, SB202190, or SP600125. Of the three inhibitors, U0126 showed the most efficient inhibition. The three inhibitors exhibited differential effects on transcription of IL-1α (Fig. 4B). Treatment with U0126 resulted in significantly reduced transcription of IL-1α induced by 27OHCHol plus FSL-1, whereas SB202190 and SP600125 did not affect its transcription (Fig. 4C). Collectively, these results indicated that ERK activity is required for TLR6-mediated expression of IL-1α.
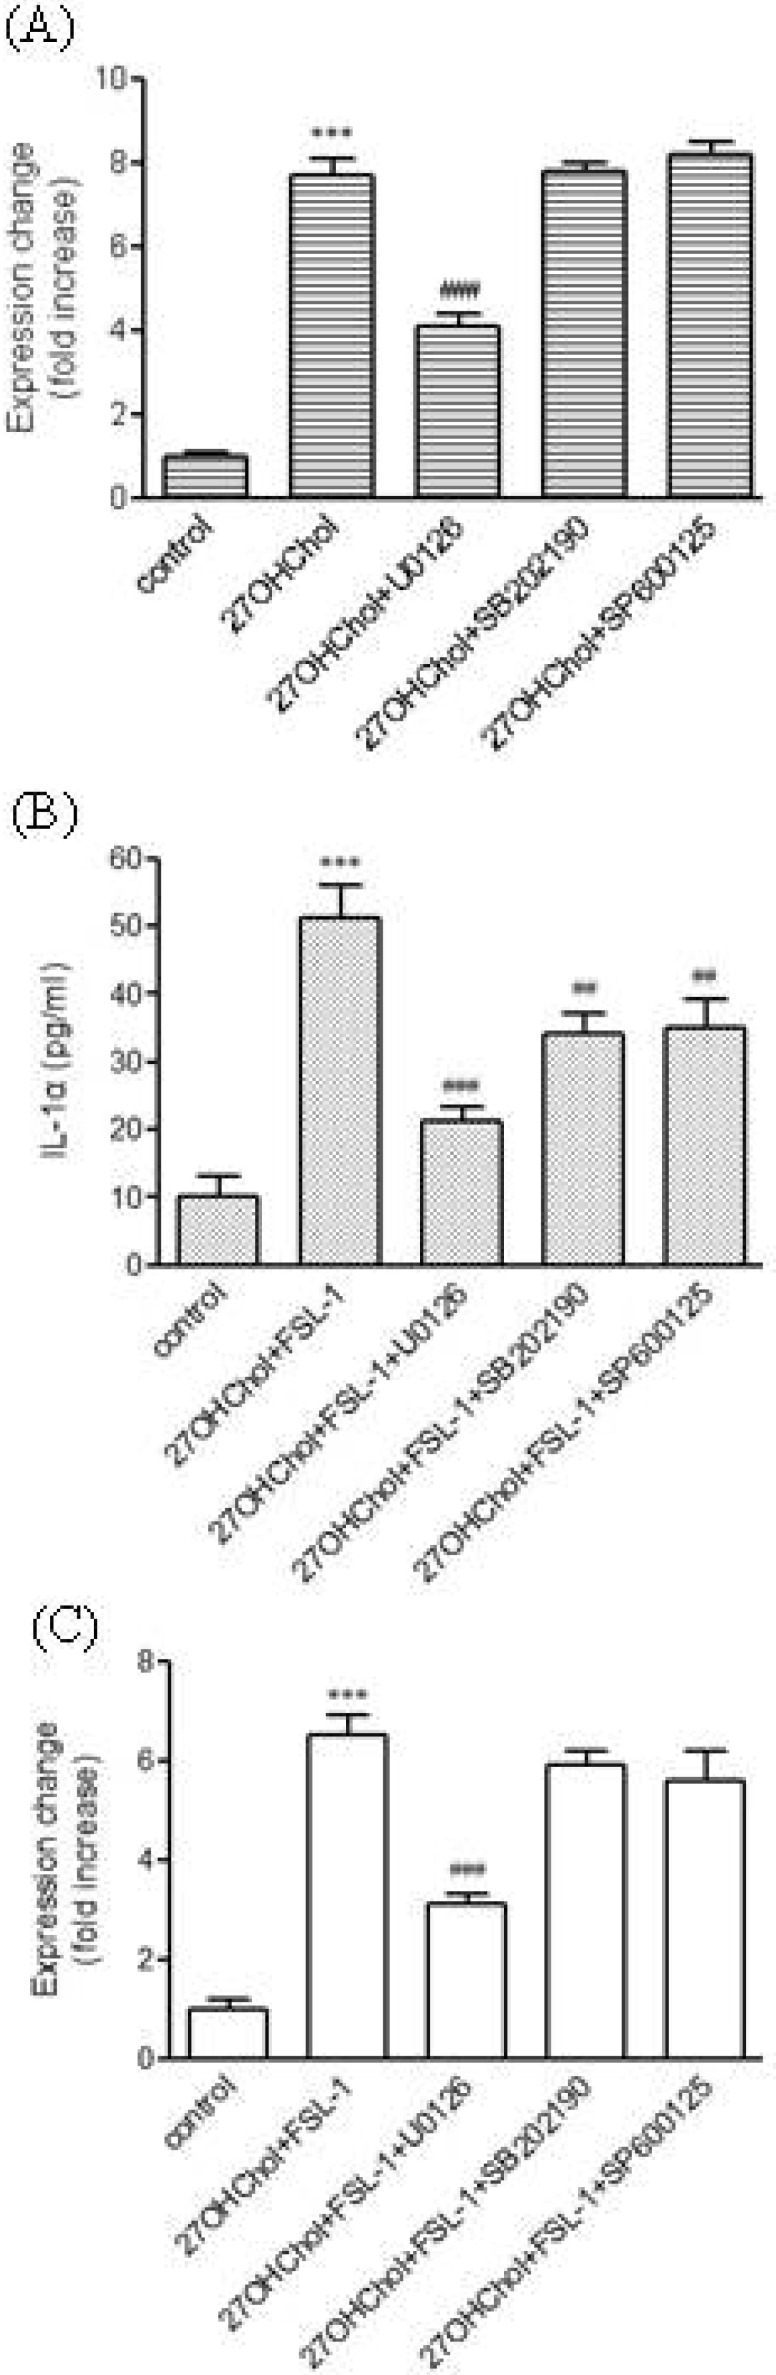 | Fig. 4Effects of inhibitors of MAPKs on TLR6-mediated expression of IL-1α. (A) Serum-starved THP-1 cells were treated with 27 OHChol (2.5 µg/ml) for 24 h after pre-incubation for 2 h in the absence or presence of the indicated inhibitors (5 µM each). Total RNA isolated from the cells was reverse-transcribed and real-time PCR was performed for determination of the relative levels of TLR6 transcripts. ***p<0.001 vs. control; ###p<0.001 vs. 27OHChol. (B, C) Serum-starved THP-1 cells were treated with 27OHChol (2.5 µg/ml) for 24 h after pre-incubation for 2 h in the absence or presence of the indicated MAPKs inhibitors (5 µM each), followed by stimulation with FSL-1 (100 ng/ml) for 24 h. (B) The amount of IL-1α secreted into culture media was measured by ELISA. ***p<0.001 vs. Control; ##p<0.01 vs. 27OHChol+FSL-1; ###p<0.001 vs. 27OHChol+FSL-1. (C) Total RNA isolated from the cells was reverse-transcribed, followed by real-time PCR in order to assess the relative levels of IL-1α transcripts. ***p<0.001 vs. control; ###p<0.001 vs. 27OHChol+FSL-1.
|
Go to :
DISCUSSION
TLR6 is considered to participate in inflammatory responses as it can form heterodimers with other TLRs such as TLR2 and TLR4 [19,20] which mediate proinflammation in response to its specific ligand like peptidglycan and lipopolysaccharide, respectively [21,22]. However, there is limited information with respect to proinflammatory roles of TLR6. The fact that injection of exogenous synthetic TLR6 agonist enhanced formation of atherosclerotic lesion suggests a role of TLR6 and its ligand in atherogenesis [9]. Because atherosclerosis is promoted by inflammation, we investigated the question of whether the TLR6 pathway is activated, thereby mediating expression of inflammatory cytokine, in a milieu rich in cholesterol or its catabolite.
For investigation of involvement of TLR6 in inflammation, we evaluated the ability of the TLR6 agonist FSL-1 (Pam2CGDPKHPKSF), a synthetic lipoprotein derived from Mycoplasma salivarium [23], to induce expression of IL-1α using THP-1, a human monocytic cell line derived from an acute monocytic leukemia patient. THP-1 cells have been widely used as a model for mimicking the function and regulation of monocytes and macrophages in the cardiovascular system [24]. Treatment of THP-1 monocytic cells with 27OHChol resulted in up-regulated expression of TLR6 and activation of TLR6 by addition of FSL-1 to monocytic cells incubated with 27OHChol led to production of IL-1α. Activation of TLR6 as well as production of IL-1α is said to be specific because treatment with cholesterol did not affect expression of TLR6 and addition of FSL-1 to cells treated with cholesterol did not induce expression of IL-1α. Since 27OHChol is present in abundance in atherosclerotic lesions [12,25], it is possible that the TLR6 signaling pathway can be up-regulated in the lesions. The IL-1 family of ligands and receptors is primarily associated with acute and chronic inflammation more than any other cytokine family [1,4], and therefore production of IL-1α by monocytic cells via activation of TLR6 in the presence of 27OHChol can contribute to focal arterial inflammation. We think that our results also provide an explanation for enhanced lesion formation by delivery of synthetic TLR6 agonist in hypercholesterolemia-induced atherosclerosis [9].
We attempted to identify cellular factors involved in IL-1α expression in response to FSL-1. MAPKs are serine/threonine-specific protein kinases that mediate inflammation by inducing chemokine production in response to various extracellular stimuli [18,26], and therefore, their involvement in FSL-1-induced expression of IL-1α was determined. Our results indicate that ERK activity is required for transcription of TLR6 and FSL-1 mediated expression of IL-1α at the messenger and protein levels and that p38 MAPK and JNK are necessary for maximum production of IL-1α at the protein level in response to FSL-1. The results of the current study are in line with those of the previous study reported by Won et al. [17] in that FSL-1 required activity of three MAPKs for production of CCL2 and with reports indicating that MAPKs mediated chemokine production in response to activation of TLRs [8,27]. Taken together, these results indicated active involvement of MAPKs in the mechanisms leading to expression of multiple chemokines in response to TLR6 agonist by monocytic cells.
Involvement of the PI3K/Akt pathway in activation of MAPKs occurs under conditions that cause disruption of cholesterol homeostasis [28]. Therefore, we attempted to determine whether the PI3K/Akt pathway was involved in IL-1α induced by FSL-1 in the presence of 27OHChol. Inhibition of Akt resulted in blockade of IL-1α secretion and significantly reduced transcription of IL-1α as well as the TLR6 gene, while inhibition of PI3K resulted in attenuated secretion of IL-1α without noticeable changes in the levels of their gene transcripts, indicating that Akt is necessary for expression of IL-1α via TLR6. The inability of LY294002 to inhibit transcription of the IL-1α gene might be related to the mode of action of LY294002. LY294002 is a reversible PI3Ks inhibitor [29], meaning that activation of PI3Ks is dependent on relative activity between LY 294002 versus FSL-1. Therefore, it is possible that the concentration of LY294002 used in this study was not sufficient for complete blockage of PI3K activation by treatment with FSL-1. Further investigation with wortmannin, an irreversible inhibitor of PI3K [30], or high doses of LY294002 will be helpful in clarifying the roles of the kinase in expression of IL-1α in response to FSL-1.
We demonstrated that treatment of monocytic cells with 27OHChol resulted in TLR6-mediated expression of inflammatory cytokine via up-regulation of the receptor and that inhibition of ERK pathway and Akt leads to reduced expression of IL-1α induced by FSL-1. However, the current study did not determine whether ERK pathway and Akt act in an independent or cooperative manner; therefore, in order to understand molecular mechanisms underlying expression of IL-1α induced by FSL-1, elucidation of the types of connections or crosstalk that may occur in the context of a possible signaling cascade is needed.
Go to :
 XML Download