

 PDF
PDF ePub
ePub Citation
 Print
Print


INTRODUCTION
Depression is one of the most prevalent and costly brain diseases with up to 20% of the worldwide population suffering from moderate to severe forms of the disease [1]. Many models of depressive disorder were developed and its procedures have been crucial in discovery and development of clinically-effective drugs. Frazer and his colleagues have explored what kinds of animal models should be adopted in the study of depression. They assumed that the attempt to recreate or mimic the entire spectrum of symptoms comprised by the syndrome of depression may be more informative to develop animal models for these behavioral dimensions. Such models may then provide access not only to the neural regulatory mechanisms underlying effective antidepressant treatment, but may also provide clues to the processes underlying the development and manifestation of depression [2]. A model of depression was initially proposed and developed by Katz and his colleagues who subjected rats to various stressors, such as electrical shock, immersion in cold water, reversal of light/dark cycle, fast, isolation, tail pinch, being shaken, moved from cage to cage over a period of 3 weeks [3,4,5]. A new study suggested that chronic unpredictable stress affects depressive behaviors [6]. In comparison with gene-knockout or other equivalent methods in modeling of depressed mice, we suggested to the employment of Chronic Unpredictable Mild Stress (CUMS) as a major method in this study is more practical and closer to the mechanism of depression.
AA, the basic units of proteins, plays an important role in the metabolic processes of living organism. The history of depression and amino acids can be dated back to 1900s [7,8,9]. Earliest case reported a decreased tryptophan ratio was known to result in decreased brain tryptophan and may contributed to depression through a deficiency of brain serotonin [10]. Another study provides significant insight into the roles of 5-HT on the development of visual cortical circuits and on the age-dependent decline of long-term synaptic plasticity [11]. A major depressive syndrome could be a state variable affecting the changes in plasma TRP and TRP/LNAA ratio in OCD patients [12]. Although it is getting more and more attention to develop new biomarkers of depression, only few researches have been conducted to explore the impact of amino acids levels for laboratory diagnostics of depression.
In this study, we attempted to discover new biomarkers for laboratory diagnostics of depression through determining and analyzing the levels of amino acids in rats' brain as well as providing potentially appropriate amino acids in plasma for future clinical diagnosis of depression and improvement of antidepressants.
METHODS
Chemicals and reagents
HPLC-grade organic solvents such as acetonitrile, formic acid were obtained from Fisher Scientific (Fair Lawn, NJ, USA). Ultra-pure water (18.2 mΩcm) from a Cascada IX water purification system (Pall Corporation, USA) was used to prepare all aqueous solutions. Fluoxetine was obtained from China-Japan Friendship Hospital (Patheon, FRANCE).
Animals
Male Sprague-Dawley rats (230+10 g) were obtained from Vital River Laboratories (Beijing, P.R. China). Rats were housed in a temperature and humidity controlled environment and maintained in a 12-hour light/dark cycle for three days with free access to food and water, except when the CUMS procedure was required.
All experimental procedures followed by the National Institutes of Health Guide for the Care and Use of Laboratory Animals were approved by the Committee of Animal Care and Utilities were provided by Beijing University of Chinese Medicine.
CUMS procedure and sucrose intake test
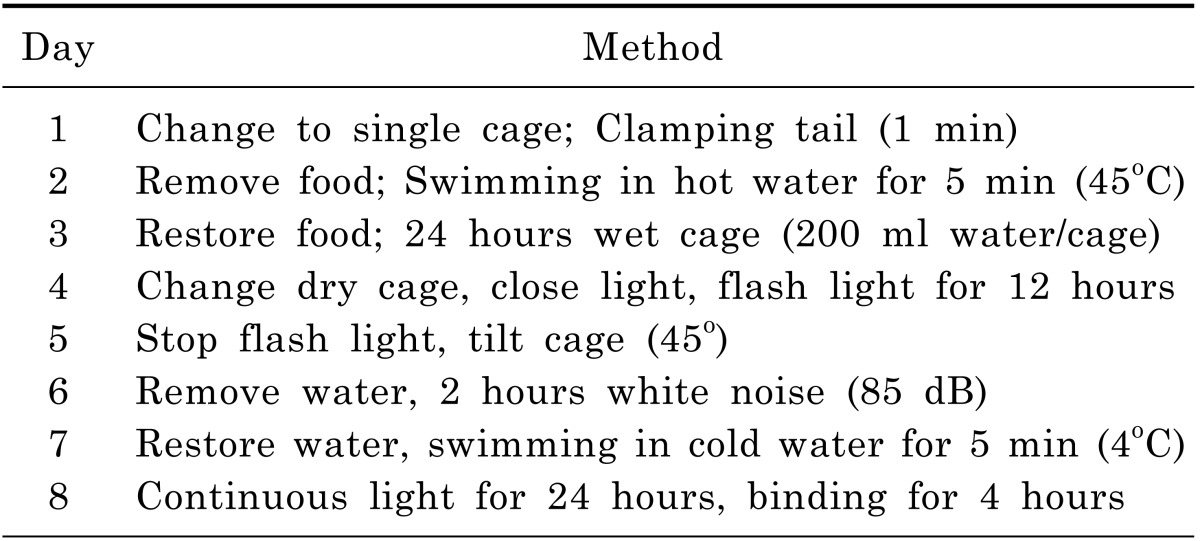
CUMS procedure and sucrose intake test were performed using procedures as stated by Pan and his colleagues [13]. Chronic Unpredictable Mild Stress procedure is shown in Table 1. On a body weight basis, 36 rats were individually trained to consume 1% sucrose solution before CUMS procedure. Training consisted of initial 72 hours sucrose solution exposure without water. Baseline test of sucrose intake was conducted 3 times over 7 days for all rats. Sucrose intake test involved 24 hours water deprivation followed by offering sucrose/water for 1 hour with food and water available. The placement (left and right) of sucrose/water bottle on the cage was randomly changed over times. At the end of test, sucrose intake was measured by weighting pre-weighted bottle containing sucrose solution and expressed as sucrose preference (%). On the basis of sucrose intake in the final baseline test, 5 out of 36 rats were discarded due to high variations in baseline. Sequently, 7 out of the rest 31 rats were selected as Non-CUMS group which were housed in a separate room. The other 24 rats were adopted by CUMS procedure. After 32 days, 10 more rats out of these 24 were discarded due to the resistance to the development of anhedonia (sucrose intake reduction).As a result, the final 14 rats modeled by CUMS procedure were divided into two groups evenly. The first group was defined as depressed rats. On the other hand, the second group with 7 rats was fed with Fluoxetine (0.3 mg/day/rat) for another 30 days. Finally, Non-CUMS and CUMS group were ready for LC-MS/MS analysis.
Open field test
Open field test was performed on the 4th day after arrival of animals. Motor activity in a novel environment was evaluated by OFT. The open field was a square arena (length 90 cm, width 90 cm and height 45 cm), which is made of wood and painted in black. Each rat was transferred from their home cage to the open field area. The measurement of the motor activity was started as soon as the rats were placed in the center of the arena with observation of 5 minutes for each. The open field area was cleaned with ethanol-water (4:1, v/v) solution after each test to unify the condition of experiment. The parameters for motor activity were measured by total travel distance, velocity and frequency of central zone. The data was analyzed afterwards with a computerized tracking system and image analyzer EthoVision (Noldus, Holland).
Chromatographic separation
All samples were analyzed by an Ultimate3000 HPLC (DIONEX, USA) linked with QTRAP LC-MS/MS 3200 (AB SCIEX, USA). The LC system was on-line couplet to an Agilent 6460 Triple Quad LC/MS equipped with the electrospray ionization (ESI) source. Curtain Gas was set at 20 Psi and Collision Gas was performed in medium mode. 5500 V was chosen for IonSprayVoltag. The Ion Source Gas1 and Gas2 were set at 55 Psi and 60 Psi respectively. Temperature was set at the high level of 580℃.
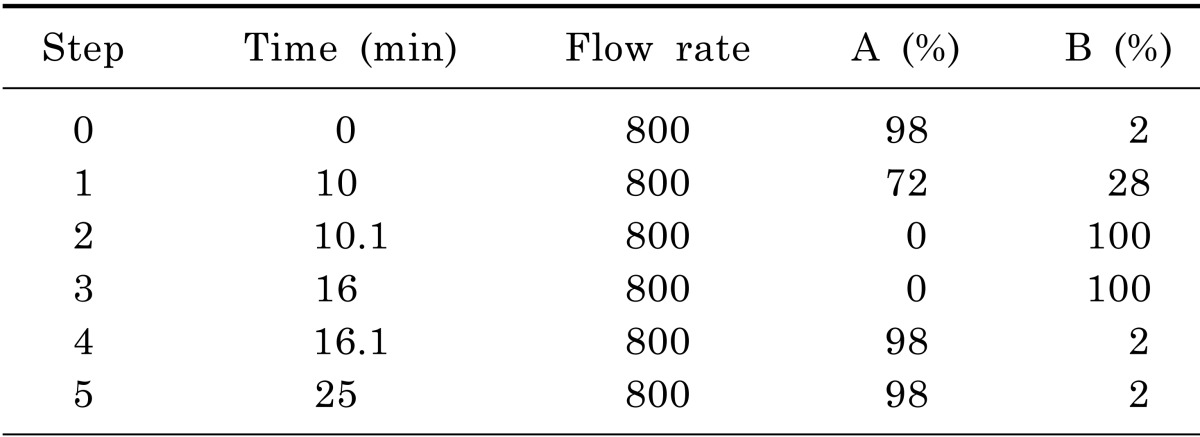
Liquid chromatography analysis were performed in a gradient elution mode using AAA C18 (150×4.6 mm, 5 µm) at 50℃. The mobile phase was consisted of water (containing 0.1% formic acid) and acetonitrile (containing 0.1% formic acid). The gradient program is depicted in Table 2. The samples were kept at 4℃ in the auto-sampler and a volume of 3 µl was injected into the HPLC system. The mobile phase was conducted on a daily basis and was sonicated before use, it then purged with nitrogen gas throughout the experiment. AA45 (PHYS SULFOSALICYLIC ACID) was chosen as isotope label ingredient. The LLOQ of each AA was 1 pg/ml.
Preparation of samples
Firstly, brain samples were quickly removed and frozen in liquid nitrogen, it then stored at -80℃ until analysis. After that, the brain samples were homogenized in ice-cold normal saline with equivalent volume of brain samples for 45 seconds. Firstly, Homogenates (40 µl) were spiked with sulfosalicylic acid (10 µl) by vortex mixing for 30s. Secondly, the mixture was then centrifuged at 7378*g for 2 min for deproteinization. Moreover, an aliquot of 10 µl supernatant was transferred into a fresh tube and 40 µl labeling buffer was spiked with it. The mixture was then centrifuged at 7378*g for 2 min. After that, 10 µl supernatant from the second step was transferred to another fresh tube and 5 µl iTRAQ were spiked with it. Meanwhile, the mixture was also centrifuged at 7378*g for 2 min and incubated for 30min at room temperature. After incubating, 5 µl hydroxylamine were added into the tube and centrifuged with the same procedure as above. Finally, 32 µl isotopelabelingredientwas added and spiked, in the meantime, 3 µl supernatant was injected into HPLC after centrifugation.
RESULTS AND DISCUSSION
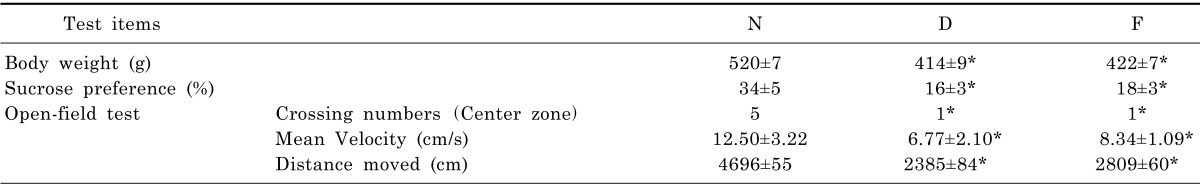
Depressive symptoms were described in terms of weight, sucrose preference, crossing numbers of center zone, mean velocity and total distance. The variation of healthy control group (N), CUMS model group (D) and fluoxetine group (F) are shown in Table 3. In the comparison of these results, there is a notable difference in parameters when comparing either group D with group N or group D with group F (p<0.05, two-tailed). The results proved the modeling in this study was validated and fluoxetine was effective.
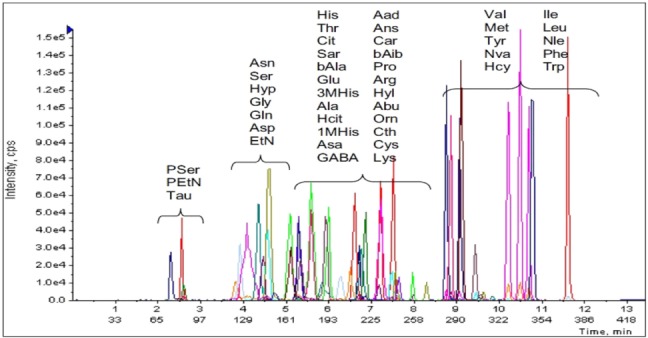
Derivatization changes the structure of chemicals and also changes their physical and chemical properties, resulting in high ionization efficiency, low matrix effect and low disturbance by inorganic salts and endogenous compounds in LC-MS [14]. In the meantime, stable isotope labeling is probably considered as one of the most accurate ways to determinate AA level and also could be performed in conjunction with LC MS/MS approaches. In this study, we obtained the data of 42 different amino acids by utilizing the combination of derivatization and isotope labeling method. 34 AA among them were determinated in the brain tissue of CUMS rats for further analysis.
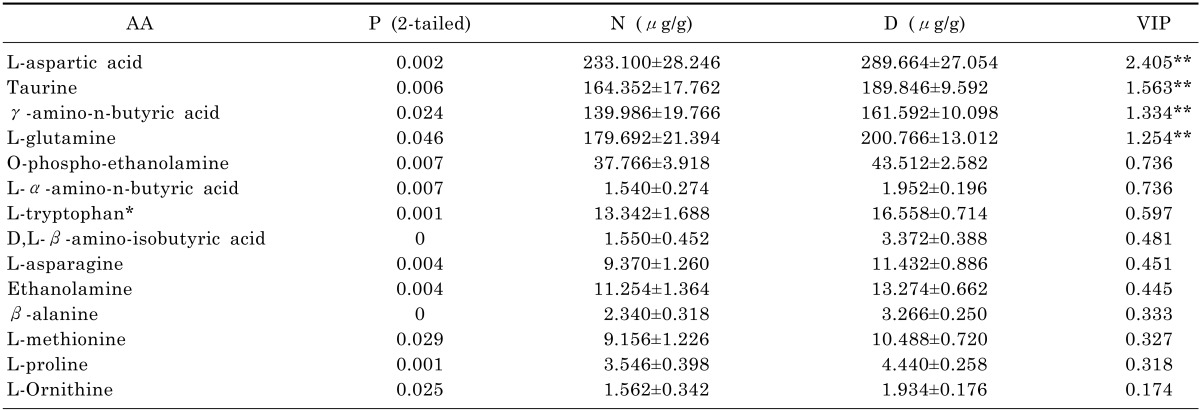
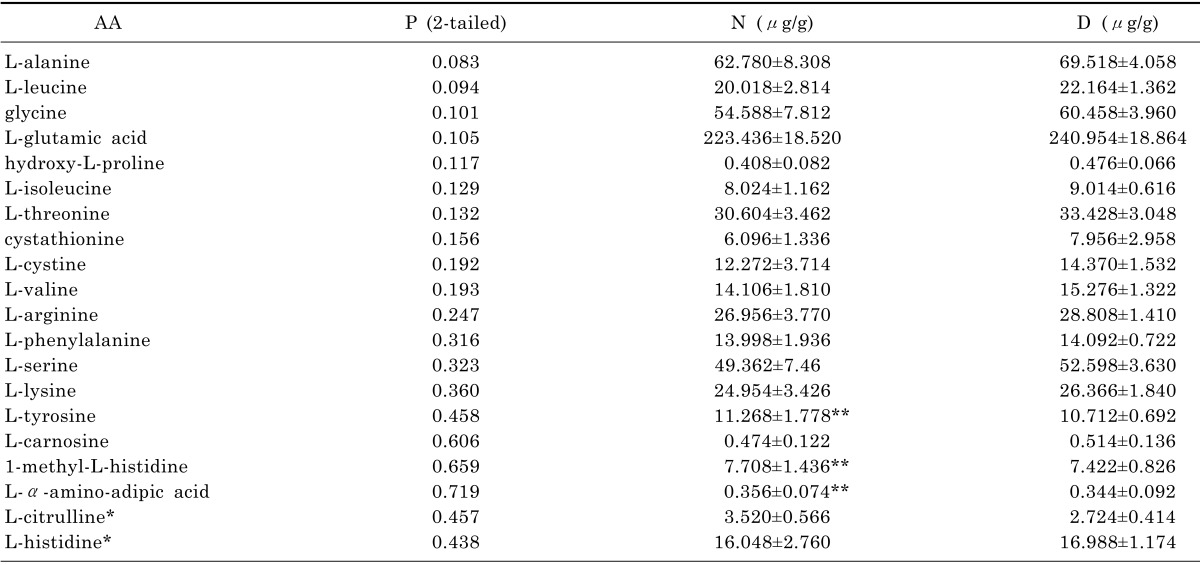
Firstly, the amino acids concentrations were analyzed here by using SPSS technique. We employed normality examination for each amino acid in order to select appropriate methods for varianceanalysis. The results classified the data into two groups (normal distribution and abnormal distribution). After that, AA was analyzed either by T test for the group of normal distribution or by Wilcoxon test for the group of abnormal distribution. As we can see in Table 4, it indicates p-values of 14 AA generated by both test were less than 0.05, which means they were capable to be selected for analysis by SIMACA-P according to the data statistics which states p-values less than 0.05 are considered to be statistically significance. On the other hand, p-values of 20 AA were identified more than 0.05 in Table 5 and 3 AA among them were noticed and selected for further drug validation as its inverse data in group D.
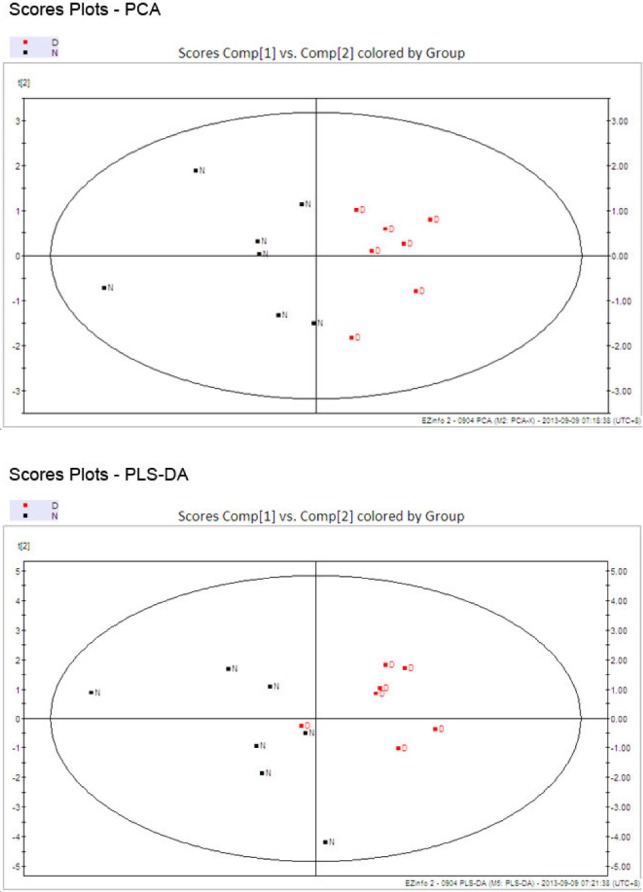
Secondly, the analysis conducted by SIMACA-P for the experimental results was presented in Fig. 1 and 2. The score plots displaying discrimination between group N (black) and group D (red). A good quality and predictability (R2X=91.9%, Q2=0.716) of the PCA model was obtained by establishing PCA model with first two components (PC1 and PC2) at 84.83%. Meanwhile, PLS-DA score plots also revealed that depressed rats were statistically distinguishable from healthy group (R2X=88.4%, Q2=0.391). Of the above PCA and PLS-DA score plots suggested the original model is valid.
The VIP values of four amino acids (L-aspartic acid, L-glutamine, taurine and γ-amino-n-butyric acid) were represented more than 1 in Table 4. Comparing EAA group (L-aspartic acid and L-glutamine) with IAA group (taurine and γ-amino-n-butyric acid), the average levels of L-aspartic acid and glutamine in EAA group were increased approximately by 15% after CUMS procedure. Meanwhile, the mean levels of taurine and γ-amino-n-butyric acid in IAA group were raised around 13% since CUMS procedure. Additionally, the experimental results of SIMACA-P indicated that L-aspartic acid had a significant impact among 14 AA with VIP value of 2.405. Hence, we suggested EAA group has greater impact for depression.
Four amino acids, L-aspartic acid, L-glutamine, taurine and γ-amino-n-butyric acid have a tight connection to depression.
L-aspartic acid with the most VIP value of 2.405 plays an important role either in cellular energy production which is gaining popularity in the management of chronic fatigue or in citric acid cycle and Krebs cycle where other amino acids and the biochemicals are synthesized. The change on level of L-aspartic acid is critical to variation on energy which is directly connected to depression according to the statistics from Human Metabolome Database. In Table 4, the level of L-aspartic acid had a significant change with increase of 20% in group Dafter CUMS procedure from 116.550 µg/mL in group N. We suggested L-aspartic acid could have potentially relationship with depression.
The brain glutaminergic system has been implicated in the etiology of depression and glutamate has been proposed as the neurotransmitter projecting to this system. In previous study, increased glutamine in plasma had been reported to play a role in depression [15] and glutamate was increased in the medial prefrontal cortex in patients with postpartum depression [16]. In this study, L-glutamine was determined in depressed rats' brain with increase from 179.692 µg/g to 200.766 µg/g between group N and D as shown in Table 4. As a result, we believe L-glutamine could play a role in depression.
γ-amino-n-butyric acid is an important neurotransmitter involved in regulating mood and mental clarity. Studies on the connection between γ-amino-n-butyric acid and depression were reported from 1970 [8]. It is speculated that the consequence of increasing level of γ-amino-n-butyric acid is a result of the change of glutamine which is a major source for γ-amino-n-butyric acid synthesis. As we can see in Table 4, the level of γ-amino-n-butyric acid in rats' brain modeled by CUMS procedure was increased by 22.006 µg/g to161.592 µg/g from group N to D. The result verified γ-amino-n-butyric acid in central systems could have a link to depression.
Moreover, taurine, as a secondary important VIP amino acid, its concentration was increased nearly by 13% after CUMS procedure from164.352 µg/g in group N. It is depicted in Table 4.Previous biochemical studies suggested a transmitter role for taurine in the central nervous system. When taurine was administered microelectrophoretically to neurons of the spinal cord and cerebral cortex, it caused a depression of firing [17]. Taurine supplementation has an antidepressant-like effect and an ability to change depression-related signaling cascades in the hippocampus according to a new study [18]. With integration of previous study, we deemed taurine could be related to depression.
In this study, we noticed that the concentrations of three amino acids (L-tyrosine, 1-methyl-L-histidine and L-α-amino-adipic acid) in Table 5 were decreased in group D comparing with other increased levels of amino acids. In previous study, α-Kato acid, decomposed from amino acids, is able to release energy according TCA cycle. The decreased level of amino acid might cause low energy release by limited α-Kato acid. Meanwhile, the energy deficiency is connected with reduced activity and curiosity, which is considered as one of the most represented depressive symptoms. Hence, we have a hypothesis that whether any other new amino acids among L-tyrosine, 1-methyl-L-histidine and L-α-amino-adipic acid may become secondary potential biomarkers of depression even though the p values of them were more than 0.05. In this case, Fluoxetine was employed as a treatment drug to verify the validation of the hypothesis.
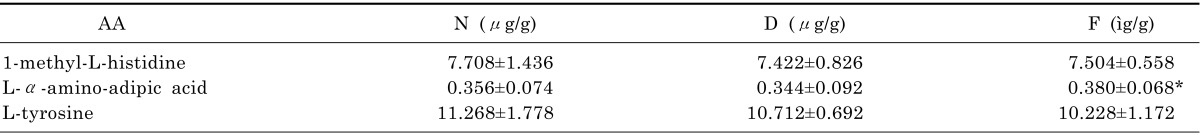
As we can see in Table 6, after treating with Fluoxetine, L-α-amino-adipic acid was the only one among these three amino acids recovering back to normal values. The level of L-α-amino-adipic acid was 0.356 µg/g in healthy group, and then decreased to 0.344 µg/g after adoption of CUMS procedure. However, it recovered to 0.380 µg/mL after adoption of Fluoxetine. Assuming there is a potential link between L-α-amino-adipic acid and depression. Moreover, Bellance and associates recently has identified L-α-aminoadipic acid and γ-amino-n-butyric acid as related biomarkers of cancer [19]. A hypothetical explanation for the relationship between L-α-amino-adipic acid and depression is that L-α-amino-adipic acid and γ-amino-n-butyric acid may have the same metabolic footprint and gene locus. Hence, we suggested that L-α-amino-adipic acid could also become a new potentially secondary biomarker of depression.
Apart from our main focus, other relative amino acids were analyzed in this study such as tyrosine. In Table 6, the level of tyrosine was 11.268 µg/g in healthy group and then was reduced to 10.712 µg/g in CUMS group. Although tyrosine was not validated by Fluoxetine, as a precursor for norepinephrine and dopamine synthesis, it stimulates the central nervous system and acts as an antidepressant which was used in the clinical treatment for depression from 1980 [20,21,22,23]. Meanwhile, due to complexity of disease mechanism and variation in pathway of disease, Fluoxetine might not directly affect tyrosine with increasing its level for treatment of depression. Nevertheless, we still suggested considering tyrosine as a potential biomarker for future study in depression.
In this study, a new method was developed for quantitative analysis of amino acids. Most AA shows neither natural UV absorption nor fluorescence. In this case, it is very difficult to detect AA at trace levels by using HPLC. Therefore, a new method for AA determination in rats' brain was developed by adopting LC-MS/MS with AA45 as isotope label ingredient in this study in order to provide more information of AA and accurate data of quantitative analysis.
Finally, there are some limitations in this study. For instance, small sample size might result in deviation in data statistics and lack of female rats could cause difficulty of elimination in gender difference. Furthermore, a new research indicated that different kind of rats will have different performances in the metabolism of amino acids [24]. Hence, the findings in this study need to be considered as preliminary warrant. We suggested replication in more samples including both male and female rats shall be considered in future study. Meanwhile, we suggested to determine amino acids in plasma sample which were marked in brain sample and analyze the relationship between brain and plasma sample. It will be significative for potential clinical markers of depression.
This study has focused on the determination of amino acids which plays a significant role for depression. As a result of this study, we suggested that L-aspartic acid, Taurine, γ-amino-n-butyric acid, L-glutamine and L-α-amino-adipic acid could be potential biomarkers of depression. This could lead to some interesting attempt to determinate level of amino acids and observe effect of them by different antidepressant in the future study. We believe that the analysis of amino acids level in brain will improve diagnostic capabilities for depression and also will contribute to future discovery of antidepressant.
 XML Download