

 PDF
PDF ePub
ePub Citation
 Print
Print


ABBREVIATIONS
AM
acetoxymethylester
AMPA
α-Amino-3-hydroxy-5-methyl-4-isoxazolepropionic acid
ATP
adenosine 5'-triphosphate
DMEM
Dulbecco's modified Eagle's medium
EGTA
ethylene glycol tetra acetic acid
ER
endoplasmic reticulum
FBS
fetal bovine serum
H2DCFDA
dichlorodihydrofluorescein diacetate
HEPES-HBSS
HEPES-buffered Hank's balanced salt
HS
horse serum
IP3
inositol-1,4,5-trisphosphate
2-MeSATP
2-Methylthioadenosine triphosphate tetrasodium salt
NMDA
N-methyl-D-aspartate
PC12
pheochromocytoma
PKC
protein kinase C
PLC
phospholipase C
ROS
reactive oxygen species
SOC
store-operated calcium channels
SOCE
store-operated calcium entry
INTRODUCTION
Adenosine 5'-triphosphate (ATP) induces a intracellular free Ca2+ concentration ([Ca2+]i) increase by release of Ca2+ from inositol-1,4,5-trisphosphate (IP3)-sensitive Ca2+ stores through activation of P2Y-receptor-mediated phospholipase C (PLC) and influx of extracellular Ca2+ through activation of P2X-receptor [1]. Increases in [Ca2+]i can induce mitochondrial depolarization [2] and mitochondrial matrix Ca2+ overload can lead to enhanced formation of reactive oxygen species (ROS) [3]. Moreover, ATP-induced [Ca2+]i increase in PC12 cells may be involved in the cell death [4], the differentiation [5] and the release of catecholamine [6].
Flavonoids show anti-oxidant effects, anti-inflammatory activity, anti-carcinogenic effects, anti-viral effects, anti-aging effects [7,8,9]. Flavonoids also have an ability to suppress various ion channels including Ca2+ channels [10,11]. In addition, flavonoids have been reported to inhibit agonist-induced [Ca2+]i increase [12,13,14] and inhibit cell death [8,13].
Cyanidin-3-glucoside is a major anthocyanin which belongs to the flavonoid family [9]. Cyanidin-3-glucoside has been reported to prevent neuronal cell death [15,16,17]. However, the effects of cyanidin-3-glucoside on ATP-induced [Ca2+]i increase, ROS formation, and mitochondrial depolarization in PC12 cells have not been explored yet.
In this study, we evaluated how cyanidin-3-glucoside can ameliorate ATP-induced [Ca2+]i increase, mitochondrial depolarization and formation of ROS. Our results indicate that cyanidin-3-glucoside inhibits ATP-induced calcium signaling in PC12 cells by inhibiting multiple pathways which are the influx of extracellular Ca2+ through nimodipine and ω-conotoxin-sensitive and-insensitive pathways and the release of Ca2+ from intracellular stores. In addition, cyanidin-3-glucoside inhibits ATP-induced formation of ROS by inhibiting Ca2+-induced mitochondrial depolarization.
Go to : 
METHODS
Materials
Materials were purchased as follows: fura-2 acetoxymethylester ester (AM), 2',7'-dichlorodihydrofluorescein diacetate (H2DCFDA) and rhodamine 123 from Molecular Probes (Eugene, OR, USA); Dulbecco's modified Eagle's medium (DMEM), fetal bovine serum (FBS, heat-inactivated) and horse serum (HS, heat-inactivated) from Invitrogen (Carlsbad, CA, USA); ATP disodium salt, and all other reagents from Sigma (St. Louis, MO, USA).
Preparation of cyanidin-3-glucoside
Cyanidin-3-glucoside fraction from black soybean [cv. Cheongja 3, Glycine max (L.) Merr.] which was grown at Miryang, was prepared at Rural Development Administration, Miryang, Korea [18]. The purified cyanidin-3-glucoside powder was stored at -70℃ until use.
Cell culture
We purchased rat pheochromocytoma (PC12) cells from ATCC Company (Manassas, VA 20108, USA). PC12 cells from passage 6~14 were grown in 100 mm dish in DMEM, supplemented with 10% FBS and 10% HS at 37℃ in a humidified atmosphere of 5% CO2 and 90% O2 air. Cells from the stock culture were plated in six-well culture plates at a density of 3×10⁴ cells per well, onto 25 mm round glass coverslips (Fisher Scientific, Pittsburgh, Pa, USA) that had been coated with poly-L-lysine (0.1 mg/ml) and washed with H2O. Cells were used for experiment 2~3 days after plating.
Digital calcium imaging
Digital calcium imaging was performed as described by Ahn et al [13]. Cells were loaded at 37℃ for 45 min in 10 µM fura-2 AM in HEPES-buffered Hank's balanced salt solution (HEPES-HBSS:20 mM HEPES, 137 mM NaCl, 1.3 mM CaCl2, 0.4 mM MgSO4, 0.5 mM MgCl2, 0.4 mM KH2PO4, 0.6 mM Na2H2PO4, 3.0 mM NaHCO3, and 5.6 mM glucose) containing 0.5% bovine serum albumin. The fura-2 loaded cells were alternately excited at 340±10 and 380±10 nm by rapidly switching optical filters mounted on a computer-controlled wheel (Lambda DG-4, Sutter Instruments, Novato, CA, USA), which was placed between a 200 W Xe arc lamp and the epifluorescence port of the microscope. Excitation light reflected from a dichroic mirror (400 nm) through a 20X objective (Nikon TE300, Tokyo, Japan) was collected with a cooled charge-coupled device camera cascade 512B (512×512 binned to 256×256 pixels, Photometrics, Tucson, AZ, USA) controlled by a computer. Image pairs were collected every 3~60 sec using an Axon Imaging Work Bench 6.0 (INDEC BioSystems, Santa Clara, CA, USA); exposure to excitation light was 120 ms per image. Background images were collected at the beginning of each experiment after removing cells from the coverslips. [Ca2+]i was calculated from the ratio of the background-subtracted digital images. Ratio values were converted to free [Ca2+]i by the equation [Ca2+]i=Kdβ (R-Rmin)/(Rmax-R), in which R is the 340/380 nm fluorescence emission ratio, and Kd= 224 nM is the dissociation constant for fura-2. The maximum ratio (Rmax=9.326), the minimum ratio (Rmin=0.302), and the constant β (the ratio of the fluorescence measured at 380 nm in Ca2+-free and saturating solutions) were determined by treating cells with 10 µM ionomycin in Ca2+-free (1 mM EGTA) and saturating (5 mM Ca2+) solutions.
Measurement of mitochondrial membrane potential
Rhodamine 123 was used for measurements of mitochondrial membrane potential. PC12 cells were loaded with 10 µM rhodamine 123 for 20 min. The fluorescence of rhodamine 123 was detected by using the same method as the calcium imaging. Images were collected every 60 sec for first 10 min of treatment and for the following 20 min images were collected every 5 min interval. The fluorescence of rhodamine was detected at 530±30 nm following excitation of cells at 485±22 nm.
Measurement of ROS production
To monitor intracellular accumulation of ROS, the fluorescent probe H2DCFDA was used. Cells were loaded with 10 µM H2DCFDA for 30 min. The fluorescence of H2DCFDA was detected by using the same system as in calcium imaging. The fluorescence was detected at 530±30 nm following excitation of cells at 485±22 nm 30 min after treatment of ATP or vehicle.
Statistical analyses
Data are expressed as means±SEM for all cells from several independent experiments. Significance was determined with an ANOVA followed by a Bonferroni's test and a non-paired or paired Student's t-test. The IC50 of cyanidin-3-glucoside was calculated using a non-linear least-square fit of the Hill equation to the concentration-response data.
Go to :
RESULTS
Treatment with ATP (100 µM) for 90 sec transiently induced [Ca2+]i increase in PC12 cells. Reproducible [Ca2+]i response could be elicited by subsequent treatment with ATP (100 µM) for 90 sec at a 35 min interval (relative to peak 1=101.0±2.1% n=28) (Fig. 1A). In the preliminary study, the inhibitory effects of cyanidin-3-glucoside on the ATP-induced [Ca2+]i responses reached a maximum at 30 min duration when cells were pretreated with cyanidin-3-glucoside (10 µg/ml) for various durations (10 to 40 min)(data not shown). Therefore, we used an exposure time of 30 min to investigate how cyanidin-3-glucoside affects the ATP-induced [Ca2+]i responses. Treatment with cyanidin-3-glucoside (1 µg/ml) for 30 min did not affect the ATP-induced [Ca2+]i increase (Fig. 1B), whereas treatment with increasing concentrations of cyanidin-3-glucoside (3 µg/ml to 100 µg/ml) inhibited ATP-induced responses in a concentration-dependent manner (Fig. 1C~F). A non-linear least-square fit of the Hill equation to the concentration-response data yielded an IC50 of 15.3±0.1 µg/ml for cyanidin-3-glucoside (Fig. 1G). However, treatment with various concentrations of cyanidin-3-glucoside (1 µg/ml to 100 µg/ml, Fig. 1B~F) for 30 min did not significantly affect the basal level of [Ca2+]i (data not shown). We therefore used 15 µg/ml as a concentration of cyanidin-3-glucoside in the following experiments to investigate the inhibitory mechanisms of cyanidin-3-glucoside.
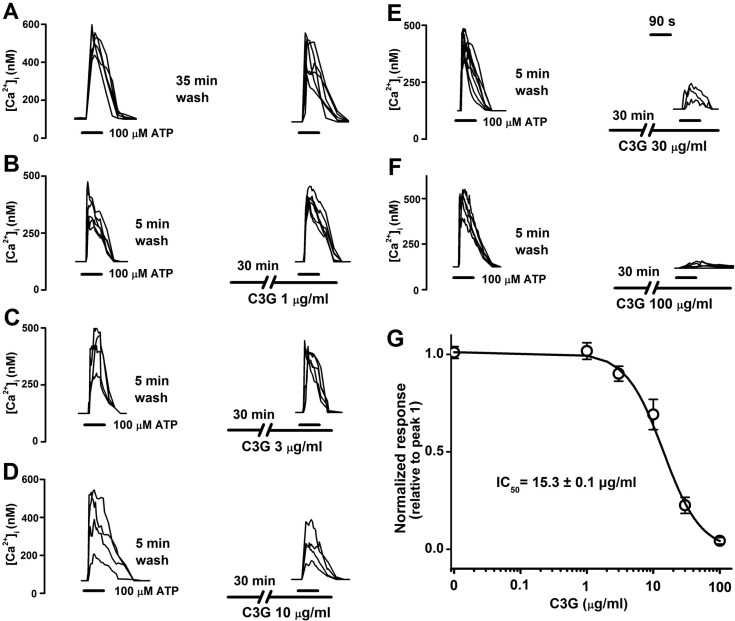 | Fig. 1Concentration-dependent inhibitory effects of cyanidin-3-glucoside on ATP-induced [Ca2+]i increase in PC12 cells. (A) Reproducible [Ca2+]i increases were elicited by superfusion with 100 µM ATP for 90 sec at 35 min interval. (B~F) After pretreating cells with various concentration of cyanidin-3-glucoside (1 µg/ml to 100 µg/ml) for 30 min, the subsequent ATP-induced [Ca2+]i responses were observed. ATP and cyanidin-3-glucoside were applied as indicated by the horizontal bars. G, The ATP-induced response is presented as a ratio of the initial control (peak 2/peak 1) (n=28, 23, 25, 23, 26, 11 at 0 µg/ml, 1 µg/ml, 3 µg/ml, 10 µg/ml, 30 µg/ml, 100 µg/ml, respectively). A non-linear least-square fit of the Hill equation to the concentration-response data yielded an IC50 of 15.3±0.1 µg/ml for cyanidin-3-glucoside. Data are means±SEM.
|
ATP induces [Ca2+]i increases by a release of Ca2+ from IP3-senstive stores through activation of P2Y-receptor-mediated PLC and an influx of Ca2+ from the extracellular space through by activating P2X-receptor [1]. We tested whether cyanidin-3-glucoside affects the ATP-induced [Ca2+]i responses following removal of extracellular Ca2+ or depletion of intracellular [Ca2+]i stores (Fig. 2). The removal of Ca2+ by pretreatment with the Ca2+-free HEPES-HBSS containing 100 µM EGTA for 2 min significantly inhibited the subsequent ATP-induced [Ca2+]i increases, but ATP still induced the [Ca2+]i responses (relative to peak 1=34.4±5.2%, n=22). Pretreatment with cyanidin-3-glucoside (15 µg/ml) for 30 min further inhibited the ATP-induced responses in the presence of the Ca2+-free solution for 2 min (relative to peak 1=26.1±3.3%, n=22, p<0.01) (Fig. 2B & D). These results suggest that cyanidin-3-glucoside inhibits ATP-induced [Ca2+]i increases by inhibiting a release of Ca2+ from intracellular stores through activation of P2Y-receptor-mediated PLC.
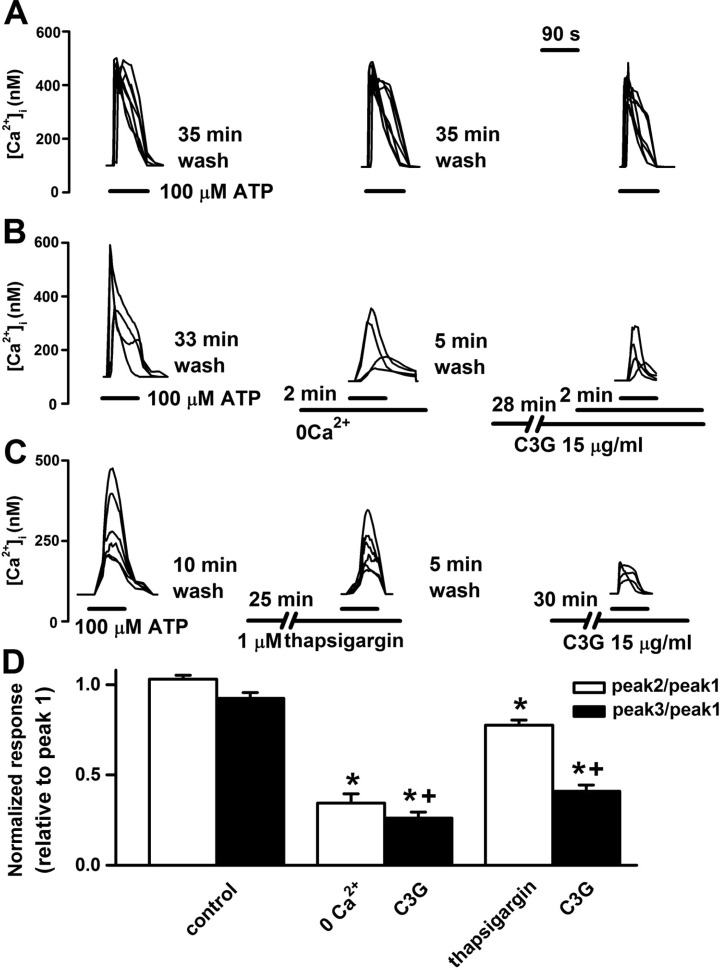 | Fig. 2Inhibitory effects of cyanidin-3-glucoside on ATP-induced a release of Ca2+ from intracellular stores and an influx of Ca2+ from the extracellular space. (A) Reproducible [Ca2+]i increases were elicited by superfusion with 100 µM ATP for 90 sec at 35 min intervals. (B) Removal of extracellular Ca2+ with the 100 µM EGTA-containing Ca2+-free HEPES-HBSS for 2 min inhibited the ATP-induced responses. Pretreatment with cyanidin-3-glucoside (15 µg/ml) for 30 min inhibited the ATP-induced responses in the presence of the Ca2+-free HEPES-HBSS. (C) Pretreatment with thapsigargin (1 µM) for 25 min inhibited the ATP-induced responses. Cyanidin-3-glucoside inhibited the ATP-induced responses after treatment of thapsigargin. (D) The ATP-induced response is presented as a ratio of the initial control (relative to peak 1) after treatment of vehicle (control, n=27), Ca2+-free solution (0 Ca2+, n=22), 0 Ca2+ plus cyanidin-3-glucoside (C3G, n=22), thapsigargin (n=19), and thapsigargin plus cyanidin-3-glucoside (C3G, n=19). Data are means±SEM. *p<0.01 relative to respective control (one-way ANOVA with Bonferroni's test). †p<0.01 relative to 0 Ca2+ or thapsigargin (non-paired Student's t-test).
|
Pretreatment with an endoplasmic reticulum (ER) Ca2+-ATPase inhibitor thapsigargin, which depletes and irreversibly prevents the refilling of intracellular stores [19], decreased the subsequent ATP-induced [Ca2+]i increases (relative to peak 1=77.5±2.8%, n=19). Treatment with cyanidin-3-glucoside for 30 min also inhibited the ATP-induced responses in thapsigargin-treated cells (relative to peak 1= 40.9±3.4%, n=19, p<0.01) (Fig. 2C & D). These result suggest that cyanidin-3-glucoside inhibits ATP-induced [Ca2+]i increases by inhibiting an influx of Ca2+ from the extracellular space.
It has been reported that P2X2 receptors are expressed in the undifferentiated PC12 cells, which we used in this study [20]. Since there is no specific P2X2 receptor agonist, we used the relatively specific P2X2 receptor agonist 2-MeSATP to induce [Ca2+]i increases in PC12 cells [21]. Reproducible [Ca2+]i responses could be elicited by subsequent treatment with 2-MeSATP (100 µM) for 90 sec at 35 min interval (relative to peak 1=98.9±3.5%, n=31). Pretreatment with cyanidin-3-glucoside (15 µg/ml) for 30 min significantly inhibited the 2-MeSATP-induced [Ca2+]i responses (relative to peak 1=26.7±4.2% n=37, p<0.01) (Data not shown). These results suggest that cyanidin-3-glucoside inhibits P2X2 receptor-induced [Ca2+]i increases in PC12 cells.
It has been reported that there are store-operated calcium channels (SOC) in PC12 cell [22]. We tested whether cyanidin-3-glucoside affects the store-operated calcium entry (SOCE) following treatment with thapsigargin or ATP in the Ca2+-free condition (Fig. 3). Treatment with thapsigargin (1 µM) or ATP (100 µM)-containing Ca2+-free HEPES-HBSS (100 µM EGTA) for 10 min induced a Ca2+ release from intracellular stores. Subsequent treatment with 1.25 mM Ca2+-containing HEPES-HBSS induced SOCE-induced [Ca2+]i increases. Pretreatment with cyanidin-3-glucoside (15 µg/ml) for 30 min significantly inhibited the thapsigargin-induced SOCE responses by 57.8% and the ATP-induced responses by 88.0%. It has been reported that curcumin, a non-flavonoid polyphenol [23], inhibits SOCE in Jukat-T cells [24].
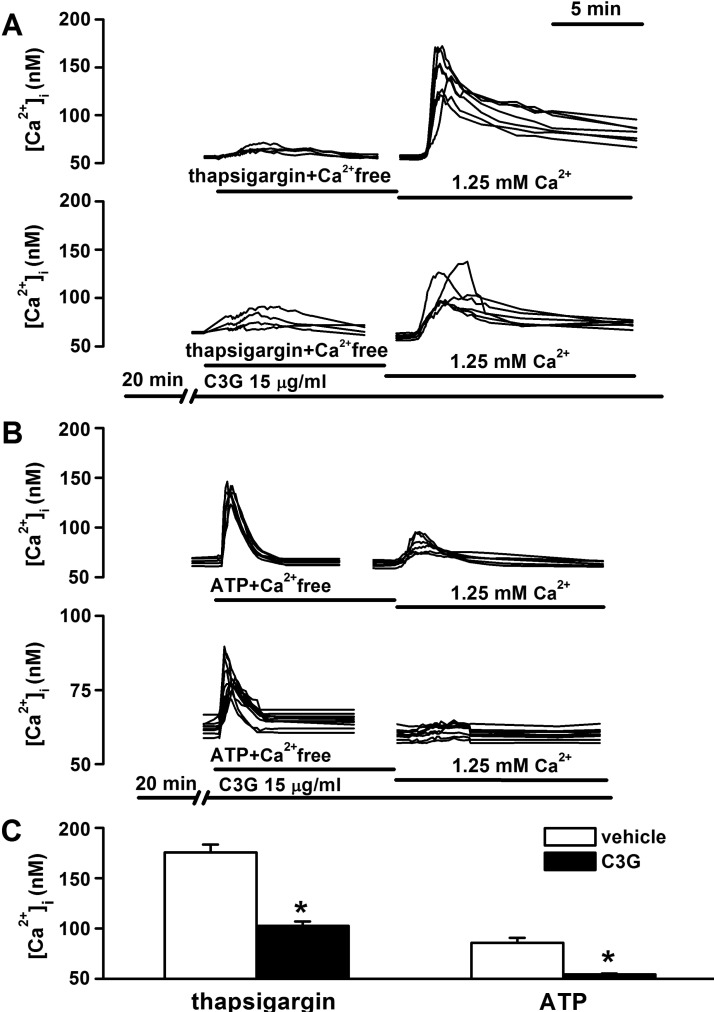 | Fig. 3Inhibitory effects of cyanidin-3-glucoside on thapsigarin or ATP-induced store-operated calcium entry (SOCE). Treatment with thapsigargin (1 µM) (A) or ATP (100 µM) (B)-containing Ca2+-free HEPES-HBSS (100 µM EGTA) for 10 min induced a release of Ca2+ from intracellular stores in the absence or presence of cyanidin-3-glucoside. Subsequent treatment with 1.25 mM Ca2+-containing HEPES-HBSS induced SOCE-induced [Ca2+]i increases. D, The thapsigargin or ATP-induced SOCE is presented as [Ca2+]i increases in non-treated (vehicle, n=27; ATP, n=32) or cyanidin-3-glucoside-treated (vehicle, n=27; ATP, n=33) cells. Data are means± SEM. *p<0.01 relative to respective vehicle (non-paired Student's t-test).
|
ATP depolarizes a cell membrane through the P2X-receptor-mediated influx of Na+ and Ca2+ [25], and secondarily activates voltage-gated Ca2+ channels in PC12 cells [1]. Since the L-type and N-type Ca2+ channels are expressed in the PC12 cells [26], we tested whether cyanidin-3-glucoside affects the ATP-induced secondary Ca2+ influx through voltage-gated L-type and N-type Ca2+ channels (Fig. 4). Pretreatment with both the L-type Ca2+ channel antagonist nimodipine (3 µM) and the N-type Ca2+ channels blocker ω-conotoxin (3 µM) for 5 min significantly inhibited the ATP-induced [Ca2+]i responses (relative to peak 1=62.0±8.4%, n=27), indicating that nimodipine and ω-conotoxin-sensitive and -insensitive pathways are involved in the ATP-induced [Ca2+]i responses. Moreover, treatment for 30 min with cyanidin-3-glucoside (15 µg/ml) further inhibited the ATP-induced responses in the presence of both nimodipine and ω-conotoxin (relative to peak 1=20.1±2.5%, n=23, p<0.01). To confirm the inhibitory effects of cyanidin-3-glucoside on the secondary Ca2+ influx through ATP-induced activation of voltage-gated Ca2+ channels, we tested whether cyanidin-3-glucoside inhibits depolarization-induced [Ca2+]i increase using high KCl-containing solution (Fig. 4B). Reproducible [Ca2+]i increases were induced by treatment for 60 sec with 50 mM KCl-containing HEPES-HBSS at 35 min interval. Pretreatment for 30 min with cyanidin-3-glucoside (15 µg/ml) significantly inhibited the subsequent high KCl-induced [Ca2+]i responses (relative to peak 1= 55.1±7.2%, n=26, p<0.01). However, the inhibitory effects were not completely recovered after the washout (recovery for control: 98.0±4.8%, n=27; recovery for C3G: 79.9±3.4%, n=26, p<0.01). These results suggest that cyanidin-3-glucoside inhibits ATP-induced [Ca2+]i increases by inhibiting multiple pathways which are an influx of Ca2+ through the nimodipine and ω-conotoxin-sensitive and -insensitive pathways and a release of Ca2+ from intracellular stores. Phenolic compounds have been reported to inhibit several kinases involved in signal transduction, mainly tyrosine kinase and protein kinase C [27,28]. We tested whether cyanidin-3-glucoside inhibits ATP-induced [Ca2+]i increases through an inhibition of tyrosine kinase or protein kinase C (Fig. 5). Each pretreatment for 30 min with a non-specific protein kinase C inhibitor staurosporin (100 nM), a specific protein kinase C inhibitor GF109203X (300 nM) and a tyrosine kinase inhibitor genistein (50 µM) did not affect the inhibitory effects of cyanidin-3-glucoside on ATP-induced [Ca2+]i increases. These results indicate that cyanidin-3-glucoside inhibits ATP-induced calcium signaling in a protein kinase-independent manner.
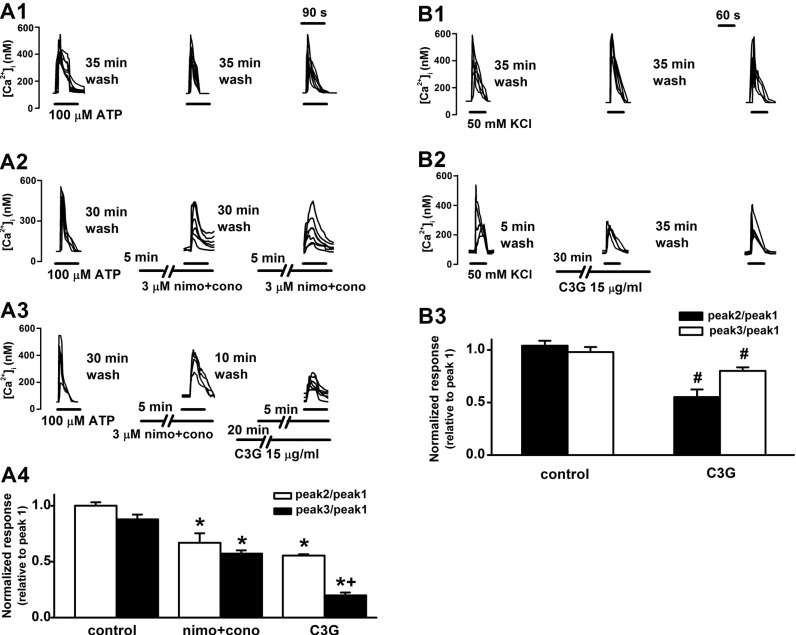 | Fig. 4Inhibitory effects of cyanidin-3-glucoside on ATP or high KCl-induced [Ca2+]i increases through voltage-gated Ca2+ channels. (A) Effects of nimodipine, ω-conotoxin and cyanidin-3-glucoside on ATP (100 µM)-induced [Ca2+]i increases. Reproducible [Ca2+]i increases were elicited by superfusion with 100 µM ATP for 90 sec at 35 min intervals (A1). Pretreatment with both nimodipine (3 µM) and ω-conotoxin (3 µM) for 5 min inhibited the ATP (100 µM)-induced responses (A2). Pretreatment with cyanidin-3-glucoside (15 µg/ml) for 30 min further inhibited the ATP-induced responses in the presence of both nimodipine and ω-conotoxin (A3). The ATP-induced response is presented as a ratio of the initial control (relative to peak 1) after treatment of vehicle (control, n=25), nimodipine and ω-conotoxin (nimo+cono, n=27) and nimodipine and ω-conotoxin plus cyanidin-3-glucoside (C3G, n=23) (A4). (B) Effects of cyanidin-3-glucoside on 50 mM KCl-induced [Ca2+]i increases. Reproducible [Ca2+]i increases were elicited by superfusion with 50 mM KCl-containing HEPES HBSS for 60 sec at 35 min interval (B1). Pretreatment with cyanidin-3-glucoside (15 µg/ml) for 30 min inhibited the high KCl-induced [Ca2+]i responses (B2). The KCl-induced response is presented as a ratio of the initial control after treatment of vehicle (control, n=25) or cyanidin-3-glucoside (C3G, n=26) (B3). Data are means±SEM. *p<0.01 relative to respective control (one-way ANOVA with Bonferroni's test), †p<0.01 relative to nimodipine and ω-conotoxin-treated cells (paired Student's t-test and one-way ANOVA with Bonferroni's test), #p<0.01 relative to respective control (non-paired Student's t-test).
|
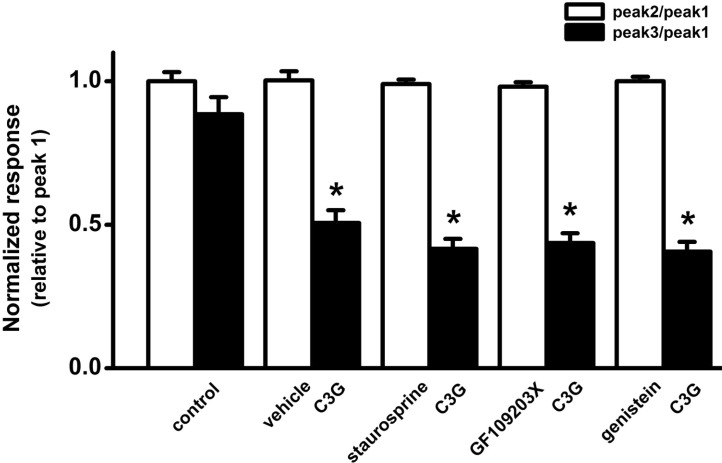 | Fig. 5Effects of protein kinase inhibitors on cyanidin-3-glucoside-induced inhibition of ATP-induced [Ca2+]i increases. A non-specific PKC inhibitor staurosporine, a specific PKC inhibitor GF109203X, and a tyrosine kinase inhibitor genistein did not affect the cyanidin-3-glucoside-induced inhibition of ATP-induced [Ca2+]i increases. The effects of protein kinase inhibitors on cyanidin-3-glucoside-induced inhibition of the ATP-induced responses are presented as a ratio of the initial control (relative to peak 1) after non-treatment (control, n=25) and co-treatment of cyanidin-3-glucoside (15 µg/ml) with vehicle (vehicle, n=21), staurosporine (100 nM, n=29), GF109203X (300 nM, n=31 ), genistein (50 µM, n=32). Data are expressed as means±SEM. *p<0.05 relative to respective control, and respective protein kinase inhibitor (or vehicle) (non-paired Student's t-test).
|
In this study, cyanidin-3-glucoside inhibited ATP-induced [Ca2+]i increase. Increases in [Ca2+]i have been reported to induce a mitochondrial depolarization [2]. We tested whether cyanidin-3-glucoside affects ATP-induced mitochondrial depolarization through calcium signaling using rhodamine 123 (Fig. 6). Treatment with 100 µM ATP for 30 min induced a mitochondrial depolarization. Treatment for 30 min with cyanidin-3-glucoside (15 µg/ml) alone did not affect the mitochondrial membrane potential, but it significantly inhibited the ATP-induced mitochondrial depolarization (p<0.05, n=26). Treatment for 30 min with the intracellular Ca2+ chelator BAPTA-AM (10 µM) further blocked the ATP-induced mitochondrial depolarization in the presence of cyanidin-3-glucoside (p<0.01, n=27). These results suggest that cyanidin-3-glucoside inhibits the ATP-mitochondrial depolarization by inhibiting [Ca2+]i increases. In the following experiment, we determined whether cyanidin-3-glucoside inhibits the ATP-induced depolarization by inhibiting a Ca2+ influx from the cytosol into the mitochondria. Treatment for 30 min with the mitochondrial Ca2+ uniporter inhibitor RU360 (10 µM) alone did not affect the mitochondrial membrane potential (RU360, n=23), but it also further blocked the ATP-induced mitochondrial depolarization in the presence of cyanidin-3-glucoside (p<0.01, n=35). These results suggest that cyanidin-3-glucoside inhibits ATP-induced mitochondrial depolarization by inhibiting a Ca2+ influx into the mitochondria.
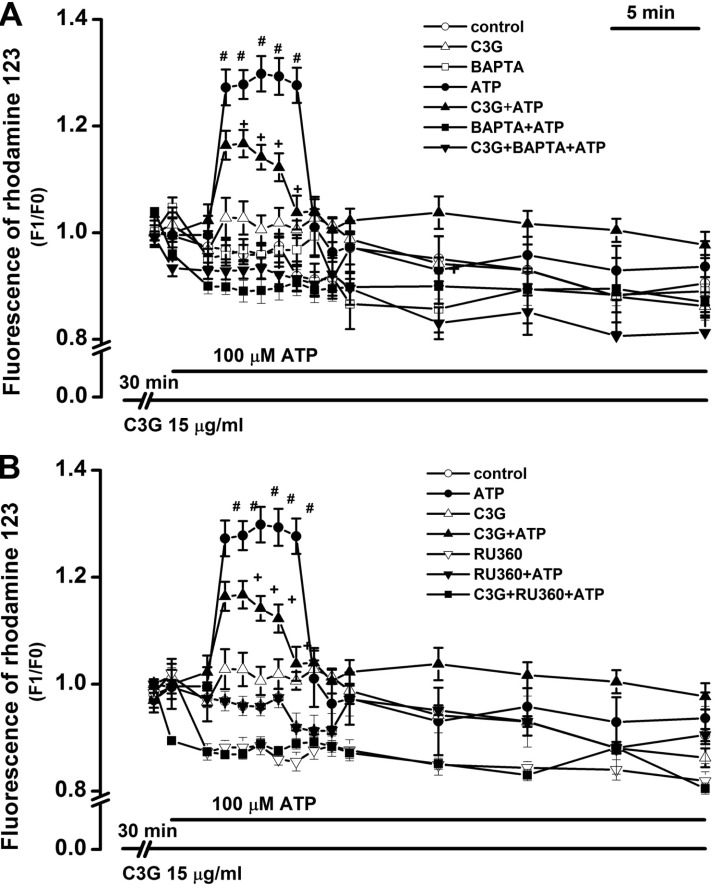 | Fig. 6Inhibitory effects of cyanidin-3-glucoside on ATP-induced depolarization of mitochondrial membrane potential through a Ca2+ influx from the cytosol into the mitochondria. (A) Inhibitory effects of the intracellular Ca2+ chelator BAPTA-AM and cyanidin-3-glucoside on ATP-induced mitochondrial depolarization. Treatment with 100 µM ATP for 30 min induced mitochondrial depolarization (ATP, n=27). Treatment for 30 min with cyanidin-3-glucoside (15 µg/ml) alone did not affect the membrane potential (C3G, n=26), but it significantly inhibited the mitochondrial depolarization (C3G +ATP, n=26). Treatment for 30 min with BAPTA-AM (10 µM) alone did not affect the membrane potential (BAPTA, n=22), but it blocked the ATP-induced mitochondrial depolarization in the absence (BAPTA+ATP, n=22) or presence (C3G+BAPTA+ATP, n=27) of cyanidin-3-glucoside. (B) Inhibitory effects of the mitochondrial Ca2+ uniporter inhibitor RU360 and cyanidin-3-glucoside on ATP-induced mitochondrial depolarization. Treatment for 30 min with RU360 (10 µM) alone did not affect the membrane potential (Ru360, n=23), but it blocked the ATP-induced mitochondrial depolarization in the absence (Ru360+ATP, n=38) or presence (C3G+RU360+ATP, n=35) of cyanidin-3-glucoside. Change in mitochondrial membrane potential was shown as a ratio of the initial intensity of fluorescence (F1/F0). Data are expressed as mean±S.E. #p<0.01 relative to control, C3G, BAPTA, BAPTA+ ATP, C3G+BAPTA+ATP, RU360, RU360+ATP, and C3G+ RU360+ATP (two-way ANOVA with Bonferroni's test). †p<0.05 relative to ATP (two-way ANOVA with Bonferroni's test).
|
Increase in [Ca2+]i has been reported to induce formation of ROS [29]. In this study, cyanidin-3-glucoside inhibited ATP-induced mitochondrial depolarization. We checked whether cyanidin-3-glucoside affects ATP-induced formation of ROS through calcium signaling using H2DCFDA (Fig. 7). Treatment with 100 µM ATP for 30 min increased formation of ROS. Treatment for 30 min with cyanidin-3-glucoside (15 µg/ml) significantly inhibited the formation of ROS. Treatment with BAPTA-AM (10 µM) for 30 min further decreased the ATP-induced formation of ROS below the basal levels in the absence or presence of cyanidin-3-glucoside. These results suggest that cyanidin-3-glucoside inhibits ATP-induced formation of ROS by inhibiting Ca2+-induced mitochondrial depolarization.
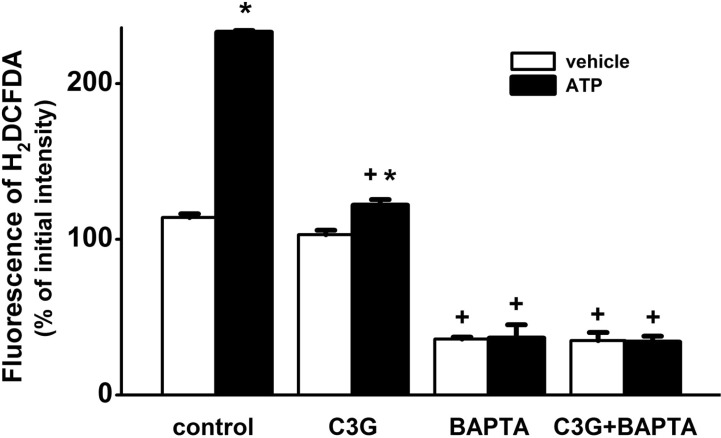 | Fig. 7Inhibitory effects of BAPTA-AM and cyanidin-3-glucoside on ATP-induced formation of ROS. Treatment for 30 min with 100 µM ATP significantly increased formation of ROS. Pretreatment for 30 min with cyanidin-3-glucoside (15 µg/ml) or BAPTA-AM (10 µM) blocked the ATP-induced formation of ROS. The formation of ROS was shown as a percentage of the initial intensity of the fluorescence of H2DCFDA (F1/F0×100) in non-treated, cyanidin-3-glucoside-treated, BAPTA-AM-treated, cyanidin-3-glucoside plus BAPTA-AM-treated in the absence (vehicle, n=24; C3G, n=26; BAPTA, n=22; C3G+BAPTA, n=22, respectively) or presence (vehicle, n=24; C3G, n=26; BAPTA, n=23; C3G+BAPTA, n=23, respectively) of ATP. Data are expressed as mean±S.E. *p<0.01 relative to respective vehicle (non-paired Student's t-test), †p<0.01 relative to respective control and C3G (non-paired Student's t-test).
|
Go to :
DISCUSSION
The present study suggests that cyanidin-3-glucoside clearly inhibits ATP-induced [Ca2+]i increases in PC12 cells by inhibiting multiple pathways which are an influx of extracellular Ca2+ and a release of Ca2+ from intracellular stores. Cyanidin-3-glucoside inhibits ATP-induced formation of ROS through Ca2+-induced mitochondrial depolarization.
In this study, cyanidin-3-glucoside inhibited ATP-induced [Ca2+]i increases in PC12 cells by inhibiting a release of Ca2+ from intracellular stores through activation of P2Y-receptor-mediated PLC and an influx of extracellular Ca2+, which are the nimodipine and ω-conotoxin-sensitive and -insensitive pathways and ionotropic P2X2 receptors. Cyanidin-3-glucoside also inhibited the SOCE-induced [Ca2+]i increase induced by ATP. The multiple inhibitory effects of phenolic compounds on agonist-induced calcium signaling in neuronal cells have been reported in our previous studies. A simple phenolic compound octyl gallate has been reported to inhibit ATP-induced calcium signaling in PC12 cells by inhibiting a release of Ca2+ from intracellular stores and an influx of Ca2+ from the extracellular space through P2X receptor non-selective cation channels and voltage-gated Ca2+ channels [30]. In addition, apigenin [12] and phenolic compound-containing acorn extract [31] have been reported to inhibit glutamate-induced calcium signaling by inhibiting a release of Ca2+ from intracellular stores and an influx of Ca2+ from the extracellular space through ionotropic glutamate receptors and voltage-gated Ca2+ channels in cultured rat hippocampal neurons. Another flavonoid proanthocyanidin has been reported to inhibit the glutamate-induced calcium signaling by inhibiting a release of Ca2+ from intracellular stores and an influx of Ca2+ through ionotropic glutamate receptors without affecting the voltage-gated Ca2+ channels in cultured rat hippocampal neurons [13]. The inhibitory effects of polyphenols such as curcumin [24] and hawthorn extract WS ®1442 [32] on SOCE have been also reported.
Flavonoids have been reported to interact with the membrane lipid bilayer to exert their biological functions [33]. The location of interaction between the flavonoids and the membrane has been reported to be either at the surface of cell membrane or in the hydrophobic core of membrane based on their chemical properties [34]. The membrane lipid can affect ion channel structure and function [35]. Therefore, it is possible that cyanidin-3-glucoside inhibit ATP-induced Ca2+ signaling by interacting directly with multiple ion channels in the cell membrane and indirectly through the membrane lipid. In a future study, the details of how cyanidin-3-glucoside inhibits ATP-induced [Ca2+]i increases at the molecular level should be investigated.
Protein phosphorylation such as tyrosine phosphorylation and serine-threonine phosphorylation can induce an influx of extracellular Ca2+ [36,37]. ATP was found to activate PLC in PC12 cells [1], which can activate PKC. ATP was also found to activate tyrosine kinase in PC12 cells [38]. Each pretreatment with a tyrosine kinase inhibitor genistein, a non-specific protein kinase C inhibitor staurosporin, and a specific protein kinase C inhibitor GF109203X did not affect the inhibitory effects of cyanidin-3-glucoside on ATP-induced [Ca2+]i increases. These results indicate that cyanidin-3-glucoside inhibits ATP-induced calcium signaling in a protein kinase-independent manner. A simple phenolic compound octyl gallate has been also reported to have the same protein kinase-insensitive inhibitory effects on ATP-induced calcium signaling in PC12 cells [30].
In this study, cyanidin-3-glucoside inhibited ATP-induced [Ca2+]i increase. Increases in [Ca2+]i have been reported to induce a mitochondrial depolarization [2] and a formation of ROS [29]. The mitochondrial matrix Ca2+ overload can also enhance a formation of ROS [3]. In this study, cyanidin-3-glucoside inhibited the mitochondrial depolarization and the formation of ROS. The intracellular Ca2+ chelator BAPTA-AM or the mitochondrial Ca2+ uniporter inhibitor RU360 further blocked the ATP-induced mitochondrial depolarization in the presence of cyanidin-3-glucoside. In addition, BAPTA-AM also further decreased the ATP-induced formation of ROS below the basal levels in the presence of cyanidin-3-glucoside. The black soybean cyanidin-3-glucoside has been reported to inhibit glutamate-induced excessive formation of ROS and mitochondrial depolarization in rat cultured cortical neuron [18]. All these results suggest that cyanidin-3-glucoside inhibits ATP-induced formation of ROS by inhibiting Ca2+-induced mitochondrial depolarization. Moreover, cyanidin-3-glucoside has been reported to have a neuroprotective effect against neuronal cell death [15,16,17,39]. All these reports suggest a possibility that cyanidin-3-glucoside can induce protection against agonist-induced neuronal cell death through inhibiting Ca2+ signals, oxidative stress, and mitochondrial depolarization.
Go to :
 XML Download