

 PDF
PDF ePub
ePub Citation
 Print
Print


INTRODUCTION
Epidemiologic studies have shown positive correlations between epilepsy itself and comorbid vascular diseases. Patients with epilepsy suffer mildly increased mortality from ischemic heart disease, with standardized mortality ratios (SMRs) between 1.2 and 2.5 in developed countries. This vascular risk might be further exacerbated by enzymatically active antiepileptic drugs (AEDs) [1]. Process of epileptogenesis and long-term use of certain antiepileptic drugs have been shown to cause increase in plasma concentration of lipoproteins [2], elevated plasma concentration of homocysteine (Hcy) [3], increase in reactive oxygen species [4] and associated vascular endothelial dysfunctions [5].
A number of experimental and clinical reports suggest the involvement of oxidative stress in pathophysiology of epilepsy. The increased free radicals result in membrane lipid peroxidation and decreased glutathione concentrations in the epileptic focus [6]. In addition various antiepileptic drugs especially from the old generation may impair the endogenous antioxidative ability to prevent oxidative stress and trigger oxygen-dependent tissue injury [7].
Homocysteine and its oxidative product, homocysteic acid, are linked with epileptogenesis as they are potent agonists of the N-methyl-D-aspartate (NMDA)-type glutamate receptor [8]. Additionally Hcy reduces the seizure threshold through sequestration of an endogenous anticonvulsant (adenosine) [9]. Up to 20% of patients with homocystinuria and patients with high plasma concentrations of Hcy (50~200 mmol/L) have seizures [10]. At the vascular level during auto oxidation of Hcy in plasma, reactive oxygen species (ROS) are generated. ROS initiate lipid peroxidation in circulating lipoproteins and cell membranes, potentially responsible for endothelial dysfunction [11]. Elevated plasma Hcy has been associated with cardiovascular disease in multiple large-scale epidemiologic studies and, consequently, it is considered as an independent risk factor for atherosclerosis [12].
Chuang and his colleagues [13] compared the long-term impact of different categories of AEDs monotherapy on atherosclerosis development. The team recruited 160 adult patients with epilepsy who had received AEDs monotherapy for more than 2 years, common carotid artery (CCA) intima media thickness (IMT) a measurement used to assess the extent of atherosclerosis. Patients who were under long-term monotherapy with; phenytoin, carbamazepine or valproic acid displayed a significant increase in CCA-IMT measurements. Researchers investigated specific vascular risk factors associated with the type of AED therapy. Epilepsy patients taking carbamazepine or phenytoin for long periods exhibited increased levels of cholesterol, total Hcy and lower levels of folate, all of which increased risk of adverse cardiovascular and cerebrovascular events. Patients who were treated with valproic acid displayed elevated levels of uric acid, Hcy, and thiobarbituric acid reactive substances (TBARS) increasing atherosclerosis risk which the authors believe is based on oxidative mechanisms. The authors argue that drug choice should be carefully selected for epilepsy patients requiring long-term AED treatment, particularly in elderly or individuals at high-risk of vascular events.
The antiepileptic drug lamotrigine (LTG) a non-enzyme-inducing AED acts by blocking voltage-sensitive sodium channels of the neuronal membrane and inhibiting release of excitatory amino acids such as glutamate and aspartate [14]. The information regarding the interactions between LTG and oxidative stress is scarce [13]. The present study aimed to study the possible modulation of vascular and metabolic risk factors of epileptogenesis by LTG, in addition the effect of LTG itself on the process of epileptogenesis was considered in a rat model of epilepsy induced by Pentylenetetrazole (PTZ). PTZ kindling is widely accepted as an experimental animal model for epileptogenesis and estimating the effectiveness of antiepileptic drugs [15].
Go to : 
METHODS
Drugs and chemicals
LTG was a free gift from Indsaff (India). PTZ, phenylephrine and acetylcholine were purchased from Sigma Chemical Co. (St. Louis, MO, USA).
Experimental animals
The study was performed in 28 male Wistar rats weighing 150~200 g. The protocol was approved by the Institutional Animal Ethics Committee for Faculty of Medicine, Ain Shams University, Cairo, Egypt. The rats were maintained under standard laboratory conditions with natural light-dark cycle. They were allowed standard pellet diet and tap water ad libitum.
Experimental procedures
PTZ and LTG were freshly prepared throughout the study. PTZ was dissolved in 0.9% saline and injected intraperitoneally (i.p.) on alternate days for 5 weeks. LTG was dissolved in warm water and administered orally (p.o) daily for 5 weeks.
1. Study Design
The rats were randomly divided into 4 groups (7 rats each). Vehicle control group, was given 1ml saline i.p. & p.o. PTZ group, was given PTZ (30 mg/kg, i.p) every other day [16]. PTZ/LTG group, was given LTG (20 mg/kg/day p.o) [17], and alternate day PTZ. LTG group was given LTG (20 mg/kg/day p.o). PTZ was administered until seizure stage 5 on two consecutive trials was achieved. LTG was administered 90 min before PTZ administration.
2. Pentylenetetrazole (PTZ) kindling
The rats were injected with a sub-convulsive dose of PTZ (30 mg/kg) on every alternate day for 5 week then rats were observed for 30 min after each PTZ injection for convulsive behavior. Seizure activity was evaluated using Racine scale [18]: Stage 0: no response; stage 1: hyperactivity, vibrissae twitching; stage 2: head nodding, head clonus and myoclonic jerk; stage 3: unilateral forelimb clonus; stage 4: rearing with bilateral forelimb clonus; stage 5: generalized tonic clonic seizure (GTCS) with loss of writing reflex.
The latencies to GTCS were recorded. The latencies were transformed into seizure score [19] which was calculated using the following formula:
Rats were considered kindled if they exhibited stage 5 of seizures on two consecutive trials. The score was zero for PTZ treated rats and one for control rats. Rats were also observed for 24 h mortality.
Blood sampling, tissue preparation and biochemical measurements
Upon completion of epilepsy severity evaluation, blood samples were collected from the femoral vein under urethane anesthesia (1.2 g/kg). Samples were centrifuged for 15 min 5000 rpm. Serum was separated and used for measurement of lipid profile, homocysteine, malondialdehyde and reduced glutathione. Thereafter, the rats were decapitated and the brain, heart and aorta were quickly removed. The heart was cut transversally from the middle. The aorta was divided into 3 parts; one was kept in Krebs solution for isolated organ bath study. The second one was kept in eppendorf and stored at -20℃ till biochemical measurements (samples were homogenized in phosphate buffer (0.5 M; pH=7.0), (1/10 w/v) then centrifuged for 5 min at 700×g at 4℃. Aliquots of homogenates were used for estimation of malondialdehyde and reduced glutathione). The third aortic tissue was kept in formaldehyde 10% with heart and brain for histological studies.
1. Serum lipid profile (mg/dl)
Total serum cholesterol, triglycerides, HDL-cholesterol and LDL-cholesterol were estimated by using Synchron cx5 autoanalyzer (Beckman, USA). The atherogenic index was calculated using the formula of Schulpis and Karikas [20] as follows: Atherogenic Index of Plasma (AIP)=Log (TG/HDLC), Triglycerides and HDL-cholesterol in AIP reflect the balance between the atherogenic and protective lipoproteins.
2. Serum total homocysteine (tHcy) measurement
Serum tHcy levels were determined by using rat Hcy ELISA kit (Cusabio, China) according to the manufacture guide.
Vascular reactivity studies:
The excised part of the descending thoracic aorta was removed to a petri dish containing Krebs solution continuously gassed with 95% O2 and 5% CO2 and was carefully cleaned of adherent connective tissue to avoid injury of the endothelial layer. Rings about 7~9 mm width were prepared and mounted between 2 parallel hooks made of stainless steel wire in a 15 ml water jacketed organ bath filled with modified Krebs solution composed of (mM) NaCl (118.2), KCl (4.6), CaCl2.2H2O (1.6), NaHCO3 (24.8), MgSO4 (1.2), KH2PO4 (1.2), MgSO4 (1.2), glucose (10.0), that was continuously gassed with 95% O2 and 5% and temperature was adjusted 37℃ [21]. An initial resting tension of 4 grams was set and the rings were then allowed to equilibrate for 1~2 hrs. Incubation solution was routinely changed every 15 min as a precaution against interfering metabolites. Isometric responses were measured with a force transducer (K30, Hugo Sacks Electronics, Freiburg, Germany) connected to a bridge coupler type 570 and the trace was displayed on a two channel recorder (Lineacorder, HSE, WR3310).
Experimental procedure
After the equilibration period a cumulative concentration response curve to phenylephrine (10-10 M-10-4 M) was constructed by increasing the concentration of phenylephrine, allowing equilibrium to be obtained at each concentration, then the mean effective concentration 50 (EC50) and the maximal contractile response (E-max) to phenylephrine were determined. Endothelium-dependent relaxation was tested by applying acetylcholine (10-9 M-10-4 M) in the same sequence of phenylephrine after adding the concentration of phenylephrine that causes sub-maximal contraction. Percent of acetylcholine induced relaxation in isolated aortic ring was determined.
Brain studies
1. Hippocampal histopathological studies
Five µm thickness paraffin sections of the Hippocampus were stained with H&E and toluidine blue to detect Nissl granules [22].
2. Hippocampal immunohistochemical staining
Caspase-3 technique was used for apoptosis detection and glial fibrillary acidic protein (GFAP) technique was used for detection of astrocytes [23]. Formalin-fixed paraffin sections of the brain were deparaffinized in xylene and rehydrated in ascending grades of ethanol. Endogenous peroxidase activity was quenched with Peroxidase block for 5 minutes. Sections were washed twice in phosphate-buffered saline (PBS). To prevent nonspecific absorption of immunoglobulin, sections were incubated for 10 minutes in Protein block serum-free (Dako Cytomation, Glostrup, Denmark). The slides were divided and then incubated with the appropriate primary antibody (Caspase-3 and GFAP) in a dilution of 1:100 overnight at 4℃. Slides incubated with PBS instead of primary antibody served as negative controls. Sections were then washed twice with PBS. Goat anti-Mouse Peroxidase Conjugated secondary antibody (Dako Cytomation, Glostrup, Denmark) at a dilution of 1:200 was applied to sections and incubated for 30 minutes at room temperature. DAB solution was used and incubated for 10 minutes followed by washing in distilled water and counter staining with haematoxylin. Sections were then cover slipped and examined using light microscopy.
Morphometric studies
Stained sections of hippocampus from each group were examined; five high power fields/ section were chosen to measure: the number of pyramidal cells with positive brownish caspase-3 immuno- reaction and the number of immuno-reactive star-shaped astrocytes stained by GFAP in CA3 region of the hippocampus. The sections were examined using ×40 objective (final magnification ×540) by Zeiss microscope.
Aortic and coronaries histopathological studies
Five µm thickness paraffin sections from heart and thoracic aorta obtained from all groups were stained with Haematoxylin and Eosin stain (H&E).
Statistical analysis
Statistical analysis was carried out using Graphpad prism, software program, version 5.0 (2007). Inc., CA, USA. All values in the results were expressed as means±SD For all parameters, statistical difference among 2 groups was determined by unpaired t-test difference among more than 2 groups was determined using one way analysis of variance; ANOVA followed by Newman-Keuls multiple comparison test. p values<0.05 were considered statistically significant.
In the experiment of phenylephrine induced contraction, all doses were transformed into Log value and the contractile responses for each preparation were expressed as a percentage of the maximum response achieved by each ring separately, which is considered in this cases, the 100% response of that particular ring, the next step was to plot the log concentration against the responses expressed as percentages, in a linear regression curve, then the EC50 as mean±SD for each group were determined.
Go to :
RESULTS
Effect of lamotrigine on the development of PTZ kindling and seizures scores
Racine score during all treatment period were significantly (p<0.05) lower in PTZ/LTG treated group (Fig. 1A). Repeated administration of a sub-convulsive dose of PTZ (30 mg/kg) on alternate days resulted in increasing convulsive activity leading to generalized tonic clonic seizures (GTCS); stage 5 in two consecutive trials in 27.14±0.83 days in the PTZ group. LTG treatment caused a significant delay in the development of kindling. GTCS stage 5 was observed after 34.0±0.31 days of PTZ injection in the LTG treated group (Fig. 1B). LTG significantly (p<0.05) increased the seizure score from 0 in the PTZ group to 0.2±0.07 (Fig. 1C).
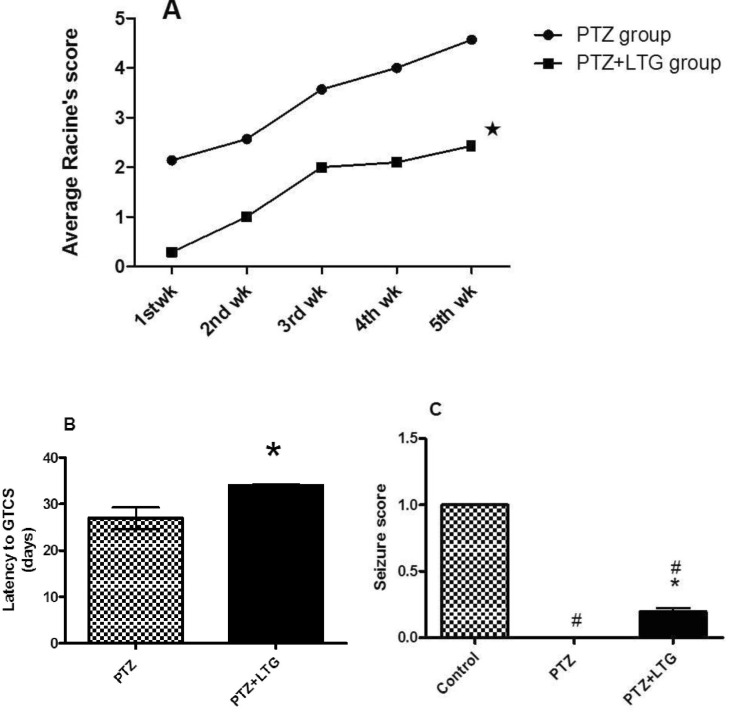 | Fig. 1(A-C) The effect of Pentylenetetrazole and lamotrigine on (A) average Racine score. (B) latency to GTCS (generalized tonic clonic seizures). (C) seizure score. PTZ (Pentylenetetrazole, 30 mg/kg), LTG (lamotrigine, 20 mg/kg). Data are expressed as mean±SD, number of animals=7. For average Racine's score and latency to GTCS, *p<0.05 compared to PTZ were determined by unpaired t-test. For seizure score; #p<0.05 compared to control group, *p<0.05 compared to PTZ group by analysis of variance (ANOVA) followed by Newman-Keuls multiple comparison test.
|
Effect of lamotrigine on lipid profile and atherogenic index
As shown in Table 1 PTZ treated group exhibited a significant increase in serum cholesterol (TC), triglyceride (TG) and low density lipoprotein-cholesterol (LDL-cholesterol), with significant decrease in serum high density lipoprotein-cholesterol (HDL-cholesterol) when compared to control group. PTZ-LTG treated group exhibited a significant decrease in serum TC, TG and LDL-cholesterol with significant increase in serum HDL-cholesterol when compared to PTZ treated group.
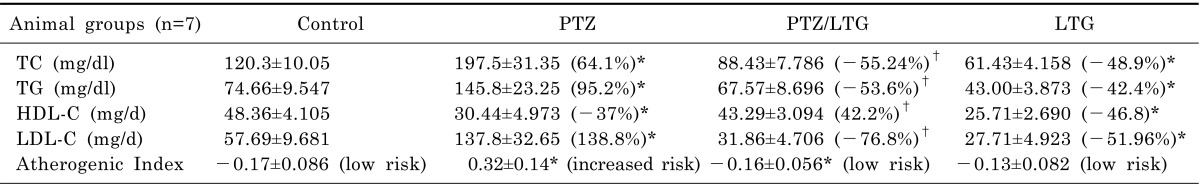
Table 1
Effect of lamotrigine on lipid profile and atherogenic index in normal and PTZ-treated rats
Data are expressed as mean±SD, number of animals (n)=7, PTZ (pentylenetetrazole, 30 mg/kg), LTG (lamotrigine, 20 mg/kg). TC, total cholesterol; TG, triglycerides; HDL-C, high density lipoprotein-cholesterol; LDL-C, low density lipoprotein-cholesterol. *p<0.05 compared to control group, †p<0.05 compared to PTZ group by analysis of variance (ANOVA), followed by Newman-Keuls multiple comparison test.
![]()
LTG alone group showed significant decrease in all serum lipids, It decreased TC, TG, LDL-cholesterol and HDL-cholesterol when compared to control group. PTZ treated group showed a significant increase in atherogenic risk (increased risk>0.21) while LTG either alone or with PTZ showed a significant decrease in atherogenic risk (low risk<0.11).
Effect of lamotrigine on serum total homocysteine level
Epileptogenesis induced by PTZ induced a significant (p<0.05) increase in serum total homocysteine (tHcy) levels when compared to control group (302.5% increase). LTG treatment either alone or with PTZ did not significantly change tHcy levels (p>0.05) when compared to control group (Fig. 2).
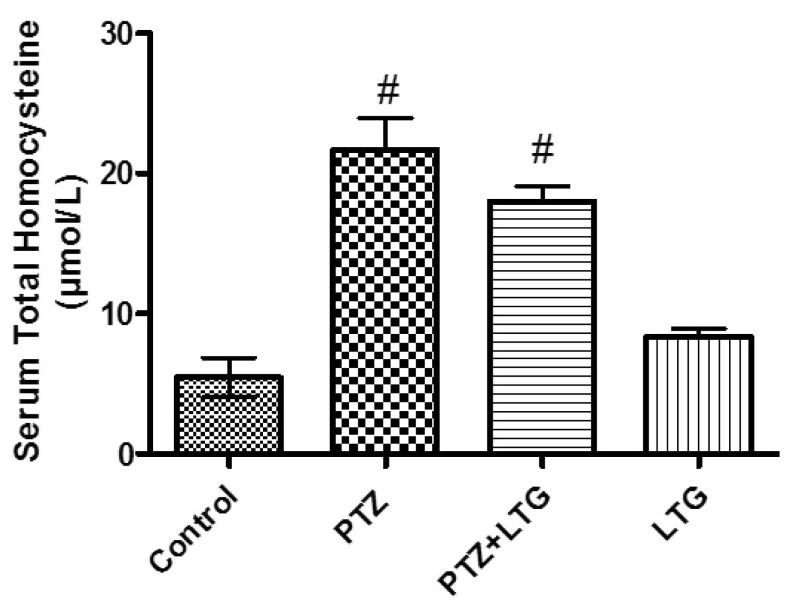 | Fig. 2Serum homocysteine level in control rats, PTZ treated rats, PTZ+LTG and LTG treated rats. PTZ (pentylenetetrazole, 30 mg/kg), LTG (lamotrigine, 20 mg/kg). Data are expressed as mean±SD, number of animals=7. #p<0.05 compared to control group by analysis of variance (ANOVA), followed by Newman-Keuls multiple comparison test.
|
Effect of lamotrigine on serum and aortic malondialdehyde (MDA) level
A significant (p<0.05) increase in MDA levels in serum and aortic tissue were observed in PTZ treated group when compared to control by mean percent change 373.1% and 297.4% respectively. The PTZ-LTG group showed a significant (p<0.05) decrease in MDA levels (serum and aortic) when compared to PTZ treated group by mean percent change (55% and 20.72%). LTG treatment alone caused no significant change in MDA level as compared to the control group in the serum but significant (p<0.05) increase in MDA levels in aortic samples was detected when compared to control group (Fig. 3).
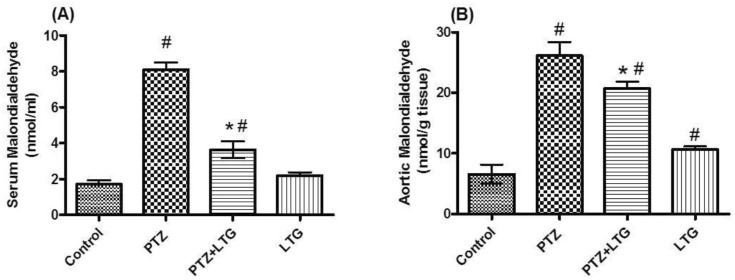 | Fig. 3(A, B) Serum and aortic malondialdehyde levels in control rats, PTZ treated rats, PTZ+LTG and LTG treated rats. PTZ (pentylenetetrazole, 30 mg/kg), LTG (lamotrigine, 20 mg/kg). Data are expressed as mean±SD, number of animals=7. #p<0.05 compared to control group, *p<0.05 compared to PTZ group by analysis of variance (ANOVA), followed by Newman-Keuls multiple comparison test.
|
Effect of lamotrigine on serum and aortic reduced glutathione level
A significant (p<0.05) decrease was observed in GSH levels in the PTZ and PTZ-LTG treated groups compared to control group in both serum and aortic tissues with no significant (p>0.05) difference between them. The LTG alone treated group had no significant (p>0.05) change in GSH serum level but a significant (p<0.05) decrease in mean percent change by 23.9% in aortic GSH level was detected compared to control group (Fig. 4).
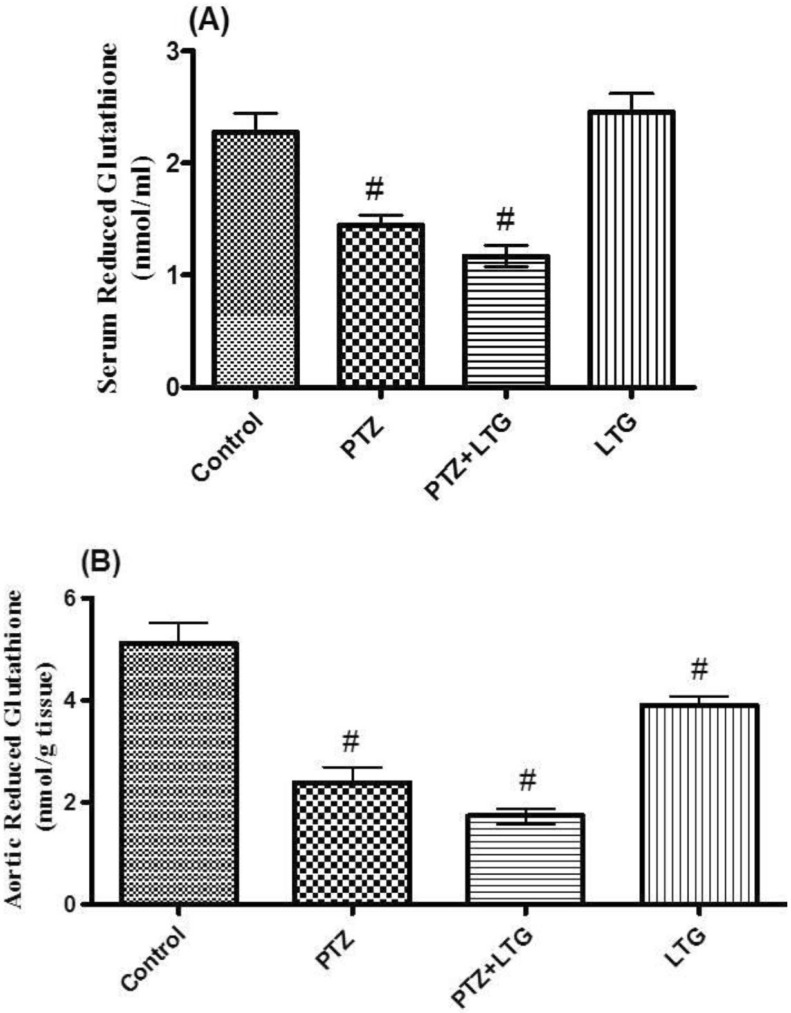 | Fig. 4(A, B) Serum and aortic reduced glutathione (GSH) levels in control rats, PTZ treated rats, PTZ+LTG and LTG treated rats. PTZ (pentylenetetrazole, 30 mg/kg), LTG (lamotrigine, 20 mg/kg). Data are expressed as mean±SD, number of animals=7. #p<0.05 compared to control group by analysis of variance (ANOVA), followed by Newman-Keuls multiple comparison test.
|
Correlation between tHcy and both lipid profile and oxidative stress parameters
We performed a correlation analysis between tHcy serum levels and both serum lipids and oxidative parameters to investigate whether tHcy levels were associated with the parameters related to PTZ-induced vascular changes and oxidative stress (Fig. 5). We demonstrated a significant correlation between tHcy and both LDL-cholesterol and TG levels, with insignificant correlation between tHcy and both total cholesterol land HDL-cholesterol levels.
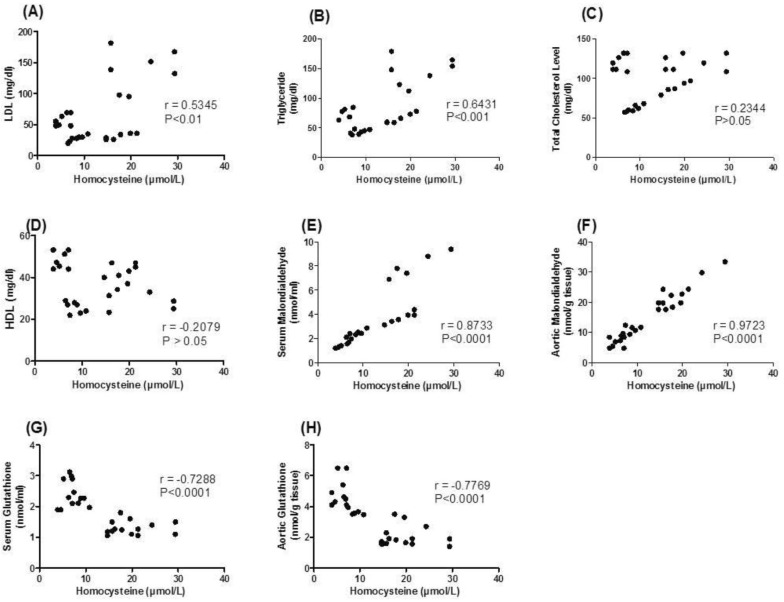 | Fig. 5(A-H) Pearson's correlation coefficients between serum total homocysteine (tHcy) concentration and both serum lipids and oxidative stress parameters in control, PTZ (Pentylenetetrazole) treated, PTZ+LTG (lamotrigine) and LTG treated rats. LDL, low density lipoprotein; HDL, high density lipoprotein.
|
As regard oxidative parameters there was a significant correlation between tHcy and both serum and aortic MDA and GSH levels. These results indicate that tHcy may increase risk of vascular diseases and increase oxidative stress in PTZ-induced epilepsy in rats.
Effect of lamotrigine on endothelial dysfunction studies
Contractile responses to PE significantly (p<0.05) increased in aortas isolated from PTZ treated group when compared to control group with increase in maximum contraction (E-max) induced by 80% and decrease in effective concentration 50 (EC50) by 90%. LTG treatment induced a significant (p<0.05) decrease of E-max and a significant increase in the EC50 (400%) in the aortas isolated from PTZ/LTG treated group when compared to PTZ treated group (Fig. 6A, B).
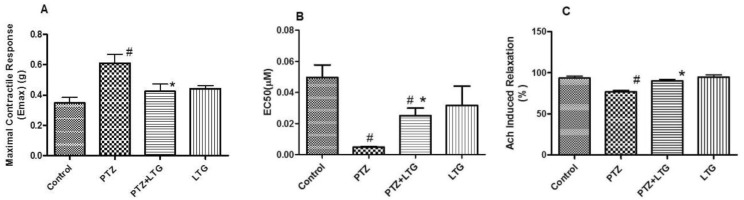 | Fig. 6(A) Maximal contractile response (E-max) induced by phenylephrine (PE). (B) Effective concentration 50 (EC50) of PE. (C) Relaxant responses to acetylcholine (Ach) in the endothelium-intact aortic rings of control rats, PTZ treated rats, PTZ+LTG and LTG treated rats. PTZ (pentylenetetrazole, 30mg/kg), LTG (lamotrigine, 20 mg/kg).Data are expressed as mean±SD, number of animals=7. #p<0.05 compared to control group, *p<0.05 compared to PTZ group by analysis of variance (ANOVA), followed by Newman-Keuls multiple comparison test.
|
Endothelium-dependent relaxant response to Ach was significantly (p<0.05) impaired (17.5%) in the aortas isolated from PTZ treated group compared to control group (Fig. 6C). On the other hand LTG treatment in PTZ treated rats significantly (p<0.05) improved the impaired relaxant response caused by PTZ (16.4%).
Effect of lamotrigine on histopathological changes
1. Brain histopathological and immunohistochemical staining changes
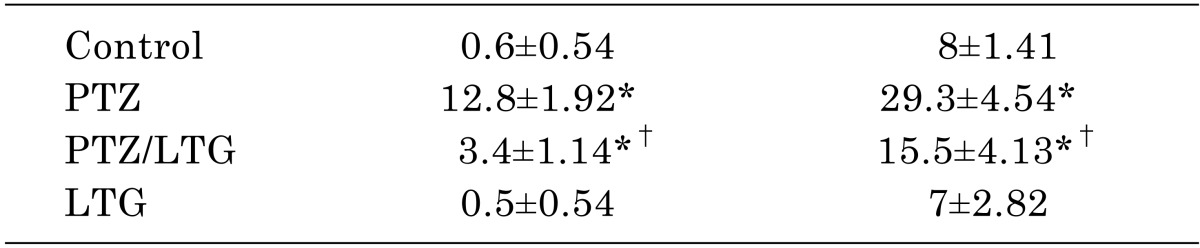
PTZ treated group had an apparent decrease in the number of pyramidal cells and their content of Nissl granules in CA3 area of the hippocampus (Fig. 7A2, B2) compared to control group (Table 2, Fig. 7A1, B1). Significant (p<0.05) increase in number of positive brownish caspase-3 immuno- reaction in pyramidal cells and immune GFAP reactive astrocytes were detected (Fig. 7C2, D2) compared to that of control group (Fig. 7C1, D1).
 | Fig. 7(rows A-D): A photomicrograph of CA3 region of the hippocampus: Row A, - Stained with H&E, ×540; (1) Control rat: notice that the pyramidal layer is formed of closely packed pyramidal cells with vesicular nuclei (↑). (2) Pentylenetetrazole (PTZ) treated rat: showing the presence of many deeply stained cells having pyknotic nuclei and perineuronal spaces (▸) an apparent decrease in the number of the pyramidal cells. (3) PTZ-Lamotrigine (LTG) treated rat: Pyramidal cells having vesicular nuclei and basophilic cytoplasm (↑). Few shrunken, darkly stained neurons are seen (▸) within the pyramidal layer. (4) LTG treated rat: nearly similar to control group (↑). Row B, Stained with Toluidine blue ×540: (1) Control rat: cytoplasm of the pyramidal cells appears studded with Nissl granules (↑). (2) PTZ treated rat: an apparent decrease in the Nissl granules of the pyramidal cells (↑). (3) LTG-PTZ treated rat: an apparent increase in the Nissl granules content of the pyramidal cells (↑) compared to that of PTZ treated rats. (4) LTG treated rat: picture nearly similar to control group. Row C, stained with Caspase-3 ×540; (1) Control rat: negative caspse-3 immuno- reaction in pyramidal cells. (2) PTZ treated rat: positive brownish caspase-3 immuno- reaction in pyramidal cells (↑). (3) PTZ-LTG treated rat: positive brownish caspase-3 immuno- reaction in few pyramidal cells (↑) when compared to PTZ group. (4): LTG treated rat: negative caspase-3 immuno- reaction in pyramidal cells. Row D, stained with Glial fibrillary acidic protein (GFAP) ×540. (1) Control rat: positive reaction for GFAP immuno-staining in few astrocytes (↑). (2) PTZ treated rat: an apparent increase in astrocytes (↑) size with longer cytoplasmic processes, number and GFAP immunoreactivity compared to control rats. (3) PTZ-LTG treated rat: an apparent decrease in the number of GFAP immunoreactive astrocytes (↑) compared to PTZ group. (4) LTG treated rat: few GFAP immunoreactive astrocytes (↑).
|
Table 2
Effect of lamotrigine on number of immune reactive cells by Caspase and Glial fibrillary acidic protein (GFAP) in normal and PTZ-treated rats
Data are expressed as mean±SD, number of animals (n)=7, PTZ (pentylenetetrazole, 30 mg/kg); LTG (lamotrigine, 20 mg/kg); GFAP, glial fibrillary acidic protein. *p<0.05 compared to control group, †p<0.05 compared to PTZ group by analysis of variance (ANOVA), followed by Newman-Keuls multiple comparison test.
![]()
PTZ-LTG treated rats showed an apparent increase number of pyramidal cells and their content of Nissl granules in CA3 area of the hippocampus (Fig. 7A3, B3) compared to PTZ treated group. Moreover, there was a significant (p<0.05) decrease in number of positive brownish caspase-3 immuno- reaction in pyramidal cells and immune GFAP reactive astrocytes (Fig. 7C3, D3) compared to PTZ treated group. LTG alone treated rats showed a picture (Fig. 7A4, B4, C4, and D4) more or less similar to control rats.
2. Aortas and coronaries histopathological changes
Clumps of cells with darkly stained nuclei attached to the endothelium of tunica intima which were apparently irregular were observed in aortas of PTZ treated rats compared to control group (Fig. 8A1). Few of the smooth muscle cells of tunica media showed foamy acidophilic cytoplasm with karyolitic nucleus or clearly vacuolated cytoplasm with peripheral flat pyknotic nucleus (Fig. 8A2). PTZ-LTG treated rats aortas had apparently regular tunica intima lined with darkly stained nuclei. Most of the smooth muscle cells showed acidophilic cytoplasm with rod shaped nuclei, others showed foamy acidophilic cytoplasm and few numbers showed vacuolated cytoplasm with deeply stained nucleus (Fig. 8A3). LTG treated rats aortas showed a picture more or less similar to control rats (Fig. 8A4).
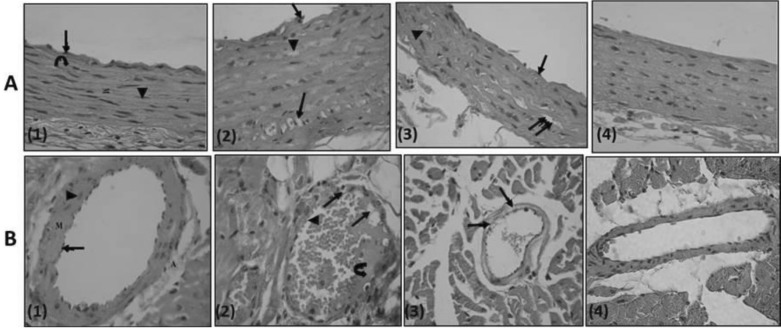 | Fig. 8(row A, B): Row A, A photomicrograph of a transverse section in a rat thoracic aorta (H&E, ×540); (1) Control rat: the tunica intima lined with endothelial cells (↑), tunica media (M) is relatively thick and formed mainly of wavy acidophilic elastic laminae (  ) and smooth muscle cells (▲). Notice tunica adventitia is thin. (2) PTZ treated rat: clumps of cells with darkly stained nuclei (↑) attached to the endothelium of tunica intima which is apparently irregular. Few of the smooth muscle cells of tunica media show foamy acidophilic cytoplasm with karyolitic nucleus (▲) or clearly vacuolated cytoplasm with peripheral flat pyknotic nucleus (↑↑). (3) PTZ-LTG treated rat: apparently regular tunica intima (↑). Most of the smooth muscle cells are nearly similar to control group, others show foamy acidophilic cytoplasm (↑↑) and few number shows vacuolated cytoplasm with deeply stained nucleus (▲). (4) LTG treated rat: tunicae of the aorta are nearly similar to the control group. Row B, A photomicrograph of a section a coronary artery of the heart (H&E, ×540); (1) Control rat: an intact endothelial lining (↑). The tunica media (M) is formed of smooth muscle fibres with rod shaped vesicular nuclei (▲). The adventitia (A) is formed of loose connective tissue. (2) PTZ treated rat: multiple vacuoles in the tunica intima and tunica media (↑). Notice adherence of blood elements to the endothelium (▲). Exudates are also seen (). (3) PTZ-LTG treated rat: few vacuolated cells are seen in tunica media (↑). (4) LTG treated rat: nearly intact tunicae. ) and smooth muscle cells (▲). Notice tunica adventitia is thin. (2) PTZ treated rat: clumps of cells with darkly stained nuclei (↑) attached to the endothelium of tunica intima which is apparently irregular. Few of the smooth muscle cells of tunica media show foamy acidophilic cytoplasm with karyolitic nucleus (▲) or clearly vacuolated cytoplasm with peripheral flat pyknotic nucleus (↑↑). (3) PTZ-LTG treated rat: apparently regular tunica intima (↑). Most of the smooth muscle cells are nearly similar to control group, others show foamy acidophilic cytoplasm (↑↑) and few number shows vacuolated cytoplasm with deeply stained nucleus (▲). (4) LTG treated rat: tunicae of the aorta are nearly similar to the control group. Row B, A photomicrograph of a section a coronary artery of the heart (H&E, ×540); (1) Control rat: an intact endothelial lining (↑). The tunica media (M) is formed of smooth muscle fibres with rod shaped vesicular nuclei (▲). The adventitia (A) is formed of loose connective tissue. (2) PTZ treated rat: multiple vacuoles in the tunica intima and tunica media (↑). Notice adherence of blood elements to the endothelium (▲). Exudates are also seen (). (3) PTZ-LTG treated rat: few vacuolated cells are seen in tunica media (↑). (4) LTG treated rat: nearly intact tunicae.
|
A section of the heart from PTZ treated rats showed multiple vacuoles in the tunica intima and tunica media of the coronary artery with adherence of blood elements to the endothelium, exudates were also seen (Fig. 8B2). PTZ/LTG treated rats showed a coronary artery with few vacuolated cells in tunica media (Fig. 8B3). Meanwhile, LTG treated rats showed a coronary artery with nearly intact tunicae (Fig. 8B4).
Go to :
DISCUSSION
Epilepsy is one of the major neurological disorders still awaiting safer drugs with improved antiepileptic effect and lesser side effects. Therefore, there is a need to develop AEDs with multiple actions and no/minimal side effect on cardiovascular function [1]. In the present study, sub-convulsive dose of PTZ (30 mg/kg) when given intraperitoneally on alternate days for 5 weeks induced kindling seizure in rats. LTG showed significant protection against seizures. LTG significantly increased the latencies to generalized tonic clonic seizures (GTCS) and decreased the seizure score and lowered the average Racine score compared to PTZ treated rats. As reported previously, LTG prevented seizures in the iron-induced experimental model of epileptogenesis [24] and electroshock induced seizures [25].
Histopathological studies of the hippocampus revealed that epileptogenesis induced by PTZ caused an apparent decrease in the number of the normal pyramidal cells with decrease in its Nissel granules content compared to control group. Along with the presence apoptotic cells as demonstrated by significant increase in number of immune reactive astrocytes with caspase 3 and GFAP when compared to control group, these were in consistence with Gaurav et al. [26]. Their results showed that epileptogenesis is accompanied with decreased CA3c pyramidal cell numbers. LTG administration in the present study showed a decrease in hippocampal damage through an apparent increase in the Nissl granules content of the pyramidal cells and a significant decrease in immune reactive astrocytes with caspase 3 and GFAP in PTZ-LTG treated group when compared to PTZ treated group.
Dyslipidemia has long been known to be an important risk factor for atherosclerosis [27]. The present study showed that epileptogenesis induced by PTZ caused a significant increase in total cholesterol, triglycerides and atherogenic cholesterol (LDL), decrease in HDL and subsequent increase in atherogenic index. LTG administration to epileptic rats in the present study showed a significant decrease in total cholesterol, triglycerides, atherogenic cholesterol (LDL) and atherogenic index with increase in HDL (protective lipoprotein) compared to PTZ group.
Mintzer and colleagues [28] evaluated the effect of switching from the enzyme-inducers, carbamazepine and phenytoin, to the non-enzyme-inducers, LTG. They observed that total cholesterol, atherogenic non-high-density cholesterol and triglycerides, were all lowered suggests that reversal of enzyme induction is the mechanism underlying this improvement. Chuang et al. [13] on the other hand reported that no significant alterations in lipid profile were observed in patients who received long-term LTG monotherapy in comparison to carbamazepine, and phenytoin.
The present study demonstrated that PTZ administration caused a significant increase in serum tHcy in comparison to control rats. Unlüçerçi and colleagues [29] previously reported increase of serum total Hcy levels in epilepsy. In addition, the present study reported a significant correlation between tHyc; LDL-cholesterol, TG, both serum and aortic MDA and GSH. These results indicate that tHcy may increase risk of vascular diseases and increase oxidative stress in PTZ-induced epilepsy in rats. In the present study, LTG did not elevate serum tHcy levels in the epileptic group and this may be an advantageous effect in comparison to the other antiepileptic drugs as previously reported [13,28]. The underlying mechanism for homocysteine increase seems to be a decrease of cofactor molecules in patients using carbamazepine and phenytoin (pyridoxal 5'-phosphate and folic acid, respectively) [30]. Gidal and colleagues [31] demonstrated that 32-week administration LTG had no significant effect on plasma tHcy, plasma red-cell folate and Vitamin B12.
Experimental seizures are known to be associated with a massive release of reactive oxygen species [32]. Indeed an increase in lipid peroxidation has been reported in the hippocampus and cerebral cortex of rodents following PTZ-induced seizures and kindling [33]. In the current work, PTZ kindling increased the level of MDA and decreased the GSH level in the rat aorta and serum. PTZ thus caused an imbalance between antioxidant and oxidant defense system which may be at least partially responsible for seizures and vascular risks. Co-administration of LTG attenuated the rise in serum and tissue MDA levels. The significant decrease in tissue MDA levels with concomitant LTG administration as compared to PTZ alone treated rats indicates an attenuation of lipid peroxidation.
This could be explained by the additive action of LTG on inhibition of glutamate-mediated excitotoxicity, which would lead to less production of free radicals [34]. LTG-PTZ treated group also showed no significant decrease in GSH activity as compared to the PTZ treated group of rats. In assessment of the effect of lamotrigine on cognitive function and oxidative stress during pentylenetetrazole (PTZ)-kindling in mice, Agarwal et al. [6] reported that LTG did not show significant alteration in oxidative stress parameters indicating that this drug does not cause induction of oxidative stress. In addition, Pavone and Cardile [35] reported anti-oxidative potential of LTG in rats.
Current work revealed that aortic rings isolated from epileptic rats showed enhanced contractility toward PE with a significant increase in E-max and decrease in EC50 with impaired relaxation by Ach which denotes endothelial dysfunction. Administration of LTG in epileptic rats showed reduction in the PE-induced contraction with improvements of the endothelium-dependent relaxation. That could be explained by the reducing effects of LTG on MDA levels and aortic GSH, moreover its significant decrease of serum cholesterol, triglyceride levels and LDL-cholesterol levels.
Histopathological studies in thoracic aorta and coronary arteries showed apparently irregular tunica media of endothelium of thoracic aorta with multiple vacuoles in the tunica intima and tunica media of the coronary arteries and adherence of blood elements to the endothelium of coronary artery in PTZ treated rats by H&E when compared to control group. LTG administration to PTZ-LTG treated rats resulted in apparently regular tunica intima of thoracic aorta and few vacuolated cells in tunica media of coronary arteries.
Many studies reported a favorable effect of LTG on vascular dysfunction; Seçkin et al. [36] demonstrated that oral administration of LTG has marked neuro-protective effect and significantly attenuate cerebral vasospasm after subarachnoid hemorrhage. This was explained by the ability of LTG an antiepileptic drug with multi-ion channel inhibition properties to prevent cerebral vasospasm and subsequent neural ischemia in a rabbit model of subarachnoid hemorrhage.
The present study demonstrates that LTG was effective in attenuating PTZ induced kindling seizures. It improved endothelial dysfunction, dyslipidemia and decreased MDA level. Histopathological examination revealed that LTG had a neuro and vascular protective effects as indicated by decreased neurodegeneration and atherosclerosis of aortas and coronaries.
Conclusion
LTG decreased seizures severity, hippocampal damage and improved vascular risk markers in rat model of pentylenetetrazole induced kindling seizure.
Further studies are needed to explain and clarify other mechanisms of the neuroprotective and vasculoprotective effect of LTG.
Go to :
 XML Download