

 PDF
PDF ePub
ePub Citation
 Print
Print


INTRODUCTION
Hypoxic pulmonary vasoconstriction (HPV) is an acute physiological response of pulmonary arteries (PAs) to poorly ventilated alveolar regions, thereby prevents arterial hypoxemia by optimizing ventilation-perfusion ratio in lungs. As for the underlying cellular mechanisms for HPV, numerous evidences support that O2-sensitive ion channels play critical roles. For example, hypoxic inhibition of voltage-gated K+ channels (Kv) in pulmonary arterial smooth muscle cells (PASMCs) has been regarded as a main mechanism by inducing membrane depolarization that subsequently activates L-type voltage-operated Ca2+ channels (VOCCL) [1-4]. In addition, our recent study in rat PA showed that a partial stimulation of thromboxane A2 (TXA2) receptor is required to effectively induce HPV [5]. U46619, a stable analogue of TXA2, is commonly used as a vasoactive agent for studying HPV in isolated PAs. Electrophysiological investigation of rat PASMCs using whole-cell patch clamp technique demonstrated not only the hypoxic inhibition of Kv current (IKv) but also the activation of nonselective cation channel current (INSC) by combined application of U46619 and hypoxia [5]. According to our previous report, both IKv inhibition and INSC activation are required to induce sufficient depolarization of PASMCs, activating VOCCL and Ca2+ influx for contraction.
When animals are exposed to chronic hypoxia (CH), PAs undergo structural changes such as thickening in the medium. It has been reported that CH induces abnormal proliferation of pulmonary artery smooth muscle cells (PASMCs), which is the cause of PA remodeling [6]. In addition to the structural changes, it has been reported that CH (for several weeks) markedly attenuates HPV in mammals including humans [7-9]. Interestingly, the functional changes, i.e. loss of HPV, seemed to occur at relatively early period of CH; two reports described that HPV was also weakened in rats those underwent 3 days of hypoxia [8,10]. These results suggest that the weakened oxygen sensitivity of PASMC might occur prior to PA remodeling.
According to previous studies of PASMCs from the long term hypoxia animals (CH; 3 weeks, PO2 10%), the hypoxic inhibition of IKv was largely abolished, and the dysfunctional O2-sensitivity of Kv was suggested to underlie the attenuated HPV responses [9,11]. However, no previous study has investigated the electrophysiological changes of PASMCs from the animals exposed to the relatively short period of hypoxia (<3 days). Based on these backgrounds, here we investigate the changes of HPV and of the ion channel currents (IKv and INSC) in PASMCs from the rats exposed to two days of hypoxia (2d-H). Our present study demonstrates, for the first time, that the INSC induced by U46619 and hypoxia disappear at 2d-H while the hypoxic inhibition of IKv is unchanged.
Go to : 
METHODS
Animal model for 2d-H
All experimental procedures were performed with approval of the Institutional Animal Care and Use Committee (IACUC) in Seoul National University (IACUC approval no.: SNU 111129-1). Sprague-Dawley rats (230~260 g, male) were exposed to normobaric hypoxia chamber equipped with O2 sensor and automatic gas controller (ProOx Model 110, Biopspherix., USA). The hypoxia chamber could contain two regular rat cages. PO2 was adjusted by hypoxia by gas controller regulating the supply of 100% N2 gas to the hypoxic chamber. Because the hypoxic chamber was semi-sealed, CO2 absorbent (Sodasorb®, W.R. Grace, USA, chemical components; calcium hydroxide 95%, potassium hydroxide 2.5% and sodium hydroxide 2.5%) was used to prevent hypercapnia. PO2 was initially set to 12% during the first day, then further lowered to 8% during the second day (average of exposed PO2, 10%).
Measurement of pulmonary arterial pressure (PAP) and HPV
PAP and its increase in response to acute hypoxia (ΔPAPHypox) were measured in artificially ventilated and perfused lungs (V/P lungs). Rats were anesthetized with pentobarbital sodium (70 mg/kg, i.p. injection). To confirm appropriate anesthesia, reflexive eye blinking and loss of toe pinch were checked before experiment. After tracheostomy, rats were ventilated with a normoxic gas mixture (21% O2, 5% CO2 and 74% N2) via a rodent ventilator (respirator 645, Harvard Apparatus, USA). Tidal volume (10 ml/kg) and ventilation (85 breaths/min) were consistently maintained. A median sternotomy was performed, and heparin (200 U/kg) was injected to protect blood coagulation. Then, a cannula was inserted into main pulmonary artery and the suture was tightened. To allow constant blood flow perfusion, another cannula was inserted into left atrium via the left ventriculotomy. The perfusate mixed with blood (20 ml of whole blood and 30 ml physiological salt solution, PSS) was recirculated (15 ml/min) via a peristaltic pump (Servo amplifier 2990, Harvard Apparatus, USA). The mean pulmonary arterial pressure (PAP) were measured continuously using pressure transducer (Abbott pressure transducer, Abbott Lab, USA) and the data acquisition and storage was done with Powerlab/4ST and Chart5 (AD Instruments, Australia). After stabilization of PAP, a normoxic and hypoxic gas mixture (3% O2, 5% CO2, and 92% N2) were applied in five minute turns. Angiotension II (Ang II, 1 µg) was included in the perfusate and the temperature of the perfusate was maintained at 37℃.
Histology
Lungs were perfused with phosphate salt solution (PBS) and fixed by 4% paraformaldehyde for 24 hours, and then embedded in paraffin wax. For histological analysis, lung sections (5 µm) were cut and stained with hematoxylin and eosin (H&E). Stained lung tissues were analyzed by computerized image analysis system (Olympus BX51, Adobe Photoshop 7.0 software) at ×200 magnification.
Preparations of isolated PASMCs
The second and third branches of PAs (inner diameter 200~300 µm) were dissected under a binocular microscope. The dissected vessels were initially incubated in the first digestion medium [Ca2+-free normal Tyrode's (NT) solution including papain 1 mg/ml, bovine serum albumin (BSA) 1.5 mg/ml and dithiothreitol (DTT) 1.5 mg/ml)] for 20 minutes, then moved to the second digestion medium (Ca2+-free NT solution including collagenase 2.5 mg/ml, BSA 1.5 mg/ml and DTT 1.5 mg/ml) and further incubated for 20 minutes at 37℃. The digested PAs were rinsed with a Ca2+-free NT solution and gently agitated using a Pasteur glass pipette. Cells were stored in Kraft-Brühe (KB) storage solution at 4℃ until they are used for experiments in the same day.
Measurement of membrane currents in Patch-clamp experiments
Isolated cells were transferred to a bath chamber (approximately 0.2 ml) on the stage of an inverted microscope (IMT-2, Olympus, Osaka, Japan). In continuous perfusion with NT solutions (10 ml/min), whole cell and nystatin perforated patch clamp experiments were performed with patch-clamp amplifier (Axopatch-1D, Axon Instruments, Forster City, CA, USA) at room temperature. Digidata-1440A interface (Axon Instruments) and pCLAMP software v.10.0 were utilized for data acquisition. Patch pipettes (3.5 MOhm) were used for whole cell current recording and signals were filtered at 5 kHz.
Hypoxic condition (~3% O2) of bath solution was obtained by bubbling with 100% N2 gas bath solutions and PO2 was checked by a micro oxygen electrode (MI-730, Microelectrodes. Inc., Bedford, NH, USA) located in the perfused bath.
Solutions and drugs
Physiological salt solution (PSS) for V/P lungs contained the following (in mM): NaCl 131, KCl 4.7, MgSO4 1.17, NaHCO3 22.61, KH2PO4 1.18, Glucose 10, CaCl2 3.2, sodium meclofenamate 0.0050 g/l, bovine serum albumin (BSA) 30.0 g/l. The NT solution contained the following (in mM): NaCl 140, KCl 5.4, 4-(2-hydroxyethyl)-1-piperazineethane-sulfonic acid (HEPES) 10, NaH2PO4 0.33, Glucose 10, CaCl2 1.8 and MgCl2 1 (adjusted with NaOH to pH 7.4). In Patch clamp experiments for recording NSC current, bath solution consisted of following compositions (in mM): NaCl 140, CsCl 4, HEPES 10, Glucose 10, Sucrose 10, CaCl2 1.8 and MgCl2 0.5 (adjusted with NaOH to pH 7.4). The pipette solution for recording NSC current consisted of (in mM): ethylene glycol-bis(2-aminoethyl)-N,N,N',N'-tetraacetic acid (EGTA) 5, CsCl 140, HEPES 10, MgCl2 1 and Mg-ATP 3 (adjusted with CsOH to pH 7.2). To record Kv current using nystatin-perforated patch technique, bath solution contained the following (in mM): KCl 140, HEPES 10, EGTA 1, MgCl2 1 and 50 µg/ml nystatin (adjusted with KOH to pH 7.2), and the pipette solution consisted of (in mM): KCl 140, HEPES 10, EGTA 5, MgATP 3 and MgCl2 1 at pH 7.2 with KOH. Kraft-Brühe (KB) storage solution for cell suspensions contained with the following composition (in mM): KOH 70, L-glutamic acid 50, KCl 55, taurine 20, KH2PO4 20, glucose 20, HEPES 10, EGTA 0.5 and MgCl2 3 (pH 7.3 with KOH).
BSA was obtained from Calbiochem (Darmstadt, Germany) and other drugs were purchased from Sigma (St. Louis, MO, USA).
Statistical analysis
Data were expressed as original recordings and bar graphs of the mean±SEM. Statistical comparison was performed with unpaired Student's t-test or one-way analysis of variance (ANOVA) with Bonferroni post-hoc test, with p-value less than 0.05 and 0.01 (*p<0.05, **p<0.01) being considered significant.
Go to :
RESULTS
In the V/P-lung from control rats, hypoxic ventilation (3% PO2, 5 min) consistently increased PAP (ΔPAPHypox) implying HPV response (Fig. 1A, C, n=10). Interestingly, the HPV response was abolished in 2d-H rats, and did not recover by repeated application of hypoxia (Fig. 1B, C, n=10). In addition, the initial transient increase of PAP in response to Ang II application was decreased by 55% in 2d-H rats (Fig. 1E). It has to be noted that the basal PAP of 2d-H rat was increased slightly but significantly (Fig. 1D). Although not shown here, we also confirmed that HPV was completely abolished in the rats those have been exposed to hypoxia for 2 weeks and for 3 weeks (n=2; 2 weeks, n=4; 3 weeks). However, rats exposed to one day of hypoxia (12% PO2) for 1 day still showed HPV response (n=3, data not shown).
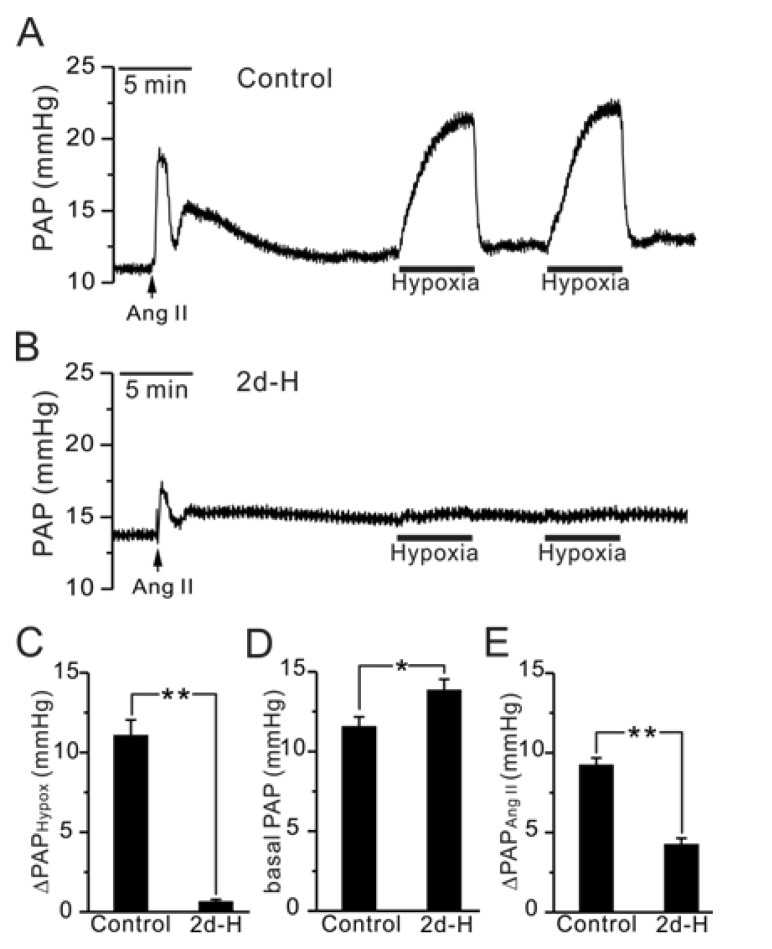 | Fig. 1Comparison of HPV, basal PAP and Ang II-induced ΔPAP between control and 2d-H rats in V/P lungs. (A, B) Representative traces of PAP recording in control (A) and 2d-H rats (B). Hypoxic ventilation (3% PO2)-induced PAP increase (ΔPAPHypox) was abolished in 2d-H. Ang II was initially applied to the perfusate, inducing a transient increase in PAP. (C~E) Summaries of ΔPAPHypoxia (C), basal PAP (D), and AngII-induced ΔPAP (E) are shown as bar graphs comparing the results between control and 2d-H rats (*p<0.05, **p<0.01).
|
Although the basal PAP was increased in 2d-H rats, right ventricular hypertrophy did not occur. Relative weights of right ventricle in comparison with left ventricle and septum (RV/(LV+S)) were analyzed, showing no difference between control and 2d-H rats (data not shown, n=10; control, n=5; 2d-H). In the histological analysis of 2d-H and control lungs, there was no noticeable medal thickening of PA (Fig. 2A, B). In contrast, typical hypertrophic change of PA (medial thickening) was generally observed in rats those have been exposed to hypoxia for 2 and 3 weeks (Fig. 2C, D).
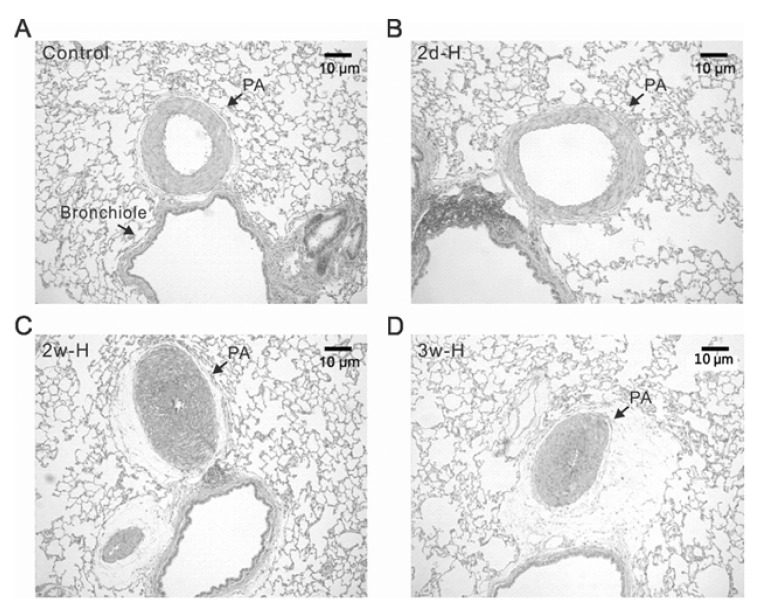 | Fig. 2Differential structural changes of PAs according to the period of hypoxia in rats. Representative histological figures (H&E staining) of lung from control (A), 2 days of hypoxia (2d-H, B), 2 weeks of hypoxia (2w-H, C), and 3 weeks of hypoxia (3w-H, D). The medial thickness of PA was similar between control and 2d-H, whereas the PAs from 2w-H and 3w-H showed marked hypertropic changes with almost obliterated lumen.
|
Previous studies have suggested that the inhibition of Kv channels by acute hypoxia (O2-sensitivity of Kv) is critical to generate HPV, and the hypoxic inhibition of Kv was not observed in the 2- or 3-week CH models [4,7,8]. If the loss of O2-sensitivity of Kv is also critical for the attenuation of HPV in our present study, we would expect that a pharmacological inhibition of Kv recovers HPV in 2d-H rats. Application of 4-aminopyridine (4-AP, 5 mM) increased basal PAP and augmented HPV response in control rats (Fig. 3A). Similarly, basal PAP was also increased by 4-AP in 2d-H rats. However, 4-AP did not restore the attenuated HPV (Fig. 3B). Summarized data are shown in Fig. 3C.
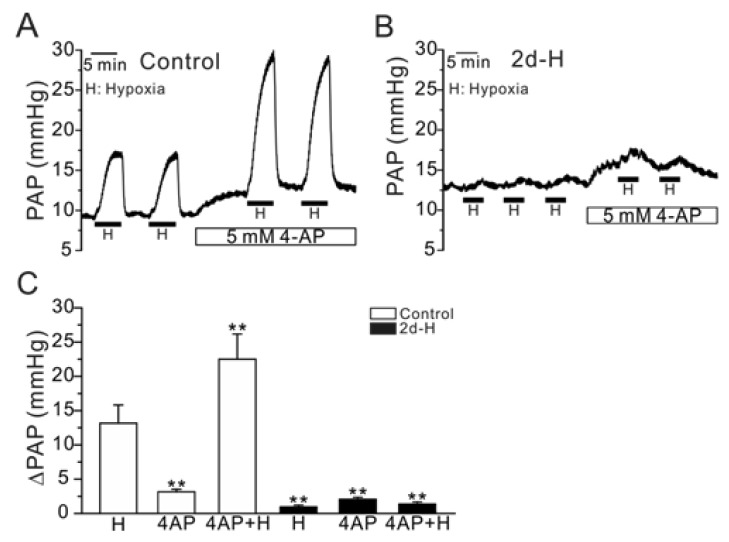 | Fig. 3Effect of 4-AP, a Kv inhibitor, on PAP and HPV (ΔPAPHypoxia) in control and 2d-H rats. (A, B) Representative traces of PAP recording in control and 2d-H rats. Both basal PAP and ΔPAPHypoxia were increased by 5 mM 4-AP in control (A). In 2d-H, however, basal PAP was slightly increased by 4-AP, and ΔPAPHypoxia was not recovered by the 4-AP pretreatment (B). (C) Summaries of the results shown as bar graphs (n=5; control, n=4; 2d-H, **p<0.01).
|
Next, we analyzed whether the hypoxic inhibition of IKv is affected in PASMCs from 2d-H rats. IKv currents were measured in PASMCs using nystatin-perforated whole-cell clamp technique. Application of acute hypoxia (3% PO2) significantly decreased the amplitudes of outward K+ currents (IKv) in the PASMCs from control and from in those from 2d-H rats (Fig. 4, n=5; control, n=4; 2d-H rats).
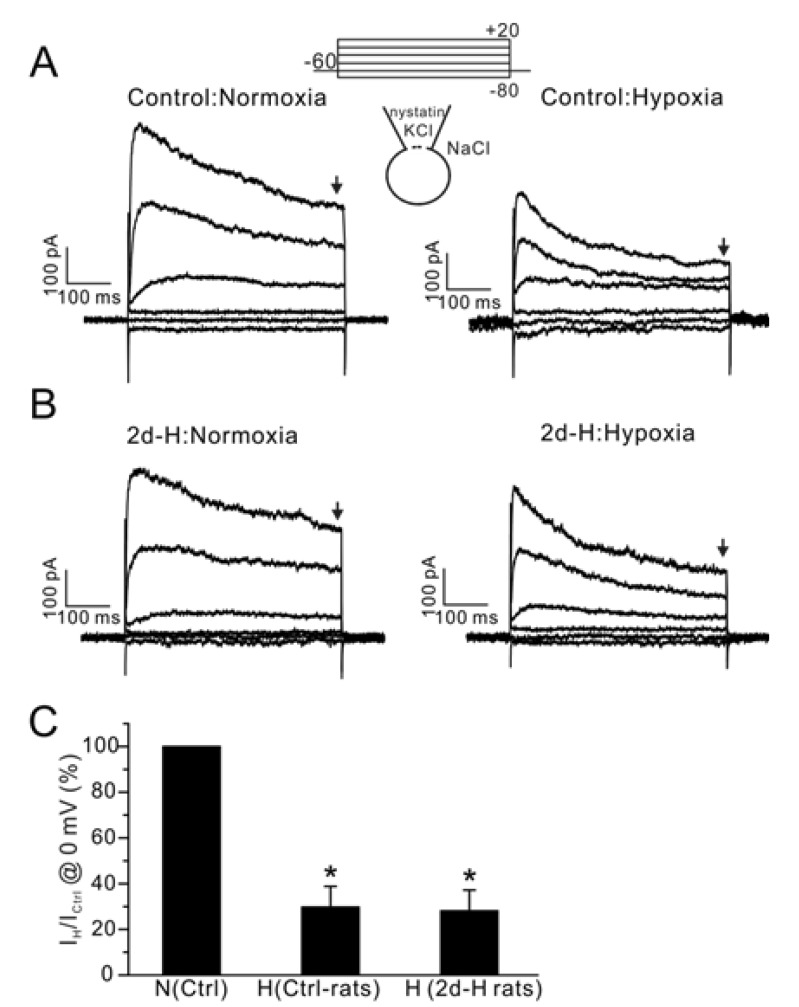 | Fig. 4Effect of acute hypoxia on IKv in PASMCs from control and 2d-H rats. (A, B) Representative current traces obtained by step pulses (between -80 mV and 20 mV, 20 mV interval, 500 ms duration,) from -60 mV of holding potential. The recording was done at 37℃. Acute hypoxia (PO2 3%) decreased the amplitudes of IKv in PASMCs similarly between control and 2d-H PASMCs. (C) Summary of outward current amplitudes at 0 mV normalized to each control (Ctrl-rats; control, H; hypoxia, *p<0.05). The amplitudes of outward currents were measured at the end of step pulses as indicated by downward arrows above (A, B).
|
We have shown previously that in addition to the hypoxic inhibition of IKv, INSC activation by U46619 and hypoxia is critical for inducing membrane depolarization in HPV [5]. Therefore, we assessed the INSC activation by combined application of U46619 and hypoxia in PASMCs. To record INSC selectively, Cs+-rich pipette solution was used to block the voltage-dependent K+ conductance. Application of 50 nM U46619 slightly increased INSC at -60 mV, which was significantly augmented by combined application of hypoxia with U46619. In contrast, U46619 and hypoxia did not increase INSC in PASMCs isolated from 2d-H rats (Fig 5A, B, n=6, respectively).
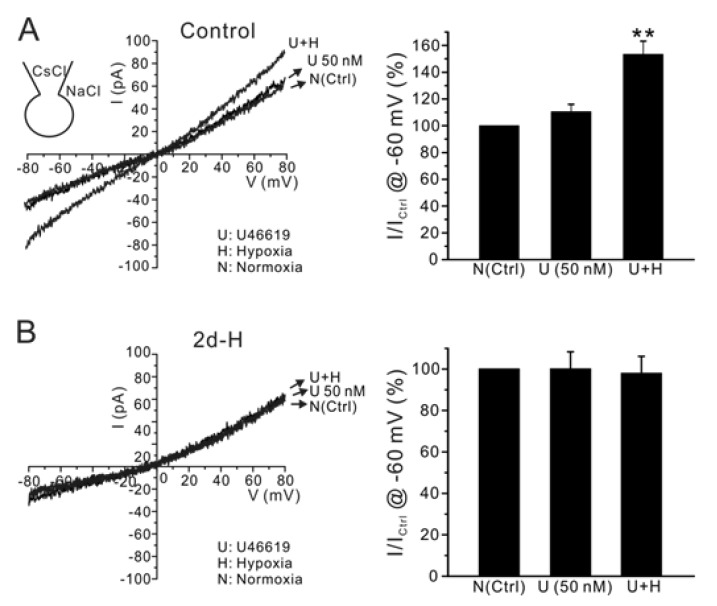 | Fig. 5Effect of acute hypoxia on INSC in PASMCs of control and 2d-H rats. Representative I/V curves of INSC were obtained by ramp pulses (-80 mV~80 mV) with CsCl pipette solution. (A) Application of U46619 alone did not significantly increased INSC, while the additional acute hypoxia significantly increased the conductance. (B) In contrast, INSC was not increased by acute hypoxia in 2d-H rats. Summaries of inward current amplitudes at -60 mV normalized to each control (U; U46619, H; hypoxia) are display as bar graphs in the right panels (**p<0.01).
|
Go to :
DISCUSSION
The present study demonstrates that HPV was almost disappeared in rats exposed to hypoxic condition only for two days. The loss of HPV at 2d-H was observed without structural and morphological changes and was not recovered by Kv inhibitors in V/P lungs. Since previous studies supported that an abnormal proliferation of PASMCs accompanied by electrophysiological changes resulted in vascular remodeling under prolonged hypoxic conditions, the period over two weeks was mostly used for exposure time of hypoxia. [6-8,12,13]. The loss of HPV in CH (>two weeks) rats has been consistently observed by many researchers [6-8,14], however, the attenuated HPV from animals exposed relatively short period has been described in only two studies without elucidating the underlying mechanism [8,10].
In the present study, we clearly demonstrate disappearance of HPV at 2d-H prior to inducing noticeable morphological changes. Considering that PA was severely thickened after 2 weeks of hypoxia (Fig. 2C), the regional blood flow in PAs would be obliterated by only a little further contraction. Even if there was no hypertrophic changes in PAs, persistent and general HPV with ambient hypoxia would induce excessive increase of afterload which may lead to the failure in right ventricle [15]. Consequently, the loss of HPV might be regarded as a survival mechanism allowing sufficient alveolar perfusion under the chronic hypoxic environments (e.g. high altitude conditions).
Hypoxic inhibition of IKv in PASMCs is well established to be the mechanism of HPV [2,3,11]. However, the Kv inhibition would not be the sole mechanism for HPV. Otherwise, pharmacological inhibition of Kv would have totally mimicked HPV. However, even larger HPV (ΔPAPHypox) was observed with 4-AP pretreatment in the V/P lungs from control rats (Fig. 3A, C). In addition, application of 4-AP did not reverse the loss of HPV in 2d-H rats (Fig. 3B, C). Furthermore, in PASMCs from both control and 2d-H rats, the hypoxic inhibition of IKv was similar (Fig. 4). These result suggest that apart from Kv inhibition, there may be another depolarizing mechanism underlying the impaired HPV.
Our previous studies demonstrated that thromboxane A2 was required to initiate HPV in isometric tension measurement of isolated PAs and precision-cut lung slice from rats [5,16]. As for the underlying mechanism of the necessity of TXA2, we suggested the hypoxic augmentation of INSC,TXA2 along with the Kv inhibition. The most intriguing finding in this study was disappearance of O2-sensitive INSC in PASMCs from 2d-H rats. The functional downregulation of INSC might explain the early loss of HPV in 2d-H rats. Further investigation is required to elucidate the signaling mechanisms for the above phenomenon. The molecular nature of INSC,TXA2 was suggested as TRPV2 according to our previous study [5]. However, other researchers have claimed that TRPC6 channels play critical roles in HPV and idiopathic pulmonary hypertension [17-20]. In this respect, it would be an interesting direction to pursue the specific types of TRP channel family that is downregulated by chronic hypoxia.
For studying HPV in CH rats, several weeks of continuous or intermittent hypoxia have been conventionally applied in most of the previous researches [7-9,14,21 in CH animal would cause right ventricular hypertrophy and right heart failure [22], which would have clinical implication in chronic obstructive pulmonary disease, sleep apnea and high altitude sickness [6,22-25]. Although no significant medial thickening of PA and right ventricular hypertrophy were observed in 2d-H rats of the present study, slight increase of basal PAP was observed (Fig. 1D). Such results suggested that intrinsic tone of PA was actually increased or unidentified endogenous vasoactive substance might be produced in the lung parenchyme of 2d-H rats. Such an early increase in PA tone would inevitably increase the afterload to right heart, inducing right ventricular hypertrophy in the long term. Mechanisms for the early increase in PA resistance remain to be elucidated.
Go to :
 XML Download