

 PDF
PDF ePub
ePub Citation
 Print
Print


INTRODUCTION
Osteoporosis is a common disorder that is characterized by low bone mineral density and compromised bone strength, which predisposes the patient to increased fracture risk [1]. In normal bone remodeling or bone turnover, osteoblastic bone formation and osteoclastic bone resorption is coupled in a precise and orchestrated manner. The management of osteoporosis is among the greatest challenges faced by modern medicine. Traditional therapeutic agents for osteoporosis have been estrogen, calcitonin and bisphosphonates which inhibit bone resorption. These drugs seem to be the most effective method to reduce the rate of postmenopausal bone loss, but may be accompanied by bothersome side-effects such as breast cancer, venous thromboembolism, rhinitis, esophageal ulcer [2,3]. Recently, attempts have been made to use combination of anti-resorptive agents and bone formation-stimulating agents [4]. However, the bone-forming agents available have serious adverse effects, or may not improve bone quality, or may not reduce the susceptibility to fracture. Therefore, there are increasing needs for more safe therapeutic agents with comparable efficacy to commercially available drugs for disorders of bone remodeling.
Machilus thunbergii has been used as a traditional Chinese medicine for more than thousand years. In humans and animals, M. thunbergii and its active ingredients show some beneficial effects including neuroprotective activity [5], enhancing osteoblast differentiation [6], and inducing apoptosis [7]. However, none has been conducted to examine the osteoblastic effect of nectandrin A, one of active ingredients found in M. thunbergii. As part of search for biologically active anti-osteoporotic agents that enhance differentiation and mineralization of osteoblastic cells, nectandrin A was found to be one of the active chemical entities. This effect was mediated by p38 mitogen-activated protein kinase (MAPK) and Smad signaling pathways.
Go to : 
METHODS
Materials
Nectandrin A isolated from M. thunbergii was kindly provided by Prof. Baek (Yongin, Kyung Hee University) and dissolved in 0.1% DMSO. Recombinant human BMP-2 (rhBMP-2) was purchased from R&D System (Minneapolis, MN, USA). Antibodies against phospho-Smad1/5/8, Flag, phospho-p38, phospho-Smad and phospho-ATF2 were from Cell Signaling Technology (Beverly, MA, USA) and anti-actin was from Santa Cruz Biotechnology (Santa Cruz, CA, USA). Reverse transcriptase, Cell Proliferation Assay kits and Dual-Luciferase Reporter Assay System were supplied by Promega (Madison, WI, USA). Maxima SYBR Green qPCR Master Mix was from Fermentase Inc. (Burlington, Ontario, Canada), and SB203580 was purchased from Calbiochem (San Diego, CA, USA). Protein extraction kit, EASY-BLUE total RNA extraction kit, enhanced chemiluminescence (ECL) and Lipofectamine 2000 transfection reagents were from Intron Biotechnology Inc. (Beverly, MA, USA), and protein assay kit was from Bio-Rad (Hercules, CA, USA). The other reagents and chemicals were of analytical grade commercially available.
Cell culture and viability assay
C2C12 cells were maintained in Dulbecco's modified Eagle's medium (DMEM) containing 10% fetal bovine serum (FBS), 100 units/ml of penicillin and 100 mg/ml streptomycin (GibcoBL, Grand Island, NY, USA) in a humidified atmosphere of 5% CO2 at 37℃. The cytotoxicity of nectandrin A was determined by a CellTiter 96 AQueous One solution Cell Proliferation Assay kit. In brief, cells were seeded at 3×10⁴ cells/well in a 96-well plate and treated with nectandrin A as indicated concentrations. After 3 day treatment, 20 µl of 3-(4,5-dimethylthiazol-2-yl)-5-(3-carboxymethoxyphenyl)-2-(4-sulfophenyl)-2H-tetrazolium (MTS) solution was added and incubated at 37℃ for 30 min, and the absorbance was recorded at 490 nm using ELISA plate reader (Thermo LabSystem, Helsinki, Finland).
Alkaline phosphatase (ALP) enzyme assay
ALP activity was measured as follows: C2C12 cells were seeded at 1×10⁵ cells/well in a 6-well plate and incubated for 24 h. Medium was then replaced with treatment medium containing DMEM supplemented with 5% FBS plus 100 ng/ml rhBMP-2 and/or nectandrin A at indicated concentrations. After 7 days, ALP activity within the cell lysates was measured using an ALP assay kit (SensoLyte, San Jose, CA, USA). Protein concentration was measured using a Bio-Rad protein assay kit.
Measurements of mineralization and calcium content
The extent of mineralization of the extracellular matrix was measured semi-quantitatively using Alizarin Red staining, according to the previously reported protocols [8]. Briefly, C2C12 cells were treated with the same medium as described above for ALP enzyme assay, plus 35 mg/ml ascorbic acid and 10 mM β-glycerophosphate. After 14 days of culture, cells were washed, fixed in 95% ethanol, and then stained with Alizarin Red 1% solution in 0.28% ammonia followed by gentle agitation for 10 min. After imaging, cells were solubilized with 10% (w/v) ethylpyridinium chloride for 20 min and the extracted stain was measured by spectrophotometer with an absorbance at 570 nm. To quantify the amount of calcium present in the cultures Arsenazo III (40 mM in dH2O) was used. Arsenazo III is a purple substrate, which reacts with calcium at a neutral pH to form a blue colored complex. The cells were washed with PBS and then incubated overnight in lysis buffer (Tris pH 7.2, 150 mM NaCl, 1% Triton-X, 0.1% sodium dodecyl sulfate, 1 mM phenylmethylsulfonyl fluoride, 10 mM benzamidine, and 2 µg/ml leupeptin). The resulting cell lysate was used to quantify both calcium and protein concentrations in the sample. To quantify calcium, 100 µl Arsenazo III was added to 50 µl lysate and absorbance was measured at 650 nm using the spectrometer microplate reader (Thermo Labsystems, Helsinki, Finland). Measurements were carried out in triplicate. A calcium standard was run alongside the samples to calculate the amount of calcium in the samples.
Western blot
To detect proteins in whole cell lysates, cells were washed with ice-cold PBS and lysed using a protein extraction kit. Insoluble protein was removed by centrifugation at 13,000 rpm for 20 min. The protein concentration of the cell lysates was measured using a Bio-Rad protein assay kit. For Western blot analysis, equal amounts of protein (40 µg/lane) were resolved by 8% SDS-PAGE and transferred to polyvinylidene difluoride membranes (Millipore, Massachusetts, MA, USA). Levels of pSmad1/5/8, pp38, pATF2, Flag and actin were detected with a 1:1,000 dilution of each antibody in a non-fat dry milk solution (Tris-buffered saline with 5% non-fat dry milk and 0.1% Tween 20), followed by incubation with a horseradish peroxidase-conjugated secondary antibody (diluted 1:2,000) for 2 h at room temperature. Protein bands were detected using an ECL Western blot detection kit.
RNA extraction and real-time PCR
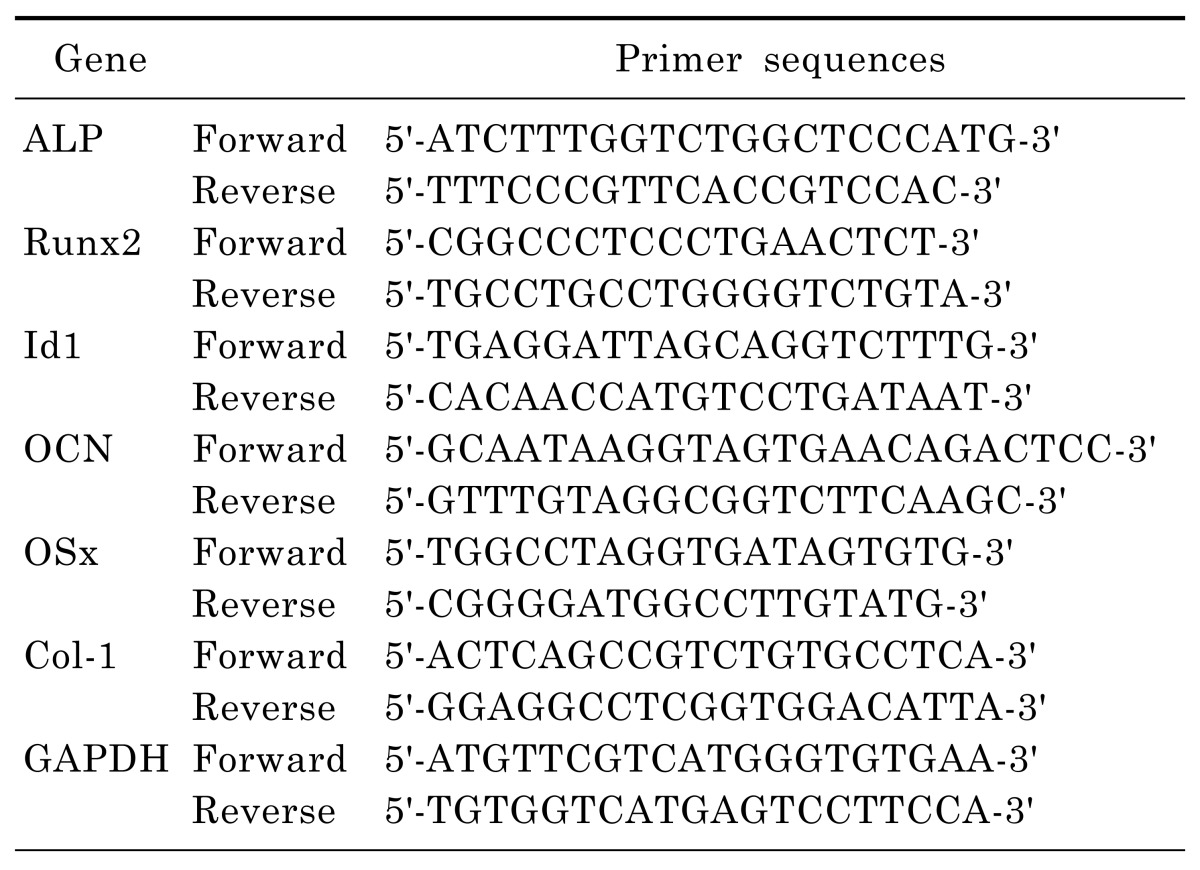
Total RNA was isolated from C2C12 using an EASYBLUE total RNA extraction kit and then reverse transcribed into cDNA. Single-strand cDNA synthesis was performed using 5 µg of RNA, oligo (15) dT primers and reverse transcriptase in a reaction volume of 50 µl. Real-time PCR was performed using SYBR Green PCR master mix and the LightCycler real-time PCR System (Roche Applied Science, Indianapolis, IN, USA) according to the manufacturer's instruction. A relative gene expression quantification method was used to calculate the fold change of mRNA expression according to the comparative threshold cycle method using house-keeping genes as an endogeneous control. The primers and annealing temperatures employed are shown in Table 1.
Transient transfection and luciferase reporter assay
For Id1 (inhibitor of DNA binding/differentiation 1) reporter gene assay, C2C12 cells were transfected with 1d1-Luc reporter plasmid (Addgene, Cambridge, MA, USA) and R-Luc plasmid using a Lipofectamine 2000 transfection reagent. To confirm correlation between Smad4 and Id1, C2C12 cells were transfected with pCMV-Smad4 and R-Luc plasmid, and then incubated with DMEM containing 5% FBS and 1% penicillin/stpreptomycin. After 3 days, these cells were transfected with Id1-Luc and R-Luc reporter. After 1 day, medium was replaced with DMEM containing 5% FBS with or without nectandrin A. After 24 h, the transfected cells were lysed and luciferase activity was measured using the luciferase reporter assay system and the Wallac EnVision microplate reader.
Statistical analysis
All data are expressed as the mean±standard error (SE). Comparisons between groups were made using ANOVA, and the significance was determined by Tukey's Test. Differences at p<0.05 were considered to be statistically significant.
Go to :
RESULTS
Nectandrin A enhances the BMP-2 induced osteoblastic differentiation and mineralization
We first examined the effect of nectandrin A on viability and proliferation of C2C12 cells using the MTS assay. Treatment with nectandrin A in C2C12 cells for 3 day did not evoke any changes in cell viability and proliferation, indicating that selected concentrations for the study did not damage integrity and proliferative machinery of cells during the period of incubation (Fig. 1A). The effect of nectandrin A on commitment of mesenchymal stem cells (C2C12 cells) into osteoblasts was evaluated by measuring ALP activity and mineralization (determined by staining/destaining with Alizarin Red) in differentiated C2C12 cells. At non-cytotoxic concentration (≤20 µM), the ALP activity (a marker of early-stage osteoblastic differentiation) reached a maximum level at day 7 and then declined, whereas calcium contents were gradually increased until day 14 (Fig. 1C and D). Nectandrin A of 20 µM markedly increased ALP activity and mineralization by 3.5-fold and 2.5-fold, respectively, when compared to those in the rhBMP-2 treatment group (Fig. 1B). To examine the molecular mechanism of nectandrin A underlying the promotion of mineralization, we investigated the changes of osteogenic genes after treatment of rhBMP-2 and nectandrin A. BMP-2-induced expressions of ALP, osteocalcin (OCN) and type I collagen (Col-I) were increased by nectandrin A treatment (Fig. 2C, D and F). In addition, the expression levels of transcription factors involved in osteoblastic differentiation such as Id1, osterix (Osx) and Runx2 were also increased by nectandrin A in the presence of rhBMP-2 (Fig. 2A, B and E).
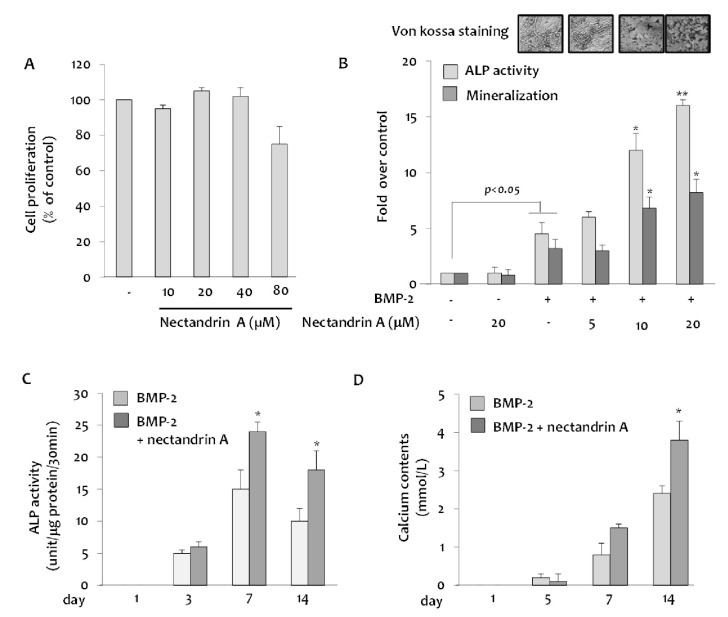 | Fig. 1Effects of nectandrin A on BMP-2-inudced osteoblastic differentiation and mineralization in C2C12 cells. (A) Cells were cultured in a 96-well plate for 24 h and then the medium was replaced with DMEM containing 5% FBS and rhBMP-2 (100 ng/ml) in the presence or absence of nectandrin A (differentiation day 0). Cell viability assay was then performed on the differentiation day 3. Medium was changed every third day. (B) ALP enzyme activity and Alizarin Red staining were performed on the differentiation day 7 and 14, respectively. (C, D) ALP activity and calcium contents were measured at different time points after the induction of C2C12 differentiation in the presence or absence of nectandrin A. *p<0.05 and **p<0.01 compared to rhBMP-2 treated group.
|
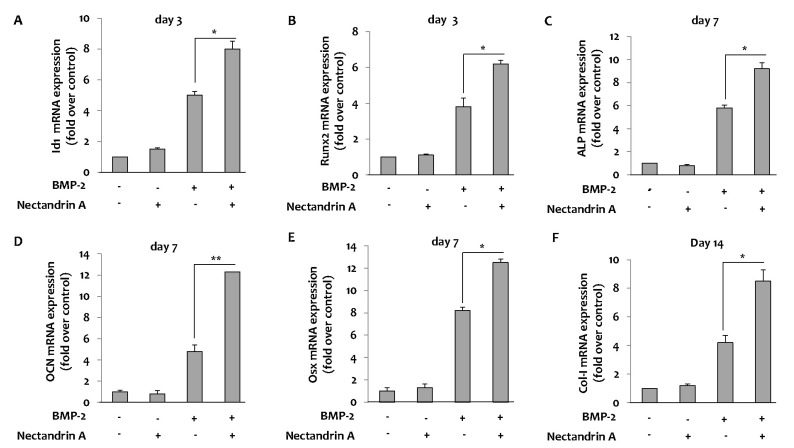 | Fig. 2Effects of nectandrin A on BMP-2-induced osteoblastic differentiation markers and transcription factors. C2C12 cells were cultured in a 6-well plate for 1 day and then the medium was replaced with DMEM containing 5% FBS and rhBMP-2 (100 ng/ml) in the presence or absence of nectandrin A (differentiation day 0). Medium was changed every third day. Total RNA was prepared and mRNA expression levels of Id1, Runx2, ALP, OCN, Osx and Col-I were analyzed by real-time PCR. The mRNA expression levels of Id1 (A) and Runx2 (B) were analyzed on day 3 and mRNA expression levels of ALP (C), OCN (D) and Osx (E) were analyzed on day 7. mRNA expression level of Col-I was analyzed on day 14 (F). Each value represents the mean±SEM of three independent experiments. *p<0.05 and **p<0.01 compared to rhBMP-2 treated group.
|
Nectandrin A enhances the BMP-2-induced osteoblastic differentiation via p38 MAPK-Smad signaling pathway
As shown in Fig. 3A, nectandrin A enhanced the luciferase activity of the BMP-2 specific reporter (Id1-Luc) driven by a BMP-responsive element (BRE) in the Id1 gene. As Smads bind to the BRE in the Id1 gene and regulate its expression, we next examined the effects of nectandrin A on Smad expression. The results showed a significant stimulation of Smad1/5/8 phosphorylation by nectandrin A in time- and concentration-dependent manners (Fig. 3B). It has been well demonstrated that once Smad1/5/8 is phosphorylated and activated, it forms a complex with Smad4 and then translocates into the nucleus to regulate Id1 gene transcription [9]. To ascertain whether Smad signaling pathway is required for nectandrin A-induced osteoblastic differentiation of C2C12 cells, C2C12 cells were co-transfected with expression vector encoding Smad4 and Id1-Luc reporter. After confirming the over-expression of Smad4 protein by immunoblotting using anti-Flag, the transfectants were stimulated with BMP-2 and nectandrin A. Ectopically expressed Smad4 promoted basal activation of Id1-Luc reporter, and nectandrin A further increased Id1-Luc activity in concentration-dependent manner when compared to that in the rhBMP-2 treatment group (Fig. 3C). These findings indicated that Smads signaling is associated with nectandrin A-induced osteoblastic differentiation of C2C12 cells.
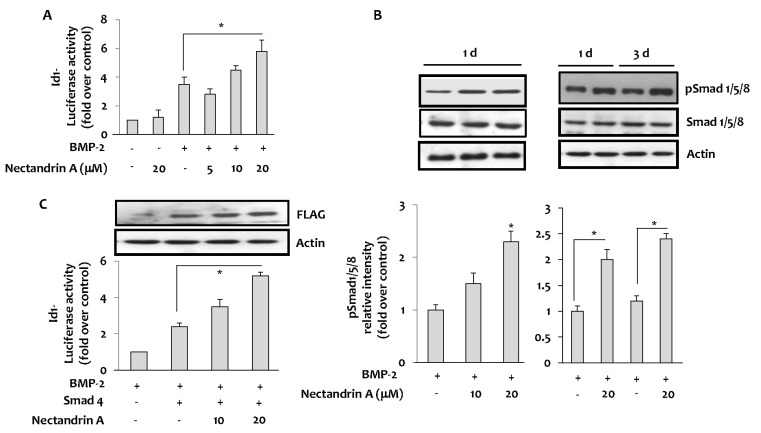 | Fig. 3Effects of nectandrin A on Id1 and Smad activation. (A) Id1 activation was measured by luciferase reporter assay using Id1-promoter-driven luciferase plasmid (Id1-Luc)-transfected C2C12 cells. Cells was cultured in a 6-well plate for 1 day and then incubated with DMEM containing 5% FBS in the presence or absence of rhBMP-2 with/without nectandrin A for 1 day. (B) The effect of nectandrin A on the activation of Smad was evaluated by Western blot analysis. Cells were cultured in a 6-well plate for 1 day and then incubated with DMEM containing 5% FBS in the presence or absence of rhBMP-2 (100 ng/ml) with/without nectandrin A for indicated time periods. (C) Cells were transfected with pCMV-Smad4-Flag with or without Id1-Luc reporter and then cells were incubated with DMEM containing 5% FBS and 100 ng/ml rhBMP-2 in the presence or absence of nectandrin A for 4 h. *p<0.05 compared to rhBMP-2 treated group.
|
In addition to the Smads family of proteins, MAPKs are also known to be involved in BMP-2 osteogenic signal transduction [10]. Treatment with BMP-2 increased phosphorylation level of p38 MAPK and it was further enhanced by the addition of nectandrin A in time- and concentration-dependent manners (Fig. 4A and B). These results suggested that p38 MAPK could be a downstream signaling molecule of BMP-2. In subsequent studies, we investigated functional involvement of p38 MAPK in the process of nectandrin A-enhanced osteoblastic action of BMP-2. If the initiation of p38 MAPK activation is affected by nectandrin A treatment, it should be occurred within the same time frame as phosphorylation of Smads. In the absence of BMP-2, nectandrin A phosphorylated Smad1/5/8 and p38 MAPK time-dependently, which reached maximum level within 15 min and then declined. However, in the presence of BMP-2, phosphorylations of these signal molecules persisted throughout the 120 min period of nectandrin A stimulation (Fig. 4A). In addition, nectandrin A-induced increases in Smad1/5/8 phosphorylation and ALP activity were blocked in the presence of SB203580, a specific inhibitor of p38 MAPK, indicating that p38 MAPK is an upstream regulator in the nectandrin A-induced Smad signaling pathway (Fig. 4C and D). These results suggest that nectandrin A induces osteoblastic differentiation and mineralization with the involvement of p38 MAPK-Smad signaling pathway.
 | Fig. 4Involvement of p38 MAPK in the nectandrin A-enhanced osteoblastic differentiation. (A) Cells were cultured in a 6-well plate for 1 day and then incubated with DMEM containing 5% FBS in the presence or absence of BMP-2 and/or nectandrin A for up to 120 min. (B) Phosphorylated levels of p38 and Smad1/5/8 were determined after C2C12 cells were treated with nectantrin A as indicated in the presence of BMP-2. (C) Cells in a 6-well plate were treated with indicated concentrations of SB203580 for 1 h, followed by 15 min treatment with 100 ng/ml rhBMP-2 with/without 20 µM nectandrin A. (D) On differentiation day 6, ALP enzyme activity was determined as described in 'Methods'. *p<0.05 compared to rhBMP-2 plus nectandrin A treated group.
|
Go to :
DISCUSSION
To design anti-osteoporotic agents, it is important to consider both stimulators for bone formation and inhibitors for bone destruction. Because anti-osteoporotic agents to inhibit osteoclast differentiation and function have numerous side effects such as breast cancer, venous thromboembolism, rhinitis, esophageal ulcer, there are imperative needs to develop therapeutic agents promoting bone formation in the treatment of osteoporotic bone disease. The present study demonstrated that nectandrin A augmented the BMP-induced osteoblast differentiation of the C2C12 myoblastic cells. We also revealed an interesting finding in which p38 MAPK is associated with the nectandrin A-induced osteoblastic differentiation and mineralization and might be an upstream kinase for Smad signaling pathway.
Bone morphogenetic proteins (BMPs) belong to a large family of structurally related proteins, known as the transforming growth factor-β (TGF-β) superfamily. BMPs were found to have important roles in directing cell fate choices of mesenchymal cells in vitro. They stimulate osteoblast differentiation and inhibit the differentiation of mesenchymal cells into the myoblast lineage [11-13]. First, the effect of nectandrin A on commitment of mesenchymal stem cells (C2C12 cells) into osteoblasts was evaluated by measuring ALP activity, mineralization and calcium contents. Nectandrin A markedly increased ALP activity and mineralization when compared to those in the rhBMP-2 treatment group (Fig. 1B). BMPs control growth and differentiation of many different cell types via changes in gene expression. A number of BMP target genes have been identified, including Runx2/Cbfa1, JunB, Msx2 and Dlx5. Recent studies have shown that Id proteins are potently induced by BMPs in different cell types [14]. Inhibitors of DNA binding/differentiation (Id), which are inhibitory helix-loop-helix (HLH) transcription factors, have been reported to affect the balance between cell growth and differentiation of osteoblast [15,16]. BMPs potently up-regulate Id proteins in mesenchymal cells and the differentiation of mesenchymal cells into myoblasts and adipocytes are potently inhibited by Id proteins [17,18]. As shown in Fig. 2, BMP-2 significantly up-regulated Id1 mRNA expression levels as well as osteogenic genes such as Runx2, ALP, OCN, Osx and Col-I, and nectandrin A even further increased the mRNA expression of these genes when the cells were pretreated with rhBMP-2. These results indicated that mesenchymal stem cells (C2C12 cells) were successfully differentiated into osteoblasts under BMP-2 treatment, and osteoblastic differentiation and mineralization were enhanced by nectandrin A treatment.
Upon ligand-induced heteromeric complex formation between types I and II BMP receptors, type I BMP receptor is activated and initiates intracellular signaling by phosphorylating specific down-stream components, including the nuclear effector Smad proteins. Western blot analyses showed that nectandrin A increased phosphorylation of Smad1/5/8 in concentration- and time-dependent manners when the cells were treated with nectandrin A in the presence of BMP-2 (Fig. 3B). The fact that Smad signaling pathway is required for nectandrin A-enhanced osteoblastic differentiation of C2C12 cells was confirmed in cells co-transfected with Smad4 and Id1-Luc reporter (Fig. 3C), because Smad1/5/8 (R-Smad) forms a complex with common partner Smad (co-Smad, Smad4), translocates into the nucleus and regulates the transcription of target genes through an interaction with transcription factors and transcriptional activators [9].
Although BMP activates the Smad pathway to modulate gene transcription, there is growing evidence that other pathways distinct from the Smad pathway, are initiated downstream of the receptor complex. TGF-β family members have been shown to activate small GTP-binding proteins and MAP kinases in certain cells [19]. Erk1/2 and p38 MAPK are members of MAPK and known to be involved in osteoblast differentiation [20]. To investigate whether p38 MAPK is associated with nectandrin A-enhanced osteoblastic differentiation, protein expression of p38 was determined. As shown in Fig. 4A and B, nectandrin A markedly phosphorylated p38 in time- and concentration-dependent manners. In addition, phosphorylated protein levels of ATF2 (a well-known substrate of p38) and Smad1/5/8 were reversed when the cells were pretreated with SB203580, a specific inhibitor of p38 MAPK, suggesting that p38 MAPK might be an upstream kinase for BMP-Smad signaling pathway in nectandrin A-enhanced osteoblatic differentiation and mineralization of C2C12 cells.
In summary, we found that nectandrin A enhances the BMP-induced osteoblastic differentiation and mineralization of C2C12 cells via activation of p38-Smad-Id1 signaling pathways. Nectandrin A may possess a therapeutic potential for osteoporosis by promoting bone formation.
Go to :
 XML Download