

 PDF
PDF ePub
ePub Citation
 Print
Print


ABBREVIATIONS
Bcl-2
B-cell lymphoma 2
CPT1
carnitine palmitoyltransferase I
DAG
diacylglycerol(s)
DGAT
acyl-coenzyme A:diacylglycerol acyltransferase
FFA
free fatty acid(s)
MTT
3-(4,5-dimethyl-2-thiazolyl)-2,5-diphenyltetrazolium bromide
MUFA
monounsaturated fatty acid(s)
OLA
oleic acid
PAM
palmitic acid
PARP
poly (ADP-ribose) polymerase
PUFA
polyunsaturated fatty acid(s)
RT-PCR
reverse transcription-polymerase chain reaction
SFA
saturated fatty acid(s)
TAG
triacylglycerol(s)
INTRODUCTION
Obesity is an important risk factor in the development of metabolic syndromes such as insulin resistance, type 2 diabetes, and cardiovascular diseases. Prolonged elevated levels of circulating free fatty acids (FFA) in obesity result in excessive fat accumulation within non-adipose tissues such as skeletal muscles, heart, liver, and pancreas [1]. Such excessive accumulation of cellular FFA triggers deleterious reactions that may lead to cellular dysfunctions and programmed cell death. For examples, chronically elevated FFA interferes with pancreatic β-cell function by inducing glucose-dependent insulin secretory failure and β-cell apoptosis [2,3]. FFA overload also induces insulin resistance in skeletal muscle cells, impaired insulin-mediated suppression of hepatic glucose production, hepatocyte apoptosis, and cardiomyopathy [4,5]. These detrimental effects of FFA are collectively referred to as lipotoxicity and known to depend on their chain length and degree of saturation. Many investigators have reported that saturated fatty acids (SFA) such as palmitic acid (PAM) and stearic acid are almost universally toxic to cells, whereas monounsaturated fatty acids (MUFA) such as oleic acid (OLA) and palmitoleic acid are either non-toxic or cytoprotective in many types of cells [6-9]. However, the mechanisms by which these SFA and MUFA cause different effects on cells have not been fully elucidated. Potential candidates that mediate the toxic effects of SFA include the accumulation of diacylglycerol (DAG), an increase in production of ceramide, increased oxidative stress, endoplasmic reticulum (ER) stress, and mitochondrial dysfunction [10-13]. Meanwhile, it has been proposed that MUFA protects the cells from SFA-induced lipotoxicity by inhibiting intracellular DAG accumulation and blocking ER stress in skeletal muscle cells, renal tubular cells, and hepatocytes [8,12,13].
It has been reported that the proportion of fat is higher in the pancreas than in muscle and liver in human obesity [14]. Intracellular lipid accumulation has also been reported in pancreatic exocrine parenchyma and islet β-cells of rats fed with high fat diet [15,16]. The exocrine pancreas secretes pancreatic juice that contains a number of digestive enzymes and bicarbonate ions to help digestion of ingested foodstuffs. Obesity affects these exocrine pancreatic functions and survival of exocrine cells. In particular, obesity has been implicated as a risk factor for acute pancreatitis and pancreatic cancer [17]. Exocrine pancreatic dysfunction has also been observed in genetically obese Zucker rats and in patients with diabetes mellitus, both type 1 and type 2 [18,19]. Chronic pancreatitis has long been thought to be associated with immoderate alcohol consumption. However, overweight before disease onset has been recently suggested to be another risk factor for alcoholic chronic pancreatitis in human [20]. It has previously been reported that PAM, one of the representative SFA in plasma and adipose tissues, induces apoptosis of exocrine pancreatic AR42J cells by disturbing the balance of mRNA expression between anti-apoptotic Bcl-2 and pro-apoptotic Bax [21]. However, the more detailed cellular mechanisms by which PAM exerts its cytotoxic effects have not yet been thoroughly investigated in exocrine pancreatic cells. Furthermore, the effects of MUFA on PAM-induced apoptosis of exocrine pancreatic cells have not yet been so far investigated.
In this study, we investigated the effects of different kinds of SFA, MUFA, and polyunsaturated fatty acids (PUFA) on apoptotic cell death of pancreatic AR42J cells and then, investigated the mechanisms underlying the protective effect of OLA against the lipotoxic actions of PAM. We report here that cytoprotective effect of OLA is associated with restoration of disturbed anti-apoptotic/proapoptotic protein balance in PAM-treated cells. In addition, we showed that OLA-induced up-regulation of expressions of genes involved in triacylglycerol (TAG) synthesis (Dgat2) and mitochondrial β-oxidation (Cpt1) may possibly contribute to cytoprotective actions of OLA. These results provide the mechanisms underlying OLA's protective effect against SFA-induced apoptosis of exocrine pancreatic cells in part.
Go to : 
METHODS
Materials
AR42J cell line, derived from an azaserine-induced pancreatic rat tumor, was purchased from the ATCC (Rockville, USA). Dulbecco's modified Eagle's medium/Ham's F-12 medium (DMEM/F-12) and fetal bovine serum (FBS) were purchased from Lonza (Walkersville, USA). SFA, MUFA, and PUFA used in this study and Oil red O were obtained from Sigma (St. Louis, USA). FFA free-bovine serum albumin (BSA) was obtained from Fitzgerald (North Acton, USA). 3-(4,5-Dimethyl-2-thiazolyl)-2,5-diphenyltetrazolium bromide (MTT) was purchased from Amresco (Solon, USA). Antibodies used in Western blotting were purchased from Cell Signaling (Danvers, USA) and Santacruz (Santa Cruz, USA). Oligo-primers for reverse transcription-polymerase chain reaction (RT-PCR) amplification were synthesized by Bioneer (Daejeon, Korea).
Cell culture and FFA treatment
AR42J cells were maintained in DMEM/F-12 containing 10% FBS and Antibiotic-antimycotic (Gibco, USA) at 37℃ under a humidified condition of 95% air and 5% CO2. All FFA were treated to cells after conjugation with FFA-free BSA as previously described method with slight modifications [13]. Briefly, FFA (myristic acid, palmitic acid, stearic acid, arachidic acid, palmitoleic acid, oleic acid, linoleic acid, linolenic acid) were dissolved in absolute ethanol at a concentration of 2~100 mM and diluted to a ratio of 1:200 with the appropriate concentration of FFA-free BSA (0.2% BSA for 50 µM FFA, 1% BSA for 250 µM FFA, and 2% BSA for 500 µM FFA), and then incubated for 3 h at 37℃ prior to experiment initiation. The molar ratio of FFA/BSA in this preparation is reported to be similar to that observed in human serum [22]. Cells were routinely plated at 1×10⁵ cells onto 24-well culture dishes. After overnight attachment of the cells, the culture medium was replaced by fresh serum-free DMEM/F-12 with or without various concentrations of FFA for the time periods indicated. The final concentration of ethanol in culture media was 0.5% (v/v), which had no significant effect on cell viability.
Cell viability assay
After FFA treatment, cultured cells in 24-well dishes were washed with phosphate buffered saline (PBS) and incubated with phenol red-free DMEM containing 1 mg/ml MTT for 3 h at 37℃, and then 0.5 ml 2-propanol was added to each well for 30 min. The absorbance of the dissolved MTT-derived formazan was measured at 540 nm to assess the living cells in culture. Data are displayed as a percentage of untreated controls.
Western blot analysis
Whole cell lysates were prepared by washing the cells twice with cold PBS followed by lysing the cells on ice with lysis buffer (150 mM NaCl, 50 mM Tris, 1 mM PMSF, 1 mM Na3VO4, 1% NP-40, 0.1% SDS, 0.5% deoxycholic acid, 1% protease inhibitor cocktail, pH 7.5) for 20 min. Proteins in cell lysates were separated by sodium dodecyl sulfate-polyacrylamide gel electrophoresis (SDS-PAGE) and the proteins were transferred onto PVDF membrane. The membranes were incubated with 5% non-fat dry milk, and then incubated with antibodies towards Bcl-2, Bcl-xL, Mcl-1, Bak, cleaved caspase-3 (Asp175), and cleaved PARP (Asp214) for overnight at 4℃ Membranes were incubated with appropriate horseradish peroxidase-linked secondary antibody (Cell Signaling, Danvers, USA) at a dilution of 1:2,500. Immunoreactive bands were detected using the Enhanced chemiluminescence Western blotting detection system from GE Healthcare (Buckinghamshire, UK) according to manufacturer's instructions. The bands were quantified using ImageQuant software. The expression level of each protein was normalized to that of a housekeeping protein, β-actin.
Reverse transcription-polymerase chain reaction (RT-PCR)
Extraction of total RNA and the RT-PCR determination of mRNA expression from cultured cells were carried out using the easy-BLUE reagent and Maxime RT-PCR Premix kit from Intron (Sungnam, Korea) according to manufacturer's protocol. The sequences of the sense and antisense oligo-primers used for PCR amplification were as follows, respectively: Dgat-1, 5'-GGATGGTCCCTACTATCCAG-3' and 5'-CCACCAGTCCCTGTAGAACT-3'; Dgat-2, 5'-GGAGGCCACCGAAGTTAGCA-3' and 5'-CACCTCCCACCACGATGACAA-3'; Cpt-1, 5'-TTTCCAGTGTCCTTGCTGC-3' and 5'-AAAGCCATGCCAAATGTCTC-3'; β-actin, 5'-TCCGTAAAGACCTCTATGCC-3' and 5'-AAAGCCATGCCAAATGTCTC-3'. RT-PCR was performed using a Perkin-Elmer thermal cycler (model 9600) for 26~35 cycles. Amplification programs of denaturation, primer annealing and primer extension were utilized as follows, respectively: Dgat1 and Dgat2 (94℃, 1 min; 57℃, 45 sec; 72℃, 5 min), and Cpt1 (94℃, 1 min; 51℃, 1 min; 72℃, 5 min). A housekeeping gene, β-actin was used for control. The PCR products were separated by electrophoresis on 1.5% agarose gel and visualized by ethidium bromide staining. The bands were quantified using ImageQuant software.
Oil Red O staining
To visualize and quantify intracellular neutral TAG, cells were stained with Oil Red O. In brief, cultured cells in 60 mm dishes were treated with 2 ml of 10% formalin and incubated for 10 min. After washing the cells with 2 ml of 60% isopropanol for 5 min, added Oil Red O working solution (5 mM Oil Red O in 60% isopropanol) to dried cells for 10 min at room temperature. Then stained dye was extracted by adding 1 ml of 100% isopropanol to dried cells for 10 min and the absorbance at 500 nm was measured using isopropanol as blank.
Hoechst staining
Cells were stained with Hoechst 33342 to distinguish apoptotic cells as previously described method with slight modifications [23]. Cells were treated with PAM with or without OLA for 2 days, washed with PBS, fixed with 4% paraformalin for 15 min, and then stained with 1 µM Hoechst 33342 for 60 min at room temperature. Approximately one hundred cells were selected at six independent times and cells with condensed and segmented chromatin were counted under fluorescence microscopy. The percentage of apoptotic cells to total cells was calculated.
Statistical analysis
All data represent at least three independent experiments and are expressed as means±SEM. One-way analysis of variance with post Dunnett's test was used for multiple comparisons and two-tailed Student's t-test was used to compare values between two groups using the GraphPad Prism software. p-values p<0.05 were considered statistically significant.
Go to :
RESULTS
OLA inhibits PAM-induced apoptotic cell death
When AR42J cells were incubated with different doses of SFA for 48 h, cell viability was decreased in a dose-dependent manner as shown in Fig. 1A. Significant cell death was already detected at PAM (C16:0) in concentrations as low as 10 µM. Meanwhile, myristic acid (C14:0), stearic acid (C18:0), and arachidic acid (C20:0) all significantly induced cell death at higher concentrations than 10 µM. In contrast, all the long-chain unsaturated FFA inhibited PAM-induced cell death. The protective effect of OLA was observed at the concentration as low as 10 µM, reached maximum at 250 µM (Fig. 1B), but was not further augmented when the OLA concentration was raised to 500 µM and 1,000 µM in 250 µM PAM-treated cells (data not shown). Hoechst staining was carried out to confirm the apoptotic cell death in PAM-treated cells. Cells treated with PAM for 2 days clearly exhibited bright blue-stained condensed chromatin particles that are one of the characteristic changes of apoptosis. However, co-treatment of OLA with PAM significantly inhibited the formation of condensed chromatin particles in cells (Fig. 1C).
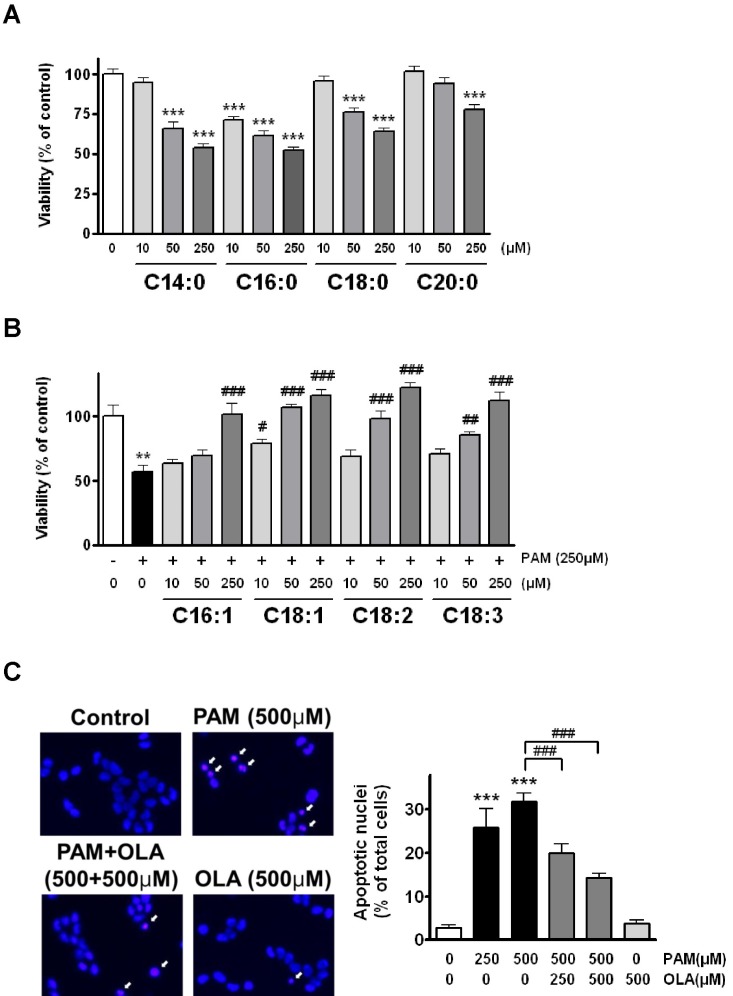 | Fig. 1Co-treatment with oleic acid (OLA) inhibits palmitic acid (PAM)-induced apoptosis in AR42J cells. (A) Different saturated fatty acids induce cell death. Cells were incubated with 10~250 µM of myristic acid (C14:0), palmitic acid (C16:0), stearic acid (C18:0), and arachidic acid (C20:0) for 48 h and then, cell viability was estimated by MTT assay. (B) Different unsaturated fatty acids inhibit PAM-induced cell death. Cells were incubated with 10~250 µM of palmitoleic acid (C16:1), oleic acid (C18:1), linoleic acid (C18:2), and linolenic acid (C18:3) in the presence of 250 µM PAM for 48 h. (C) OLA inhibits PAM-induced apoptosis. Photographs shown on the left are the representative images of Hoechst 33342-stained cells exposed to PAM and OLA either alone or in combination for 48 h. The percentage of apoptotic cells with condensed and segmented chromatin (arrows) is calculated. The results are presented as means±SEM of 4~6 independent experiments. **p<0.01, ***p<0.001, compared to untreated control and #p<0.05, ##p<0.01, ###p<0.001, compared to PAM-treated cells.
|
OLA restores PAM-induced changes in levels of apoptosis-related proteins
Next, we examined whether OLA exerts its cytoprotective effect via regulation of the apoptosis-related proteins such as anti-apoptotic Bcl-2 proteins (Bcl-2, Bcl-xL, Mcl-1) and pro-apoptotic or apoptotic proteins (Bak, cleaved caspase-3, cleaved PARP). When cells were exposed to 250 µM PAM, the levels of anti-apoptotic Bcl-2, Bcl-xL, and Mcl-1 were dramatically decreased to 4% (Bcl-xL)-13% (Bcl-2) compared to the levels of the control group (untreated cells) for 48 h (Fig. 2). However, OLA significantly attenuated the PAM-induced reductions in levels of these proteins. OLA itself did not change the levels of Bcl-2 and Bcl-xL, but considerably lowered the Mcl-1 levels. In contrast, PAM dramatically increased pro-apoptotic Bak level and enhanced the cleavage of caspase-3 and PARP as shown in Fig. 2 and Fig. 3. Cleaved caspase-3, an active form of caspase-3, in turn cleaves nuclear protein PARP and eventually induces apoptosis. On the contrary to PAM, OLA markedly inhibited the levels of cleaved caspase-3, cleaved PARP, and Bak in PAM-treated cells.
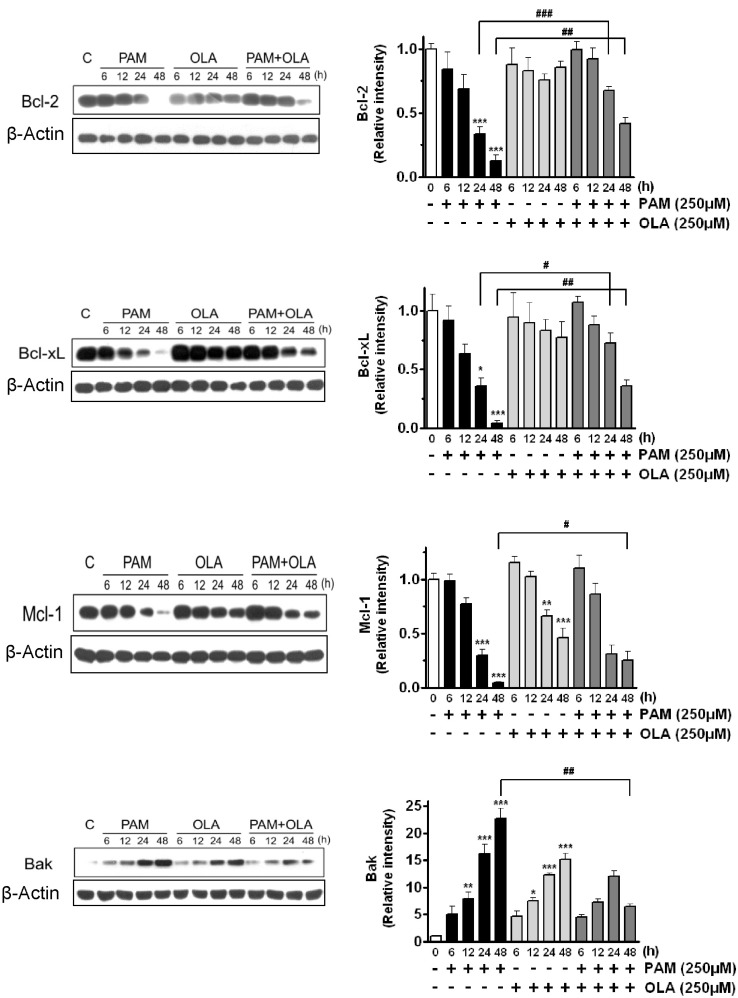 | Fig. 2Effects of oleic acid (OLA) on the levels of anti-apoptotic (Bcl-2, Bcl-xL, Mcl-1) and pro-apoptotic (Bak) Bcl-2 family proteins in palmitic acid (PAM)-treated AR42J cells. Cells were incubated with 250 µM OLA for 6~48 h in the presence or absence of 250 µM PAM. The levels of Bcl-2, Bcl-xL, Mcl-1, and Bak were detected by Western blotting. The results on the right are presented as means±SEM of 3~7 independent experiments. The expression level of each protein was normalized to that of a housekeeping protein, β-actin. *p<0.05, **p<0.01, ***p<0.001, compared to untreated control and #p<0.05, ##p<0.01, ###p<0.001, compared to PAM-treated cells.
|
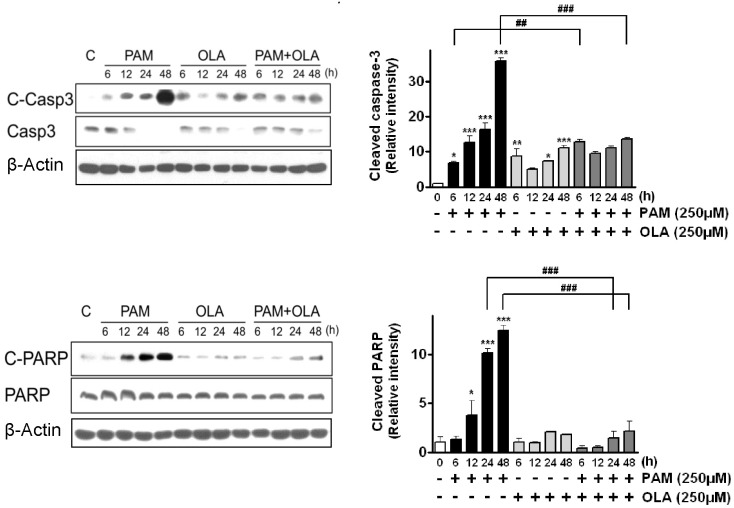 | Fig. 3Effects of oleic acid (OLA) on the levels of cleaved apoptotic proteins (caspase-3, PARP) in palmitic acid (PAM)-treated AR42J cells. Cells were incubated with 250 µM OLA for 6~48 h in the presence or absence of 250 µM PAM. The levels of cleaved caspase-3 (C-Casp3) and cleaved PARP (C-PARP) were detected by Western blotting. The results on the right are presented as means±SEM of 3 independent experiments. The expression level of each protein was normalized to that of a housekeeping protein, β-actin. *p<0.05, ***p<0.001, compared to untreated control and ##p<0.01, ###p<0.001, compared to PAM-treated cells.
|
OLA increases the expressions of Dgat2 and Cpt1 genes
To investigate possible involvement of the enzymes responsible for the treatment of FFA in AR42J cells, we measured gene expressions of acyl-coenzyme A:diacylglycerol acyltransferase (DGAT) and carnitine palmitoyltransferase I (CPT1) which are important enzymes involved in TAG synthesis and β-oxidation, respectively. DGAT catalyzes the last acylation in the formation of TAG from DAG and is rate-limiting enzyme for the TAG formation. CPT1 is a mitochondrial enzyme which mediates the transport of long-chain FFA across the membrane for β-oxidation by binding them to carnitine [24]. When cells were cultured in the presence of PAM or OLA, the expression level of Dgat1 was not affected. In the other hand, the Dgat2 expression was considerably lower in cells exposed to PAM, whereas 250 µM OLA significantly increased the Dgat2 expressions in both of untreated control cells and 250 µM PAM-treated cells. The expression of Cpt1 was increased when cells were exposed to FFA (PAM or OLA) compared to untreated control cells. Co-treatment of 250 µM OLA significantly augmented transcript levels of Cpt1 in PAM-treated cells (Fig. 4).
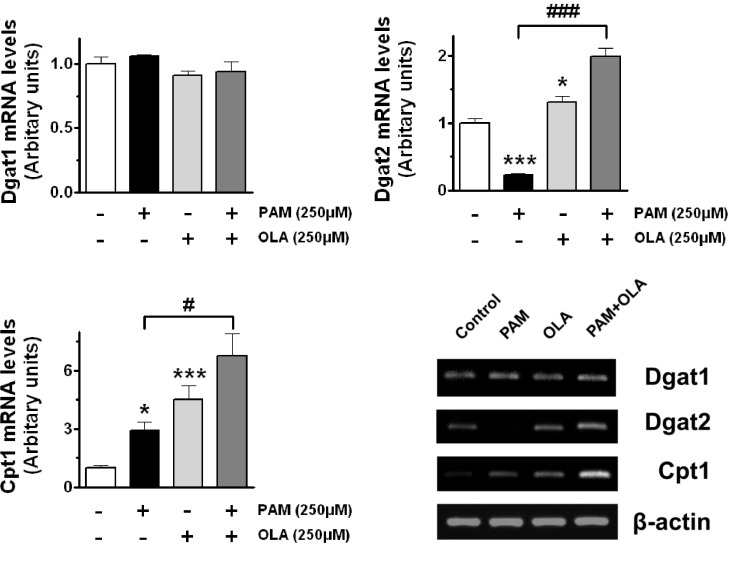 | Fig. 4Oleic acid (OLA) induces up-regulation of Dgat2 and Cpt1 gene expressions in AR42J cells. Cells were incubated with 250 µM OLA for 48 h in the presence or absence of 250 µM palmitic acid (PAM). The mRNA expressions of Dgat1, Dgat2, and Cpt1 genes were determined by RT-PCR. Density of each band was quantified using ImageQuant software. The results are presented as means±SEM of 3~6 independent experiments. The expression level of each gene was normalized to that of a housekeeping gene, β-actin. *p<0.05, ***p<0.001, compared to untreated control and #p<0.05, ###p<0.001, compared to PAM-treated cells.
|
OLA increases intracellular TAG accumulation
Relative content of intracellular TAG, the enzymatic product of DGAT, was estimated by Oil Red O staining followed by spectrophotometry after isopropanol extraction. After staining of cells with Oil Red O, lipid droplets with light red cytoplasmic staining were increased in cells exposed to 250 µM OLA compared to untreated control cells (Fig. 5). Co-supplementation of OLA also significantly increased the staining of lipid droplets and content of intracellular TAG in PAM-treated cells.
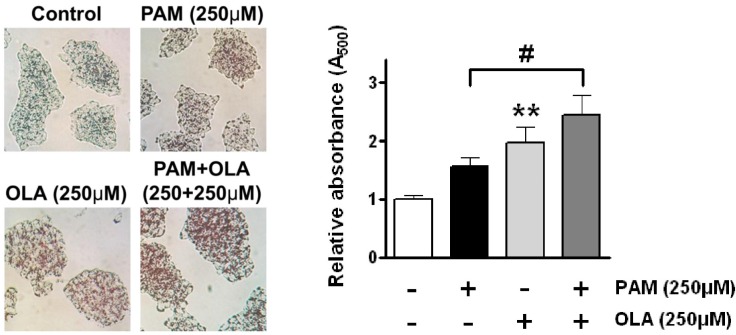 | Fig. 5Oleic acid (OLA) increases the accumulation of intracellular triglyceride (TAG) in AR42J cells. Cells were incubated with 250 µM OLA for 48 h in the presence or absence of 250 µM palmitic acid (PAM). Photographs shown on the left are the representative images of Oil Red O-stained cells exposed to PAM and OLA either alone or in combination for 48 h. After staining cells with Oil Red O, stained dye was extracted with isopropanol and absorbance at 500 nm was measured to estimate the relative content of intracellular TAG. The results on the right are presented as means±SEM of 6 independent experiments. **p<0.01, compared to untreated control and #p<0.05, compared to PAM-treated cells.
|
Go to :
DISCUSSION
In this study, we showed that oleic acid (OLA) has protective effects against the palmitic acid (PAM)-induced apoptosis by restoring the disturbed anti-apoptotic/proapoptotic protein balance in pancreatic AR42J cells. Consistent with previous study by other investigators [21], we confirmed again that PAM induced apoptosis in AR42J cells. PAM increased the number of cell with condensed chromatin typical to apoptotic nuclei in a dose-dependent manner and consequently decreased viability of AR42J cells. We also found that PAM has the stronger cytotoxic effect than other SFA with C14~C20 hydrocarbon-chain in AR42J cells. A result similar to our observation has reported in C2C12 myotubes that PAM has the most potent inhibitory effect on insulin signaling among different C12~C24 hydrocarbon-chain SFA [25]. PAM has also been shown to increase the activity of caspase-3 which is a key component of the pro-apoptotic machinery of cells, whereas the SFA with short hydrocarbon-chain (C12 and C14) and MUFA did not induce caspase-3 activation in L6 skeletal muscle cells [10]. Although it is generally accepted that MUFA have protective effects against PAM-induced lipotoxicity in many cell types, cytoprotective effect of MUFA have not yet been examined in exocrine pancreatic cells. We showed in this study that cytoprotective potential of MUFA with C18 hydrocarbon-chain (OLA) was more potent than that of MUFA with C16 hydrocarbon chain (palmitoleic acid) in PAM-treated cells. And MUFA, OLA had more potent cytoprotective effect against PAM than PUFA with having 2 or 3 double bonds.
However, there are controversies regarding the cytoprotective effects of OLA on the survival of pancreatic cells. DNA fragmentation has been observed in pancreatic β cells treated with OLA, although OLA caused much less DNA fragmentation than PAM [26]. In addition, retrograde intraductal infusion of OLA destroyed acinar cells and pancreatic ductus epithelia, and eventually induced pancreatitis which appears to be developed by disturbance of pancreatic fluid flow with viscous substance in duct [27].
Apoptosis is a form of regulated cell death and a normal mechanism for cellular turnover, but it may be accelerated by cellular stresses caused by several cytotoxic factors. Many molecular mechanisms have been implicated in PAM-induced apoptosis including generation of reactive oxygen species, NO synthesis, ER stress, mitochondrial dysfunction, and accumulation of harmful lipid metabolites [10-13,24,28]. Especially, apoptosis is closely associated with mitochondrial cytochrome c release that is regulated by the Bcl-2 family proteins in most cases. The pro-apoptotic multidomain Bcl-2 proteins act to permeabilize the outer mitochondrial membrane, leading to release of cytochrome c, whereas the anti-apoptotic Bcl-2 proteins act to inhibit pro-apoptotic Bak and Bax proteins. The Bcl-2 family proteins have reported to be involved in SFA-induced apoptosis of cells including pancreatic AR42J cells, pancreatic β-cells, and human granulosa cells [6,21,29]. A previous study by Landau et al. showed that PAM induced AR42J cell apoptosis through disturbance of the Bax/Bcl-2 balance at gene expression level [21]. In this study, we also confirmed at protein level that Bcl-2 family proteins are involved in PAM-induced apoptosis of AR42J cells. A rapid reduction in anti-apoptotic Bcl-2 family proteins (Bcl-2, Bcl-xL, Mcl-1) was observed after treatment of PAM, while pro-apoptotic Bak protein was inversely induced by treatment of PAM in a time-dependent manner. PAM-induced reduction in Bcl-2 levels has also been observed in other cells [6,29]. However, it has been reported that different kinds of anti-apoptotic/pro-apoptotic proteins are involved in the PAM-induced apoptosis depend on cell type. In hepatocytes, PAM increased levels of pro-apoptotic proteins, PUMA and Bim, whereas levels of other anti-apoptotic protein (Bcl-xL) and pro-apoptotic proteins (Bak, Bax, Bid, Bad) were unaltered by PAM [8]. In this study, OLA itself did not significantly affect the levels of Bcl-2 and Bcl-xL, whereas protein levels of Mcl-1 were decreased by OLA for more than a day. Even so, OLA attenuated the PAM-induced reduction of Mcl-1 protein when OLA coincubated with PAM for 48 h. It is confused in some degree and hard to explain the protective effects of OLA on PAM-induced reduction of Mcl-1. It has been reported that PAM induced Mcl-1 degradation by a proteasome-dependent pathway in hepatocytes [30] and down-regulation by ER stress-mediated inhibition of translation through eIF2α phosphorylation in pancreatic β-cells [31]. PAM-induced Mcl-1 degradation has also reported to be attenuate by inhibition of PKCθ in hepatocytes [30]. However, the effects of OLA on PAM-induced reduction of Mcl-1 have not yet been reported as far as we know. Therefore, it is assumed at the present time that OLA may affect the processes involved in degradation or down-regulation of Mcl-1 in cells exposed to PAM. Additionally, because it has been reported that OLA prevented PAM-induced phosphorylation of PKCθ in muscle cells [32] and renal tubular cells [12], further studies will be required to determine in AR42J cells whether PKCθ is involved in the inhibitory effect of OLA against PAM-induced reduction of Mcl-1 or not.
The cleavage of apoptotic effector proteins, caspase-3 and PARP, was also greatly enhanced in cells exposed to PAM. Therefore, the mechanism underlying PAM-induced apoptosis seems to be clearly explained by the reciprocal changes between anti-apoptotic proteins and pro-apoptotic proteins in AR42J cells. On the contrary, OLA attenuated the reduction of anti-apoptotic Bcl-2 proteins, induction of pro-apoptotic Bak protein, and activation of caspase-3/PARP in PAM-treated cells, thereby restoring the disturbed anti-apoptotic/pro-apoptotic protein balance from apoptosis toward cell survival. Caspase activation has been demonstrated during apoptosis induced by many harmful cellular stresses. Recently, similar result to our data has reported in human pancreatic β cells that stearic acid-induced apoptosis was associated with significant activation of caspase-6, -7, -9, -2, and -8 but not with activation of caspase-3. And the activation of these caspases was significantly reduced by coincubation with OLA [33].
FFA may exert their effects directly through cell membrane receptors, such as G protein-coupled receptor 40 or indirectly via their intracellular metabolites, such as DAG, ceramide, and lysophosphatidylcholine [10,12,24,28]. Although several mechanisms have been suggested to explain the differences in action between SFA and MUFA with respect to cell survival, the reasons why the different FFA types behave so differently remain to be more clearly defined. Recently, there has been a proposal of a model that puts the several experimental evidences together in which MUFA promote detoxification processes of deleterious actions of SFA through enhancing their esterification in storage form of TAG and through promoting their clearance by β-oxidation [34]. It has also been suggested that OLA protects against PAM-induced inflammation and insulin resistance in skeletal muscle cells by promoting TAG accumulation and mitochondrial β-oxidation [32]. We therefore examined the possible involvement of enzymes participate in TAG synthesis and mitochondrial β-oxidation at gene expression level in AR42J cells. The enzyme DGAT catalyzes the formation of TAG from DAG and is used as an indicator of TAG synthesis. This reaction is considered the terminal and only committed step in TAG synthesis and to be essential for the formation of adipose tissue [35]. In mammals, there are two isoforms of DGAT enzymes, DGAT1 and DGAT2. Although both enzymes catalyze the same reactions in the synthesis of TAG, they have no sequence homology to each other [36]. Mitochondrial enzyme CPT1 mediates the transport of long chain fatty acids across the membrane by binding them to carnitine and is essential for FFA oxidation [37]. Our data showed that the mRNA expressions of Dgat2 and Cpt1 were up-regulated by co-treatment of OLA in PAM-treated cells. Although two isoforms of Dgat were expressed in AR42J cells, only Dgat2 expression responded to FFA treatment under our experimental conditions. Gene knockout studies in mice by other investigators have shown that DGAT1 contributes to TAG synthesis but is not essential for life, whereas DGAT2 plays a fundamental role in TAG synthesis and is required for survival [38]. The transcript level of Dgat2 was markedly decreased by treatment of PAM, whereas OLA fully restored and further increased Dgat2 expression in PAM-treated cells. When relative accumulation of intracellular TAG was estimated by Oil Red O staining, channeling of the FFA into TAG was especially high in cells exposed to OLA rather than PAM. Therefore, these data suggested that increased accumulation of TAG possibly results from up-regulation of Dgat2 expression in OLA-treated cells. It has reported that TAG accumulation protects cells against SFA-induced lipotoxicity by reducing the formation of other lipid metabolites with more deleterious effects [12,16,34,39]. On the other hand, both PAM and OLA distinctly induced the expression of Cpt1. However, Cpt1 expression was significantly augmented about twice through co-supplementation of OLA in PAM-treated cells. Although we did not quantify the mitochondrial β-oxidation in this study, OLA-induced Cpt1 expression may lead to entry of long-chain FFA into mitochondria for their combustion, and consequentially decreases the formation of deleterious lipid metabolites such as DAG. It is therefore possible that OLA may protect AR42J cells against the detrimental effect of PAM by promoting TAG formation.
We conclude that OLA attenuates PAM-induced apoptotic cell death by restoring the disturbed anti-apoptotic/pro-apoptotic protein balance toward cell survival in pancreatic AR42J cells. In addition, OLA-induced TAG formation may also partly contribute to beneficial effect of OLA.
Obesity has been considered as an important risk factor for pancreatic diseases including pancreatitis and pancreatic cancer. Severe acute pancreatitis and pancreatic cancer are significantly more frequent in obese patients. The underlying mechanisms for these pancreatic disorders are closely related to increased inflammation and cell death from increased amount of pancreatic fat accumulation [17-20]. Therefore, OLA supplementation has the ability to protect exocrine pancreatic cells from PAM-induced apoptosis and, may reduce prevalence rate of pancreatic diseases caused by obesity. In this regard, the present study enhances the understanding of the mechanisms involved in protective effects of OLA against PAM-induced apoptosis in exocrine pancreatic cells.
Go to :
 XML Download