

 PDF
PDF ePub
ePub Citation
 Print
Print


INTRODUCTION
Hypertension is one of the most important factors associated with development of vascular diseases. Complications of hypertension such as coronary heart disease, stroke, myocardial infarction, heart failure, and abnormal renal dynamics damage the cardiovascular system. The etiology of hypertension has been widely accepted as responsible for endothelial dysfunction [1].
Endothelial dysfunction can be observed during the early stages of hypertension [2]. Endothelial function is modulated by vasodilators and vasoconstrictors in vivo. It is well established that nitric oxide (NO) produced in vascular endothelial cells has a potent vasodilator effect [3-5] and plays an important role in vascular resistance and growth [6]. Administration of L-arginine analogues such as NG-nitro-L-arginine methyl ester hydrochloride (L-NAME) inhibits nitric oxide synthase (NOS) activity and hence NO biosynthesis, leading to hypertension [7-10]. Treating rats with L-NAME causes injury to the vascular endothelium, and this model is widely used to study hypertension, as well as cardiovascular and kidney disease [11]. L-NAME causes endothelium-dependent contraction in isolated arteries and inhibits endothelium-dependent relaxation to a variety of agonists [12]. As it is likely that drugs are most efficient for preventing and reversing early rather than late vascular alterations in hypertension, this model is suitable to test the vascular protective effects of antihypertensive drugs in the context of NO deficiency.
Lutein is abundant in egg yolks and dark-green leafy vegetables such as spinach and kale [13]. Once ingested, lutein is distributed to the retina and skin. Long-term oral intake of lutein elevates its level in serum [14,15] suggesting that constant intake from the diet causes the accumulation of lutein. In the blood, lutein is transported by lipoproteins with an even distribution among the different classes (i.e., low-density lipoprotein and high density lipoprotein) [16]. Lutein is more effective than carotene at inhibiting the autoxidation of cellular lipids and protecting against oxidant-induced cell damage [17]. The anti-inflammatory effect of lutein may be associated with inhibition of nuclear factor kappa B (NF-kB)-dependent expression of genes, such as cyclooxygenase-2 [18]. Additionally, lutein may help maintain heart health by reducing the risk for atherosclerosis [15,19].
Several studies have suggested that diet-derived antioxidants may help prevent and/or delay the progression of pathogenic pathways, modifying the risk for cardiovascular disease caused by oxidative damage to endothelial cells [20-22]. Although lutein has been anticipated to reduce oxidative stress and prevent inflammation more effectively than that of other carotenoids, no studies have been conducted about the antihypertensive effects of lutein in a rat model. Therefore, we evaluated the antihypertensive effects of orally administered lutein on chronic arterial hypertension induced by L-NAME in rats.
Go to : 
METHODS
Materials
Lutein was obtained from Arlico Pharm Co. (Seoul, Korea). L-NAME was purchased from Tokyo Chemical Industry Co. (Tokyo, Japan). N-1-Napthylethylenediamine dihydrochloride (NED), trichloroacetic acid, sodium dodecyl sulfate, butylated hydroxytoluene, thiobarbituric acid, 5,5'-dithiobis-2-nitrobenzoic acid, NADPH, reduced glutathione (GSH), glutathione reductase, and 5-sulfosalicylic acid dehydrate were purchased from Sigma Chemical Co. (St. Louis, MO, USA). Sulfanilamaide and nitrite standards were purchased from Promega Co. (Madison, WI, USA).
Animals
Male Sprague-Dawley rats (6~7 weeks, weight, 193±9.5 g) were used (seven rats/group). All animals were housed under constant temperature and exposed to a 12-h light-dark cycle. They were fed a standard chow diet (Orient Bio, Gapyeong, Korea). Animal protocols were approved by the ethics committee for the care and use of laboratory animals at Chung-Ang University. After 1 week of acclimatization, the animals were randomly divided into the following experimental groups. Rats in the normal control group received olive oil (carrier), whereas rats in the L-NAME-treated group were administered L-NAME (40 mg/kg/day, orally) for 3 weeks. Animals in the L-NAME-treated group were randomly assigned into four subgroups, consisting of (1) L-NAME group, a the vehicle control group that received olive oil; (2) the CoQ10 group, a comparison group that received Coenzyme Q10 (10 mg/kg/day, orally); (3) Lutein-0.5 group and (4) Lutein-2 group; treatment groups that received lutein (0.5 and 2 mg/kg/day, orally).
Measurement of blood pressure and heart rate
Rat blood pressure and heart rate were assessed every week by CODA, a computerized non-invasive blood pressure system (Kent Scientific, Torrington, CT, USA) which measures tail blood pressure by means of volume pressure. Rats were held in a restrainer on a preheated platform with the tail exposed, and both an occlusion cuff and a volume pressure-recording cuff were placed close to the base of the tail. The digital value for the systolic (SBP) and diastolic blood pressure (DBP) and heart rate were recorded. Readings were taken for 20 cycles from each rat, and the highest and the lowest values were excluded. To minimize stress-induced variations in blood pressure, all measurements were taken by the same person in the same peaceful environment at the same time of day.
Blood and tissue sampling
Rats were killed after being anesthetized with ethyl ether for blood and tissue sampling at the end of 3 weeks. Blood was collected from the interior vena cava into tubes containing anticoagulant. Blood samples were immediately centrifuged, and the plasma was stored at -80℃ until it was analyzed. Hearts and kidneys were collected and weighted.
Nitric oxide (NO) assay
The Griess Reagent System is based on the chemical reaction, which uses sulfanilamide and NED under acidic (phosphoric acid) conditions [23]. Accumulation of nitrite, used as index of nitric oxide synthase (NOS) activity, was measured in plasma samples using a Griess Reaction System kit (Promega, Madison, WI, USA).
Malondialdehyde (MDA) assay
MDA level was assessed as an index of lipid peroxidation according to a slightly modified method [24,25]. Briefly, reaction substrate consisting of 0.1 ml of 8.1% sodium dodecyl sulfate, 0.8 ml acetic acid buffer, 0.8 ml 0.8% thiobarbituric acid, and 0.2 ml distilled water was added to 0.1 ml of each sample and tetraethoxypropane as the standard. Then, all reaction mixtures were incubated at 100℃ for 1 h. After cooling on ice-water, 2 ml of n-butyl alcohol was added to the reaction mixtures, and the samples were centrifuged for 10 min at 3,000 g. The absorbance of the organic layer was measured at 532 nm.
Glutathione (GSH) assay
A GSH assay kit (Sigma) was used to measure the level of total glutathione. A 200 µl aliquot of plasma was added to 200 µl 5% 5-sulfosalicylic acid solution. Each sample was vortexed vigorously and incubated at 8℃ for 10 min. After centrifugation at 10,000 g for 10 minutes, the supernatants were collected. Serially diluted GSH standards and 10 µl aliquots of sample were pipetted into separate wells of a 96-well plate and 150 µl working mixture (100 mM potassium phosphate buffer, pH 7.0, with 1 mM EDTA, 6 units/ml glutathione reductase and 1.5 mg/ml DNTB) was added. After a 5 min incubation at room temperature, 50 µl NADPH (0.16 mg/ml) was added to each well, and optical densities were determined after 30 min at 405 nm.
Statistical analysis
Results are presented as mean±standard deviation and were analyzed with analysis of variance. Differences between groups were determined with the Newman-Keul's test. The level of significance was set at <5%.
Go to :
RESULTS
Changes in body weight
The body weights of rats were measured each week. At the beginning of the experiment, weights were similar to each other (192.6±9.5 g). As shown in Fig. 1A, a 153% normal increase in body weight was observed in the control group after 3 weeks. The rate of weight increase was reduced in the L-NAME group compared to that in the control group (Fig. 1A), which was significantly prevented by treatment with CoQ10 or lutein. The lutein-2 group showed the greatest ability to prevent the L-NAME-induced weight reduction (Fig. 1B).
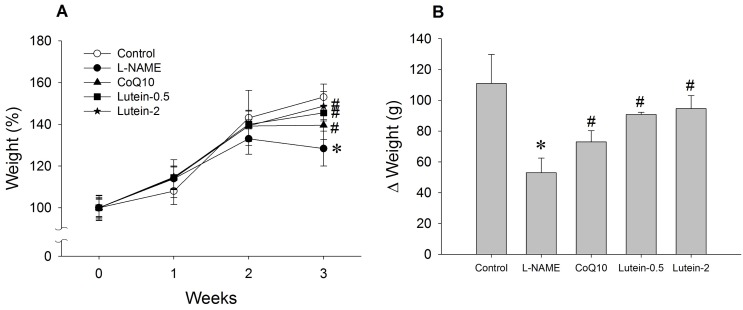 | Fig. 1Effect of lutein on the body weight in NG-nitro-L-arginine methyl ester hydrochloride (L-NAME)-induced hypertensive rats. (A) Weight (%), weight/initial weight. (B) Δ Weight (g), body weight on third week minus body weight on initial week. L-NAME rats fed 40 mg/kg L-NAME. L-NAME+CoQ10 rats fed L-NAME with 10 mg/kg coenzyme Q10. L-NAME+Lutein-0.5 rats fed L-NAME with 0.5 mg/kg lutein. L-NAME+Lutein-2 rats fed L-NAME with 2 mg/kg lutein. Results are expressed as mean±standard deviation of seven animals. *p<0.05 vs. normal control group, #p<0.05 vs. L-NAME control group.
|
Effect of lutein on blood pressure in L-NAME-induced hypertensive rats
Blood pressure of the rats was measured by the indirect tail-cuff method every week. As shown in Fig. 2A, baseline blood pressure values were similar between the groups at the beginning of the experiment. No significant differences were observed in mean arterial pressure (MAP) in the control group (116.6±9.5 to 114.2±8.4 mmHg) over the 3-week experimental period.
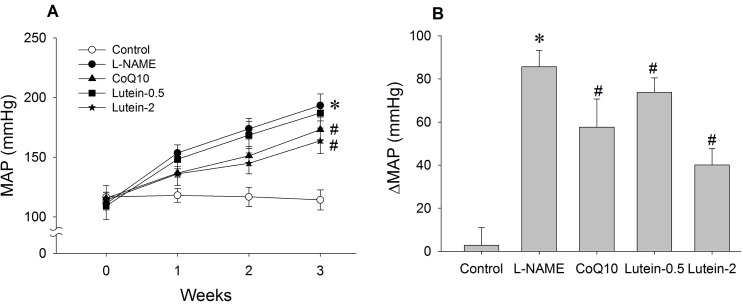 | Fig. 2Effect of lutein on mean arterial pressure (MAP) in NG-nitro-L-arginine methyl ester hydrochloride (L-NAME)-induced hypertensive rats. (A) Time-course effect of lutein on MAP over 3 weeks. (B) Change in MAP from initial to final week. L-NAME rats fed 40 mg/kg L-NAME. L-NAME+CoQ10 rats fed L-NAME with 10 mg/kg coenzyme Q10. L-NAME+Lutein-0.5 rats fed L-NAME with 0.5 mg/kg lutein. L-NAME+Lutein-2 rats fed L-NAME with 2 mg/kg lutein. Results are expressed as mean±standard deviation of seven animals. *p<0.05 vs. normal control group, #p<0.05 vs. L-NAME control group.
|
Daily oral administration of L-NAME (40 mg/kg) induced a rapid progressive increase in MAP (Fig. 2A). This increase was significant from the first week of treatment compared to that in the control and reached 193.3±9.6 mmHg at the end of treatment. MAP in the CoQ10 and lutein groups was significantly lower than that in the L-NAME group, indicating that both compounds prevented the increase in MAP. Moreover, lutein (2 mg/kg) appeared to be more effective than 10 mg/kg CoQ10 (Fig. 2B). Reductions in blood pressure in the lutein groups occurred in a dose-dependent manner (Fig. 2B). Similar results were observed for SBP and DBP of the L-NAME-induced hypertensive rats (Figs. 3 and 4).
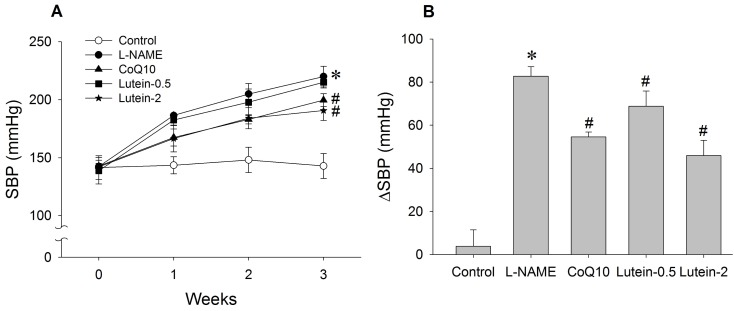 | Fig. 3Effect of lutein on systolic blood pressure (SBP) in NG-nitro-L-arginine methyl ester hydrochloride (L-NAME)-induced hypertensive rats. (A) Time-course effect of lutein on SBP for 3 weeks. (B) Change in SBP from initial week to final week. L-NAME rats fed 40 mg/kg L-NAME. L-NAME+CoQ10 rats fed L-NAME with 10 mg/kg coenzyme Q10. L-NAME+Lutein-0.5 rats fed L-NAME with 0.5 mg/kg lutein. L-NAME+Lutein-2 rats fed L-NAME with 2 mg/kg lutein. Results are expressed as mean±standard deviation of seven animals. *p<0.05 vs. normal control group, #p<0.05 vs. L-NAME control group.
|
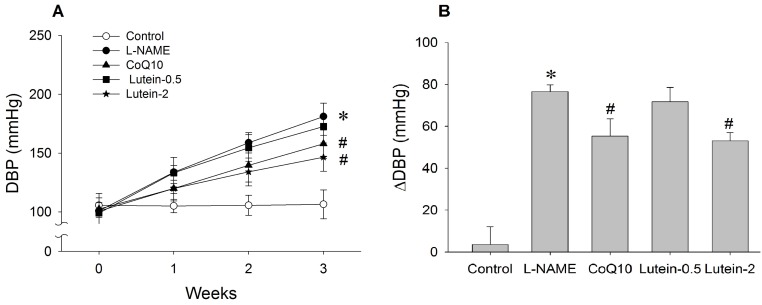 | Fig. 4Effect of lutein on diastolic blood pressure (DBP) in NG-nitro-L-arginine methyl ester hydrochloride (L-NAME)-induced hypertensive rats. (A) Time-course effect of lutein on DBP for 3 weeks. (B) Change in DBP from initial week to final week. L-NAME rats fed 40 mg/kg L-NAME. L-NAME+CoQ10 rats fed L-NAME with 10 mg/kg coenzyme Q10. L-NAME+Lutein-0.5 rats fed L-NAME with 0.5 mg/kg lutein. L-NAME+Lutein-2 rats fed L-NAME with 2 mg/kg lutein. Results are expressed as mean±standard deviation of seven animals. *p<0.05 vs. normal control group, #p<0.05 vs. L-NAME control group.
|
Effect of lutein on heart rate
The control group showed little change in heart rate over the 3 weeks, whereas L-NAME significantly reduced heart rate from 434±26 to 376±33 beats/min. Lutein (2 mg/kg) significantly prevented the reduction in heart rate induced by L-NAME (Fig. 5).
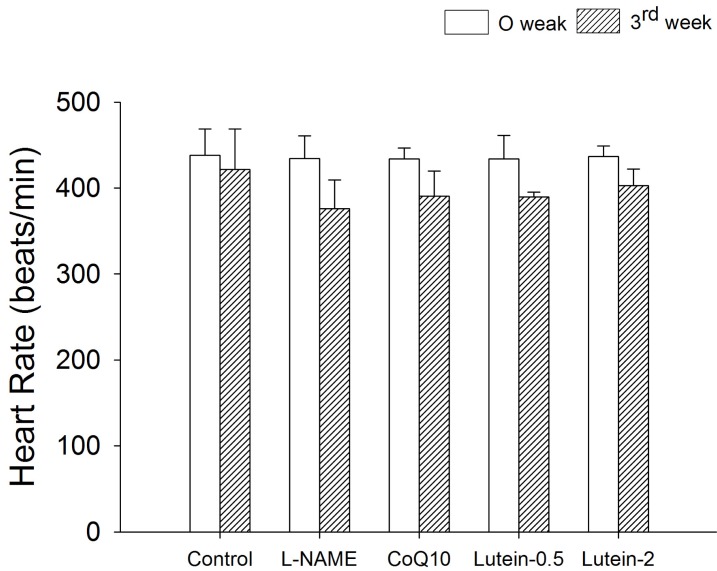 | Fig. 5Effect of lutein on heart rate in NG-nitro-L-arginine methyl ester hydrochloride (L-NAME)-induced hypertensive rats. L-NAME rats fed 40 mg/kg L-NAME. L-NAME+CoQ10 rats fed L-NAME with 10 mg/kg coenzyme Q10. L-NAME+Lutein-0.5 rats fed L-NAME with 0.5 mg/kg lutein. L-NAME+Lutein-2 rats fed L-NAME with 2 mg/kg lutein. Results are expressed as mean±standard deviation of seven animals. *p<0.05 vs. 0 week in the same group, #p<0.05 vs. L-NAME group at 3rd week.
|
Effect of lutein on the organ weight
Three-week treatment with L-NAME (40 mg/kg/day) caused cardiac hypertrophy (513.9±44.4 vs. 380.7±31.4 mg/100 g body weight [BW] in control). This effect was significantly prevented by lutein in a dose-dependent manner (Fig. 6A). Total kidney mass index increased significantly in the L-NAME group (762.8±39.5 vs. 667.7±41.1 mg/100 g BW in control). No significant preventative effects in L-NAME-induced renal hypertrophy were observed in the CoQ10 and lutein-0.5 groups. However, the lutein-2 group appeared to have a significantly reduced mass index (681.4±47.2 mg/100 g BW) compared to that in the L-NAME group (762.8±39.5 mg/100 g BW) (Fig. 6B).
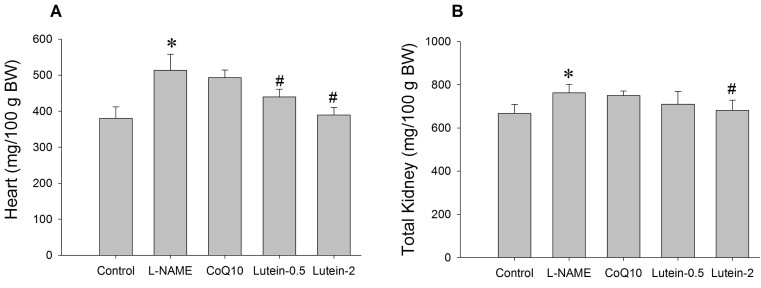 | Fig. 6Effect of lutein on the cardiac (A) and renal (B) hypertrophy in NG-nitro-L-arginine methyl ester hydrochloride (L-NAME)-induced hypertensive rats. L-NAME rats fed 40 mg/kg L-NAME. L-NAME+CoQ10 rats fed L-NAME with 10 mg/kg coenzyme Q10. L-NAME+Lutein-0.5 rats fed L-NAME with 0.5 mg/kg lutein. L-NAME+Lutein-2 rats fed L-NAME with 2 mg/kg lutein. Results are expressed as mean±standard deviation of seven animals. *p<0.05 vs. normal control group, #p<0.05 vs. L-NAME control group.
|
Effect of lutein on NO, lipid peroxidation, and GSH levels in plasma
Plasma nitrite concentrations in the experimental groups are shown in Fig. 7. Plasma nitrite concentration decreased significantly reduced in the L-NAME group when compared to that in the control as expected based on inhibition of NOS by L-NAME. The CoQ10 and lutein groups significantly restored plasma nitrite levels. A protective effect of decreasing plasma nitrite concentration in the lutein groups was found in a dose-dependent manner (Fig. 7).
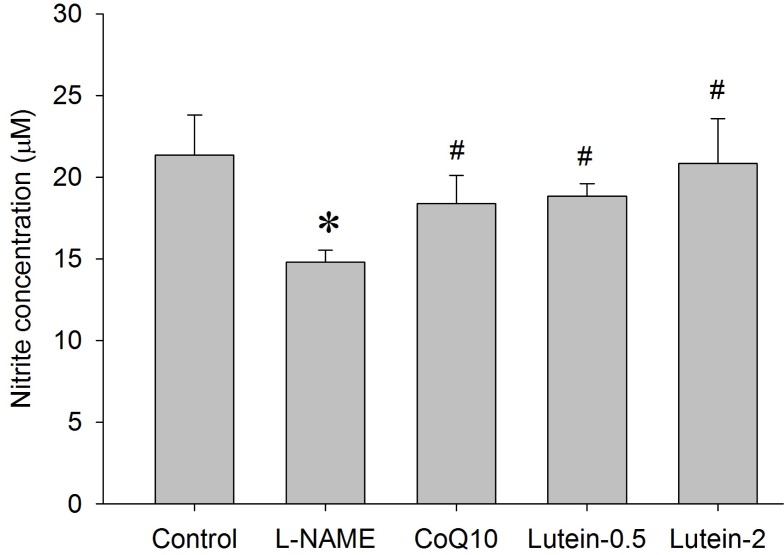 | Fig. 7Effects of lutein on plasma nitrite concentration in NG-nitro-L-arginine methyl ester hydrochloride (L-NAME)-induced hypertensive rats. L-NAME rats fed 40 mg/kg L-NAME. L-NAME+CoQ10 rats fed L-NAME with 10 mg/kg coenzyme Q10. L-NAME+Lutein-0.5 rats fed L-NAME with 0.5 mg/kg lutein. L-NAME+Lutein-2 rats fed L-NAME with 2 mg/kg lutein. Results are expressed as mean±standard deviation of seven animals. *p<0.05 vs. normal control group, #p<0.05 vs. L-NAME control group.
|
Lipid peroxidation level of plasma in rats receiving L-NAME increased four fold compared to that in the control. Administration of CoQ10 or lutein significantly decreased the levels of plasma MDA (Fig. 8). The anti-oxidative effect of lutein on lipid peroxidation appeared to be more potent than that of CoQ10 (Fig. 8).
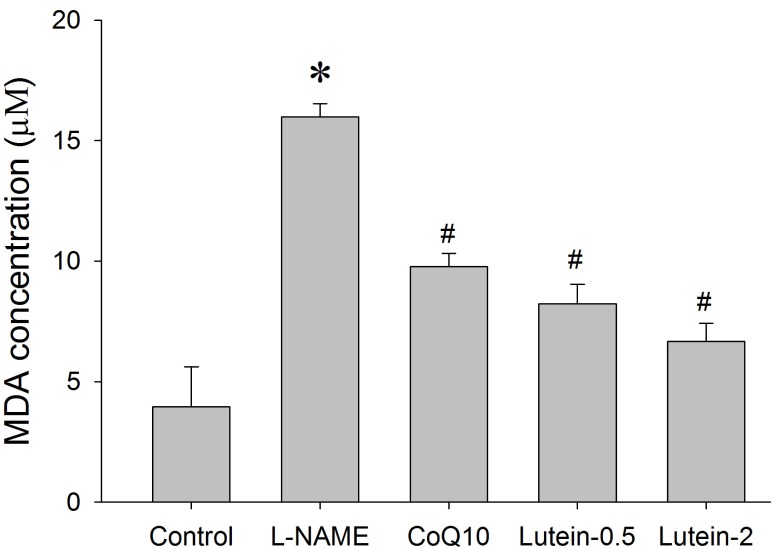 | Fig. 8Effect of lutein on the plasma malondialdehyde (MDA) concentration in NG-nitro-L-arginine methyl ester hydrochloride (L-NAME)-induced hypertensive rats. L-NAME rats fed 40 mg/kg L-NAME. L-NAME+CoQ10 rats fed L-NAME with 10 mg/kg coenzyme Q10. L-NAME+Lutein-0.5 rats fed L-NAME with 0.5 mg/kg lutein. L-NAME+Lutein-2 rats fed L-NAME with 2 mg/kg lutein. Results are expressed as mean±standard deviation of seven animals. *p<0.05 vs. normal control group, #p<0.05 vs. L-NAME control group.
|
Treatment with L-NAME induced a dramatic decrease in plasma GSH concentrations. This severe depletion of plasma GSH was prevented by CoQ10 and lutein. These results support the antioxidant properties of CoQ10 and lutein in a rat model of L-NAME-induced hypertension. A protective effect of decreasing plasma GSH level in lutein groups was found in a dose-dependent manner (Fig. 9).
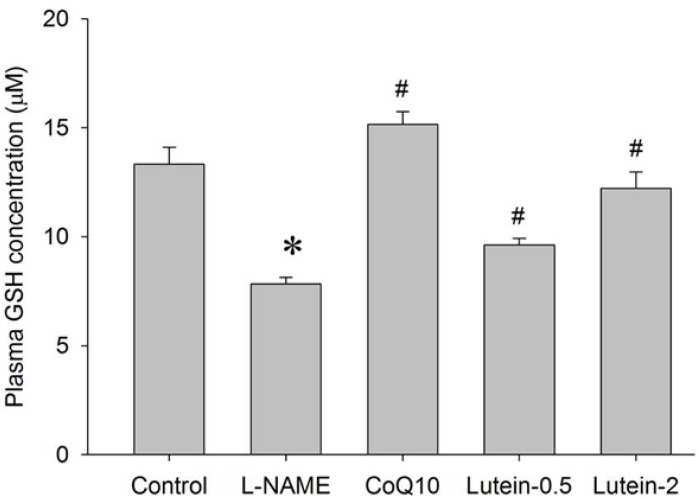 | Fig. 9Effect of lutein on the plasma glutathione (GSH) concentration in NG-nitro-L-arginine methyl ester hydrochloride (L-NAME)-induced hypertensive rats. L-NAME rats fed 40 mg/kg L-NAME. L-NAME+CoQ10 rats fed L-NAME with 10 mg/kg coenzyme Q10. L-NAME+Lutein-0.5 rats fed L-NAME with 0.5 mg/kg lutein. L-NAME+Lutein-2 rats fed L-NAME with 2 mg/kg lutein. Results are expressed as mean±standard deviation of seven animals. *p<0.05 vs. normal control group, #p<0.05 vs. L-NAME control group.
|
Go to :
DISCUSSION
We found that lutein effectively protected against cardiovascular damage in L-NAME-induced hypertensive rats. Chronic blockade of NO synthesis by L-NAME-mediated NOS inhibition is a well-known model of hypertension. Although this model cannot be easily extrapolated to human hypertension conditions, it provides the possibility of reducing the causes of increased blood pressure to a single factor, which is a decrease in NO bioavailability. Sufficient NO is associated with normal vasodilation and, consequently, normal blood pressure. Thus, a failure to generate NO or an enhanced NO consumption can lead to hypertension.
We confirmed that chronic administration of L-NAME leads to marked elevation in blood pressure as well as a lutein preventing effect in animals. The underlying mechanisms of lutein on the antihypertensive effect were investigated by considering that L-NAME treatment increases blood pressure by causing cardiac and renal hypertrophy, NO deficiency, and oxidative stress. In this manuscript, we failed to suggest the direct mechanisms of lutein or CoQ10 against hypertension. However, Hozawa et al. [26] suggest that individuals with higher concentrations of sum of carotenoids generally had lower risk for future hypertension. Several explanations of the ability of lutein to prevent L-NAME-induced hypertension on rats can be offered.
First, the increase in blood pressure was accompanied by enhanced cardiac and renal hypertrophy. In the presence of L-NAME, lutein restored the heart and kidney hypertrophy. It seemed that remodeling of the heart and the kidney was relatively dependent on blood pressure alteration in the L-NAME model. Increased blood pressure compared to that in the control may have represented a large enough afterload to provoke the development of cardiac hypertrophy. Additionally, NO-deficiency in the kidney may have led to vasoconstriction of the renal artery and stimulated renin and angiotensin II production with subsequent general vasoconstriction and hypertension [27]. We observed the inhibitory effect of lutein on L-NAME-induced cardiac and renal hypertrophy through blood pressure and organ weight results.
Second, the protective effect of lutein may be associated with NO deficiency. In this study, disruption of the NO pathway initiated by L-NAME resulted in a significantly reduced plasma nitrite concentration. The inhibition of NO production by L-NAME may have exaggerated the effect of reactive oxygen species (ROS) generated by vascular NADPH oxidase resulting in endothelial dysfunction [28]. Treatment with lutein, particularly at high doses, restored the inhibited NO production to resume its counter balance effect with ROS. Previous reports found a decrease in aortic endothelial nitric oxide synthase (eNOS) mRNA expression in L-NAME-treated rats [29,30]. Furthermore, a significant reduction in heart rate was observed in eNOS -/- mice in a previous report [31]. When we administered L-NAME to rats, we observed increased blood pressure and a decreased heart rate. These effects were significantly prevented by treatment with lutein. Several explanations are possible for the reduction in heart rate that is seen in the L-NAME rats. One possibility is that the baroreceptor reflex is (indirectly) reset as a consequence of the chronic increase in blood pressure. Supporting this explanation is the observation that rats lacking atrial natriuretic peptide have approximately equal increases in blood pressure but do not have heart rates that are statistically different from controls [32]. A second possibility is that NO produced by eNOS could play a direct role in the modulation of heart rate [31]. However we were unable to specify the exact cause of the reduced heart rate in L-NAME rats in the present study.
Third, the protective effect of lutein against L-NAME-induced hypertension may be associated with the antioxidant nature of carotenoids [33]. We observed higher MDA and lower GSH concentrations in plasma, which indicates a higher level of oxidative stress in L-NAME rats compared to that in controls. We also showed significant suppression of oxidant formation as indicated by the inhibited MDA levels, whereas the endogenous antioxidant GSH increased following lutein administration to L-NAME rats. The decreased reflection of lipo-oxidative damage end-products from the tissues to circulation and, thus, an underestimation of MDA is possible due to the expected impairment in microcirculation in L-NAME rats.
The effect of orally administering of lutein was tested at two doses (0.5 mg/kg and 2 mg/kg). Concurrent treatment with lutein partly prevented the development of L-NAME hypertension and cardiac and renal hypertrophy. The beneficial effect of lutein on L-NAME-induced vascular dysfunction is associated with preventing NOS inhibition, reducing oxidative stress and replenishing the antioxidant GSH with partial restoration of normal redox status. Moreover, lutein appeared to be more effective than CoQ10 for preventing hypertension and in the antioxidant parameters. Lutein prevents hypertension through various pathways including its influence on NO synthesis and enhancement of antioxidant properties. Given that lutein is present in several plants usually consumed by humans, it is feasible to develop diets rich in those plants to diminish blood pressure in patients with hypertensive. Additionally, our results may contribute to the ongoing intense search for the optimal antihypertensive therapy schemes with preventive effects on cardiovascular risk.
Go to :
 XML Download