

 PDF
PDF ePub
ePub Citation
 Print
Print


ABBREVIATIONS
CTGF
connective tissue growth factor
ECM
extracelluar matrix
VSMC
vascular smooth muscle cell
TGFβ
transforming growth factor β
Egr-1
early growth response-1
ERK1/2
extracellular signal regulated kinase 1/2
MAPK
mitogen activated protein kinase
FBS
fetal bovine serum
ECL
electrochemiluminescence
MTT
3-(4,5-dimethylthiazol-2yl)-2,5-diphenyltetrazolidium bromide
DMEM
Dulbecco's modified eagle's medium
SDS
sodium dodecyl sulfate
PBS
phosphate buffered saline
DMSO
dimethyl sulfoxide
PVDF
polyvinylidene difluoride
INTRODUCTION
Cardiovascular diseases, the leading cause of morbidity and mortality in the world, are a common complication of diabetes mellitus (DM). Hyperglycemia and hyperinsulinemia could increase inflammation and proliferation in the atherosclerotic lesions in coronary and cerebral arteries [1,2]. Elevated glucose concentration is known to activate a variety of cells to stimulate ECM synthesis [3,4], which is thought to be mediated by inducing TGFβ [5,6] and its downstream mediator connective tissue growth factor (CTGF) [7,8]. CTGF is upregulated by TGFβ as well as by the diabetic milieu, which is characterized by hyperglycemia and advanced glycation end products (AGEs) [9]. The TGFβ-Smad pathway is one of the important pathways responsible for regulating ECM production and fibrosis [10]. Non-canonical TGFβ signaling pathways, such as the ERK1/2 MAPK pathway also play a role in the development of fibrosis [11]. However, as TGFβ is also involved in important anti-inflammatory and anti-porliferative processes [12,13], inhibition of TGFβ is not an attractive therapy target for diabetic complication.
CTGF is a member of the CCN family (cysteine-rich angiogenic inducer 61, connective tissue growth factor, nephroblastoma overexpressed) of matricellular proteins, which plays an important role in vascular remodeling and in the development and progression of atherosclerosis [14,15]. Recent study demonstrate that TGFβ activate smad3 in medial smooth muscle cells, causing them to secret CTGF, which in turn stimulate adventitial fibroblasts to migrate, proliferate, produce collagen, and transform into myofibroblast [16]. High glucose has been known to stimulate CTGF expression in various cell types including renal mesangial cells [17] and fibroblasts [18]. However, there is a report about the direct effects of high glucose on ECM production synthesis and CTGF induction in VSMCs [19]. Furthermore, the signaling mechanism of CTGF induction and ECM production in VSMCs on hyperglycemia remain unclear.
With this background, the aims of this study were to test whether 1) CTGF regulates ECM production and VSMC proliferation in high glucose treated; 2) whether CTGF effects on ECM production and VSMC proliferation are through the ERK1/2 MAPK signaling in high glucose induced. Therefore our findings identify an important role for the ERK1/2MAPK signaling in the regulation of CTGF action.
Go to : 
METHODS
Materials
Dulbecco's modified Eagle's medium (DMEM), fetal bovine serum (FBS) and antibiotics (penicillin and streptomycin) were purchased from Gibco BRL (Rockville, MD, USA). D-glucose, anti-β-actin, 3-(4,5-dimethylthiazol-2yl)-2,5-diphenyltetrazolium bromide (MTT) were purchased from Sigma-Aldrich (St. Louis, MO, USA). Anti-CTGF, anti-TGF-β1, anti-fibronectin, goat anti-rabbit IgG, goat anti-mouse IgG, donkey anti-goat IgG, enhanced chemiluminescence (ECL), CTGF, Egr-1 and control siRNA were purchased from Santa Cruz Biotechnology (Santa Cruz, CA, USA). PD98059, U0126, SP600125 and SB203580 were purchased from Calbiochem (San Diego, CA, USA). ERK1/2 and control siRNA were purchased from Thermo Scientific Dharmacon (Chicago, IL, USA), Lipofectamine2000™ was purchased from Invitrogen (Carlsbad, CA, USA).
Rats
Male Spraque-Dawley rats weighing 200~250 g were used in this study. All experimental animals received autoclaved food and bedding such as to minimize exposure to viral or microbial pathogens. The rats were cared for in accordance with the Guide for the Care and Use of Experimental Animals of Yeungnam Medical Center.
Cell culture
Sprague-Dawley rats were anesthetized with pentobarbital (50 mg/kg). The thoracic aorta removed and cleaned of adhering fat and connective tissue, and thoracic aortic rings were prepared. The vascular endothelium was mechanically removed by rubbing gently with wooden stick to remove endothelium. VSMCs were processed using an 1 mm chop setting in a 100 mm culture dish, and cultured with 50% FBS-Dulbecco's modified eagle's medium (DMEM) with 1% antibiotics at 37℃ in a humidified atmosphere containing 5% CO2 for 7 days. The VSMCs were maintained in DMEM with 10% FBS and 1% antibiotic (penicillin 10,000 U/ml, streptomycin 10,000 µg/ml). We used VSMCs from passages 4 to 8 at 70~90% confluence in 10 cm dishes, and cell growth was arrested by incubation of the cells in serum-free DMEM for 24 hrs prior to use.
Cell proliferation assay
Cell numbers were determined after 24 or 48 hours of stimulation with 10% FBS using a hemocytometer, and cell viability were determined using the MTT assay. VSMC were seeded onto 24-well plates at a density of 1×10⁴ cells per well in DMEM supplemented with 10% FBS. After different treatments, 50 µl of 1 mg/ml MTT solution was added to each well (0.1 mg/well) and incubated for 4 hrs. The supernatants were then aspirated, and the formazan crystals were solubilized with 200 µl of dimethyl sulfoxide (DMSO). The supernatant (100 µl) of these solutions were placed in the wells of 96-well plates. The cell proliferations were determined using a microplate reader (Bio-Rad, Hercules, CA, USA) measuring absorbance at 570 nm.
Western blot analysis
Whole cell extracts were prepared by lysing cells in RIPA buffer protein extraction solution. Protein concentrations were quantified by the Bradford method. Briefly, equal amounts of protein were mixed with sodium dodecyl sulfate (SDS) sample buffer and incubated for 5 min at 100℃ before loading. Thirty micrograms of protein were loaded per lane and resolved by 6~10% SDS-PAGE for 1 hr and 30 min at 30 mA. The separated proteins were then transferred onto PVDF membranes for 1 hr at 30 mA using a Transfer Cell. The membranes were blocked with 5% nonfat milk in phosphate buffered saline (PBS) containing 0.05% Tween 20 (PBS-T) for 1 hr and 30 min at room temperature and then incubated with the primary antibodies at a dilution of 1:1,000 in 5% skim milk in PBS overnight at 4℃. The membrane were then washed with PBS-T and incubated with the secondary antibodies in 5% skim milk in PBS for 1 hr at room temperature. Finally, after rinses with the wash buffer, the membranes were exposed to ECL western blot analysis detection reagents.
Real-time quantitative RT-PCR analysis
The total RNA was isolated from the VSMCs using the RNeasy Mini Kit (Qiagen Inc., Valencia, CA, USA) according to the manufacturer's instructions. RT-PCR was performed using 1 µg of total RNA. The total RNA was reverse-transcribed using the Superscript III kit (Invitrogen, Carlsbad, CA, USA). The primer sequences were as follows: CTGF, forward (F) 5'-TCAGGCACCCTCATATAATC-3' and reverse (R) 5'-GACAATAGTCCACACCAGA-3'. Real-time PCR was performed using The QuantiTect SYBR Green PCR (Qiagen, Valencia, CA, USA) according to the manufacturer's instructions. Reaction volume was 20 µl and the annealing temperature was 57℃. Fluorescence was detected using ABI Prism 7700 (Biosystems, Foster City, CA) detection system. Ratios of target gene to GAPDH were calculated and compared in the presence or absence of high glucose.
Transfection of siRNA
The VSMCs were transfected with siRNA using Lipofectamine 2,000 reagent, according to the manufacturer's instructions. Aliquots of 1×10⁴ cells were plated onto 60-mm dishes 1 day before transfection and grown to about 70% confluence. The cells were then transfected with siRNA (10 nM CTGF, 50 nM ERK1/2, 30 nM Egr-1 or control) and 5 µl of lipofectamine for 6 hrs in Opti-MEM®I reduced serum medium (Invitrogen, Carlsbad, CA, USA), and incubated for 48 hrs. Protein levels were determined by western blot and cell proliferation by using an MTT assay.
Statistical analysis
Values are expressed as the mean±SEM. The significance of the difference from the respective controls for each experimental set was assayed by using the Student's t-test. And p value<0.05 was regarded as a significant difference.
Go to :
RESULTS
The effect of high glucose on the VSMC proliferation
We first confirmed that high glucose modulates the VSMC proliferation. VSMCs were treated with 5.55, 11.1 and 22.2 mM D-glucose respectively. After treatment 24 or 48 hours, VSMC proliferation determined using an MTT and cell counting assays. Our results are consistent other reports [19], which showing that VSMC proliferation up-regulated response to different glucose concentration (Fig. 1A). High glucose at 22.2 mM significantly increased VSMC proliferation compared with low glucose (5.55 mM) treated, and this concentration was chosen for subsequent experiments. To exclude the possibility that high glucose-induced CTGF expression was caused by increased osmolarity, we tested the effect of 22.2 mM mannitol on CTGF expression. Compared with cells in the low glucose medium, there was no significant stimulatory effect on CTGF expression in VSMCs incubated for 48 hrs in low glucose media containing 22.2 mM mannitol (data not shown).
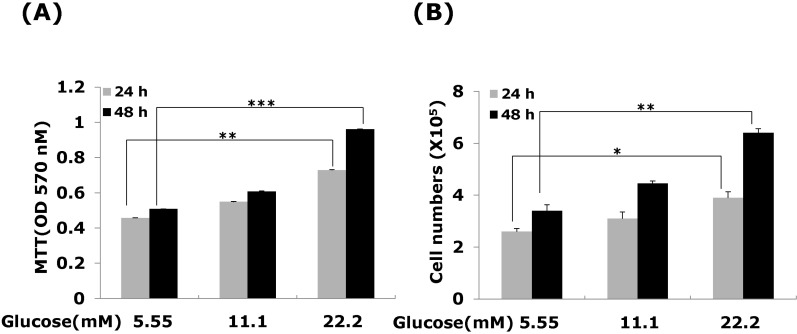 | Fig. 1Effects of high glucose on VSMC proliferation. Cells were treated with glucose concentration (5.55, 11.1 and 22.2 mM) for 24 or 48 hrs. VSMC proliferation was measured (A) MTT assay (B) cell counting assay. Results are represented as the mean± S.E.M (n=4). *p<0.05 compared with 5.55 mM glucose, **p<0.01 compared with 5.55 mM glucose and ***p<0.001 compared with 5.55 mM glucose.
|
Effects of high glucose on CTGF, TGF-β1, and ECM components mRNA and protein expressions in VSMCs
To determine whether high glucose modulates the expression of CTGF mRNA and protein, cells were treated 22.2 mM glucose for 24 or 48 hours. Our results showed that high glucose significantly induced the levels of CTGF mRNA and protein expression compared to the low glucose in VSMCs (Fig. 2A, B). Under serum-starvation condition, growth-arrested VSMCs expressed very low level of CTGF expression (Fig. 2B). Total cellular CTGF protein levels of CTGF protein increased in 24 hours and then sustained the levels to 48 hours in VSMCs, whereas, the levels of TGF-β1 protein expressed in low glucose treated, and then the level of TGF-β1 expression elevated at 24 hrs and lasted up to 48 hrs after treatment (Fig. 2B). Moreover, the levels of collagen type I, collagen type III and fibronectin mRNA and protein were slightly increased at 24 hrs, and peaked at 48 hours post-treatment (Fig. 2D). These results showed that high glucose induces both CTGF and TGF-β1 expression, and then ECM components production in VSMCs.
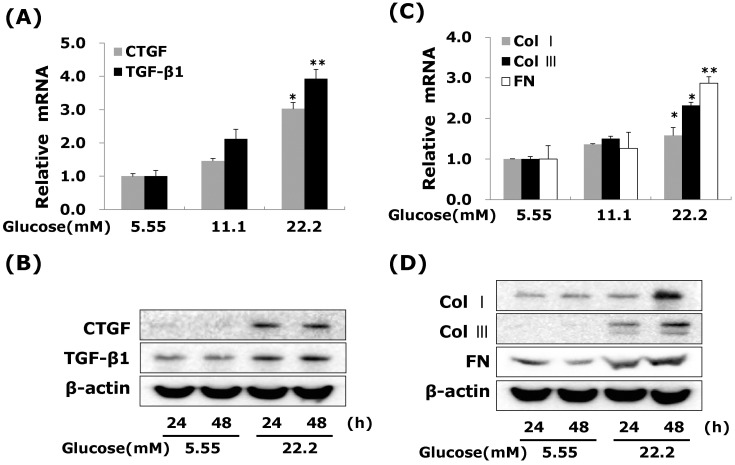 | Fig. 2High glucose increases CTGF, TGFβ1, and ECM components mRNA and protein expressions in VSMCs. Cells were treated with glucose concentration (5.55, 11.1 and 22.2 mM) for 24hrs or 48 hrs. After 24 hrs, CTGF, TGF-β1 (A) and ECM components mRNA (C) were measured by real-time PCR. After 24 or 48 hrs, CTGF, TGF-β1 (B) and ECM components protein expression (D) were detected by western blot. Results are represented as the mean±S.E.M (n=4). *p<0.05 compared with 5.55 mM glucose, **p<0.001 compared with 5.55 mM glucose.
|
Effects of CTGF on high glucose-induced ECM accumulation and proliferation in VSMCs
Next, to determine the role of CTGF, we knocked down CTGF expression using adenoviral-delivered CTGF siRNA in high glucose-stimulated VSMCs. Transfection with CTGF siRNA efficiently suppressed the CTGF protein expression compared to the levels of the scrambled siRNA treated in high glucose-induced VSMCs (Fig. 3A), and depletion of CTGF completely inhibited high glucose-induced VSMC proliferation (Fig. 3B). In addition, transfection with CTGF siRNA significantly inhibited collagen type I, collagen type III, and fibronectin mRNA expression in high glucose-stimulated VSMCs (Fig. 3C), and depletion of CTGF efficiently suppressed the high glucose-stimulated the levels of ECM components protein (Fig. 3D). These results indicated that CTGF are most important role on ECM accumulation and proliferation in high glucose-stimulated VSMCs.
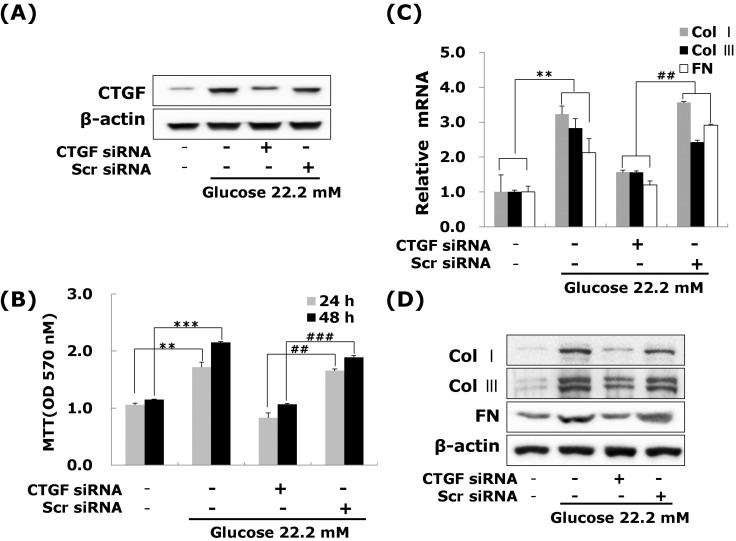 | Fig. 3Effects of CTGF on high glucose-induced proliferation, ECM components mRNA and protein expression in VSMCs. Cells were transfected with CTGF siRNA and then treated with 5.55 or 22.2 mM of glucose. After treatment, CTGF protein expression measured by western blot (A) and cell proliferation measured by an MTT assay (B) Collagen type I, Collagen type III, and fibronectin mRNA levels measured by real-time PCR (C) and protein expression were measured by western blot (D). Results are represented as the mean±S.E.M (n=4). **p<0.01 compared 5.55 mM glucose, ***p<0.001 compared with 5.55 mM glucose, ##p<0.01 compared with 22.2 mM glucose, ###p<0.001 compared with 22.2 mM glucose.
|
Effects of ERK1/2 MAP kinase on high glucose-induced CTGF in VSMCs
A significant body of evidence has implicated MAPK in the regulation of cell proliferation and contractility [20]. To assess whether the decrease in cell proliferation was mediated by MAP kinase signaling, we examined the effects of MAPK inhibitors; specific MEK1/2 inhibitors PD98059 or U0126, c-Jun N-terminal kinase inhibitor SP600125, and an inhibitor of p38 MAPK SB203580 on the cell proliferation and ECM components accumulation in high glucose-induced VSMCs. The MEK1/2 inhibitors PD98059 or U0126 efficiently inhibited high glucose-induced VSMC proliferation. However, SP600125 and SB203580 had no inhibitory effect on high glucose-induced VSMC proliferation (Fig. 4B). In addition, MEK1/2 inhibitors inhibited the levels of CTGF expression and collagen type I, collagen type III, and fibronectin accumulation in high glucose-induced VSMCs (Fig. 4A, 4C). To confirm the effect of ERK1/2 MAP kinase, we transfected with adenoviral-delivered ERK1/2 siRNA in high glucose stimulated VSMCs. ERK1/2 siRNA completely inhibited high glucose-induced CTGF stimulation, cell proliferation and ECM accumulation (Fig. 5). These results indicated that high glucose induced CTGF expression resulted in ECM accumulation and cell proliferation via ERK1/2 MAPK signaling in VSMCs.
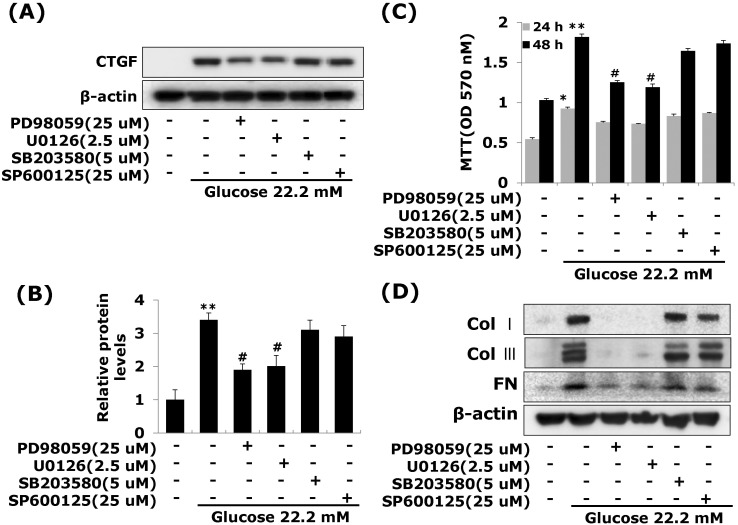 | Fig. 4Effects of MAP Kinase inhibitors on high glucose-stimulated CTGF, ECM accumulation and proliferation in VSMCs. Cells were treated with PD98059 (25 µM), U0126 (2.5 µM), SB203580 (5 µM) and SP600125 (25 µM) and then treated with 5.55 or 22.2 mM of glucose. After treatment, CTGF protein expression measured by western blot (A, B) and cell proliferation measured by an MTT assay (C) Collagen type I, Collagen type III, and fibronectin protein expression were measured by western blot (D). Results are represented as the mean±S.E.M (n=4). *p<0.05 compared with 5.55 mM glucose, **p<0.001 compared with 5.55 mM glucose, #p<0.05 compared with 22.2 mM glucose.
|
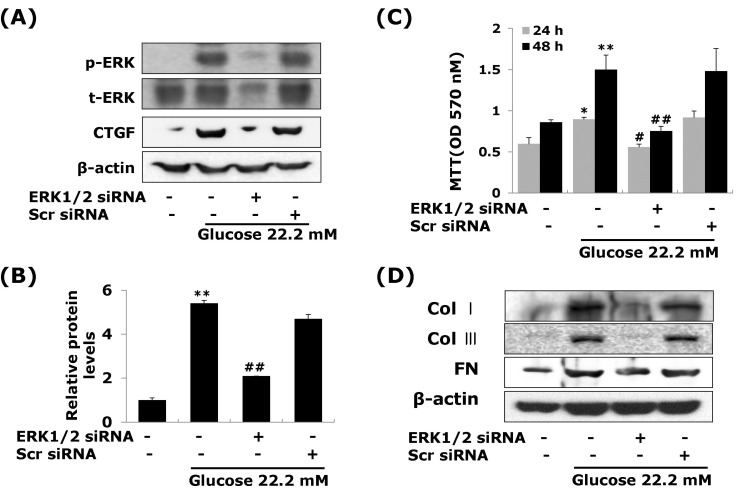 | Fig. 5ERK1/2 siRNA transfection reduces high glucose-induced CTGF, ECM protein expression and cell proliferation in VSMCs. Cells were transfected with CTGF siRNA and then treated with 5.55 or 22.2 mM of glucose. After treatment, CTGF protein expression measured by western blot (A, B) and cell proliferation measured by an MTT assay (C) Collagen type I, Collagen type III, and fibronectin protein expression were measured by western blot (D). Results are represented as the mean±S.E.M (n=4). *p<0.05 compared with 5.55 mM glucose, **p<0.001 compared with 5.55 mM glucose, #p<0.05 compared with 22.2 mM glucose, ##p<0.001 compared with 22.2 mM glucose.
|
Egr-1 regulated by ERK1/2 MAPK signaling in high glucose-induced VSMCs
We also examined Egr-1, transcription factor, regulated by ERK1/2 MAPK signaling in high glucose-induced VSMCs. VSMCs were treated with 22.2 mM glucose, and protein isolated from 60 to 120 min. The induction of Egr-1 expression was peaked at 90 min after treatment, and then declined (Fig. 6A). We therefore investigated whether ERK 1/2 MAPK signaling was involved in high glucose-induced Egr-1 expression. To block ERK1/2 MAPK actions, we used MEK1/2 inhibitor, PD98059 or U0126. Figure 6 show that the MEK1/2 inhibitors efficiently inhibited Egr-1 expression under high glucose-induced VSMCs (Fig. 6B). To examine a role of CTGF in high glucose-induced Egr-1 expression, we treated recombinant CTGF protein. Egr-1-si-RNA significantly inhibited high glucose-induced Egr-1 gene expression and reversed the level of Egr-1 by recombinant of CTGF (Fig. 6C). These results demonstrate that Egr-1 is a downstream of ERK1/2 MAPK signaling in high-glucose-induced VSMC.
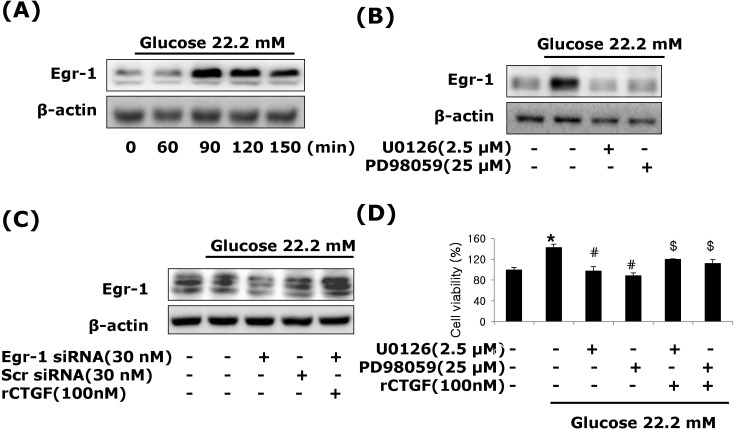 | Fig. 6CTGF regulated by Egr-1 through ERK1/2 MAPK signaling in high glucose-induced VSMCs. Treatment with high glucose of 22.2 mM, Egr-1 protein expression (A, B), pretreatment with PD98059 (25 µM), U0126 (2.5 µM) (C), transfection with Egr-1 or control siRNA and recombinant CTGF treatment (D) were measured by western blot. Pretreatment with PD98059 (25 µM), U0126 (2.5 µM) and CTGF treatment in high glucose of 22.2 mM analyzed by MTT assay. Results are represented as the mean±S.E.M (n=4). *p<0.01 compared with 5.55 mM glucose, #p<0.01 compared with 22.2 mM glucose, $p<0.01 compared with 22.2 mM glucose plus MEK1/2 inhibitor.
|
Go to :
DISCUSSION
In the present study, we demonstrate that CTGF is a powerful regulator of vascular fibrosis under hyperglycemia. The major finding of this study is that high glucose increases the levels of CTGF mRNA and protein in VSMCs (Fig. 2) and deletion of CTGF with adenoviral delivered siRNA results in the inhibition of high glucose-induced VSMC proliferation (Fig. 2). These observations establish a pivotal role of CTGF in mediating high glucose-induced excessive VSMC proliferation and suggest that inhibition of CTGF may be useful for preventing abnormal VSMCs growth in diabetic vessels.
Some studies have showed that high glucose may mediate diabetic renal and macrovascular complications by stimulating ECM production [21], and the increased ECM synthesis accounts mainly for intimal plague formation in the atherosclerotic lesions in diabetic vessels, so the effect of blocking CTGF action on ECM expression was further examined in this study. By CTGF-specific siRNA, our results demonstrate that knockdown of CTGF expression prevents ECM accumulation in VSMCs, indicating that CTGF plays an important role in mediating ECM production in VSMCs in response to high glucose.
In addition to increased ECM deposition in VSMCs, it has been recognized that VSMC proliferation within the vessel wall is another critical pathogenic feature in the development of atherosclerosis. Glucose metabolism has been implicated to play an important role in this cellular mechanism [1]. Neointimal formation, the leading cause of restenosis, is also caused by proliferation of VSMCs. Patients with diabetes mellitus have higher restenosis rates after coronary angioplasty than non-diabetic patients. Enhanced proliferation of VSMCs has also been demonstrated in diabetic experimental animal models [22]. In addition, cultured VSMCs grown in media with high glucose concentration have exhibited increased cell proliferation [19]. Consistent with previous reports, our observations establish an important role of CTGF in mediating abnormal VSMCs growth result in ECM accumulation in response to high glucose and suggest that deletion of CTGF prevents development of atherosclerosis and restenosis by the stimulation of ECM production in diabetic vessels.
CTGF was first identified as a 38-kDa cysteine-rich protein, which can be specifically induced by TGFβ. It is found that CTGF is expressed abundantly in atherosclerotic blood vessel, but only marginally in normal vascular tissues [15]. Jian et al. have suggested a role for CTGF in the vein graft remodeling [23]. These authors found that increased intramural wall stress following vein graft implantation resulted in an up-regulation of both TGFβ and CTGF levels were inversely correlated with the magnitude of outward remodeling of the vein graft. Some report have showed that CTGF stimulates both intimal hyperplasis and adaptive remodeling is of interest and speculate that the expanded intimal hyperplasia in CTGF-treated arteries is, in part, caused by myoblast migration into the neointima [23]. It is also possible that exogenous CTGF may diffuse from the adventitia to the media and directly affect medial SMCs. CTGF has been reported to directly stimulate vascular SMC proliferation in vitro [24,25].
Several intracellular signals elicited by high glucose are responsible for VSMC proliferation, including increased expression of TGFβ receptor type II [26], enhanced intracellular reactive oxygen species (ROS) production [27], and suppressed apoptosis through PI-3K and ERK1/2 pathways [28]. It is found that CTGF has been shown previously to activate ERK1/2 MAPK [29]. It has been recently suggested that the ERK/p30 MAPK pathway is responsible for advanced glycation end products (AGE)-induced early activation of Smad3 and CTGF expression in tubular epithelial cells [30]. Liu et al. have found that IL-13 rapidly induced activation of ERK1/2, but not p-p38, in hepatic stellate cells (HSCs), and blockade of ERK1/2 by U0126 reduced IL-13-dependent early smad1/2 phosphorylation and CTGF expression, but did not interfere with later stage Smad signaling, indicating a complex cross talk between ALK/Smad signaling and the ERK1/2 MAPK pathway [31]. We previously reported that IGFBP-5 induces excessive proliferation through ERK1/2 MAPK pathway [32]. Activation of ERK1/2 MAPK plays an important role in the accumulation of Egr-1 in the nucleus [33]. We have shown that high glucose induces CTGF via activation of ERK1/2MAPK signaling and Egr-1 (Fig. 5 and 6). We first demonstrated that knockdown of ERK1/2 MAPK prevents CTGF induction resulted in ECM accumulation and VSMC proliferation in high glucose-induced VSMCs. Furthermore, we demonstrate that Egr-1 is a downstream of ERK1/2 MAPK pathway and CTGF rescues the expression of Egr-1 under hyperglycemia via ERK1/2 MAPK signaling.
In conclusions, ECM production and proliferation induced in rat VSMCs in response of high glucose, this induction requires CTGF induction. Furthermore, we have identified ERK1/2 MAPK activation and Egr-1 expression as mechanisms mediating CTGF induced fibrosis. Taken together, our findings provide new insights to understanding the molecular mechanism of CTGF dependent fibrosis in diabetic vascular.
Go to :
 XML Download