

 PDF
PDF ePub
ePub Citation
 Print
Print


INTRODUCTION
Retinitis pigmentosa (RP) is a group of retinal dystrophies characterized by photoreceptor abnormalities progressing to denudation of the sensory receptor layers of the retina. This leads to a progressive and irreversible loss of vision - characterized initially by tunnel vision. As one of the most frequently seen retinal dystrophies, RP is the leading cause of blindness in adults with an estimated incidence of 1 in 3,500~4,500 human births [1,2].
There are several animal models of RP [3-5]. Perhaps the best characterized of these is the rd1 mouse model with a point mutation in the β subunit of the cGMP phosphodiesterase (β-PDE) gene (Pde6β) manifesting as massive loss of photoreceptors. While the rd1 has been, and remains, an excellent model of RP, the rapid onset and pace of photoreceptor degeneration (Postnatal day15~20), provides a limited window of opportunity for interventional studies that seek to limit the degeneration or rescue retinal function. More recently, the rd10 mouse model was developed which carries a mutation on the same gene as the rd1 but crucially presents with a later onset and slower pace of retinal degeneration [4]. Since our group studies therapeutic modalities for RP [6-8], we are adopting the rd10 mouse model. To establish an optimal time frame for our studies using this model, we have used established electrophysiological and histologic methods to confirm the time course of retinal degeneration in rd10 mice.
Electroretinography (ERG) has been used as a reliable diagnostic tool for the evaluation of retinal function in both the laboratory and the clinic. It is commonly used to diagnose retinal disorders before cataract extraction or in cases of unexplained visual loss without ophthalmoscopic abnormalities [9]. Essentially, when a surface electrode is placed on the front of the eyeball and a light is shone through the pupil, distinct electrical potentials are recorded which reflect the electrical activity in the retina in response to photic stimulation [10]. The ERG is largely composed of a negative-going a-wave generated by rod photocurrents [11], and a positive-going b-wave arising from bipolar cell or Müller cell activity [12-17]. In RP patients the ERG becomes undetectable [1,2].
Here, in this paper, we show that in rd10 mice, the peak period of retinal degeneration (photoreceptor loss), is during postnatal week 3 (PW3) to PW4. This finding is important for our group to establish the optimal times for our interventional studies using this mouse model of RP.
Go to : 
METHODS
Animals
Wild-type (C57BL/6J strain) and rd10 (B6.CXB1-Pde6brd10/J) mice from the Jackson Laboratories (BarHarbor, ME, USA) were used for this experiment. Animal use protocols were approved by the institutional animal care committee of Chungbuk National University (approval number: CBNURA-042-0902-1).
In-vivo ERG recording
ERG recordings were carried out on 23 rd10 (B6.CXB1-Pde6b/J) and 26 wild-type (C57BL/6J) mice between postnatal age 3 to 5 weeks. Mice were dark-adapted for at least one hour before the experiments and were then anesthetized with an intraperitoneal injection of 0.05 ml of a solution containing tiletamine (25 g/l), zolazepam (25 g/l), xylazine hydrochloride (23.32 g/l) and heparin sodium (5,000 I.U.). Pupillary dilatation was achieved by topical application of a tropicamide 0.5%/phenylephrine hydrochloride 0.5% eye drop. ERG recording was commenced after 30 minutes under anaesthesia.
To record ERGs, we used a turnkey system (HMsERG from Retvet Corp., Columbia, MO, USA), which has the appropriate electrodes and a mini-Ganzfeld stimulator (diameter: 55 mm) appropriate for small animal ERG recording. The ground and reference electrodes which are needle-formed were attached to the abdomen near the right hindlimb and the forehead, respectively. The contact lensshaped eye electrode was positioned on the cornea with a thin layer of methylcellulose gel (Genteal™, Novartis, New York, NY, USA), to ensure electrical contact and to maintain corneal adherence. Before ERGs were recorded, impedance and baseline tests were performed; the latter for evaluating the noise level in the environment.
All experiments were performed under dim red light in a dark room. ERG recordings were performed under two conditions: scotopic/dark-adapted (3 cd·s/m2, 10 cd·s/m2 with no background light); and photopic/light-adapted (3 cd·s/m2 following background light 30 cd·s/m2 for 10 minutes). For dark-adapted responses to 3 cd·s/m2, 4 stimuli were delivered at 10 sec intervals and the 4 responses were computer-averaged to give the waveforms. For the dark-adapted responses to 10 cd·s/m2, the 20 sec inter stimulus intervals were used. Following the dark-adapted stimulation, light-adapted responses were obtained for 3 cd·s/m2 stimulation following 10 min of exposure to background light of 30 cd·s/m2 intensity to allow for complete light adaptation. Responses to 32 stimuli delivered at 0.5 sec intervals were computer-averaged to give the waveform for the light-adapted response. All ERGs were recorded for 200 ms which includes 20 ms before and 180 ms after the light stimulus. Each stimulus protocol (dark-adapted at 3 cd·s/m2 and 10 cd·s/m2; plus light-adapted), was repeated 5 times for each mouse.
Analysis of ERG recordings
The ERG is composed of an initial negative component (a-wave) and subsequent positive peak (b-wave) evoked by light stimulation. The a-wave represents photoreceptor response while the b-wave represents activities of bipolar cells or Müller cells. The a-wave amplitude was measured from the baseline to the a-wave trough, and the b-wave amplitude was measured from the a-wave trough to the b-wave peak. The a-wave and b-wave implicit times were measured from the stimulus onset to the a-wave trough and b-wave peak, respectively (Fig. 1). The mean and standard deviation (S.D.) of a-wave and b-wave amplitudes, and implicit times were calculated, and student t-test and one-way analysis of variance (ANOVA) were used for statistical analysis.
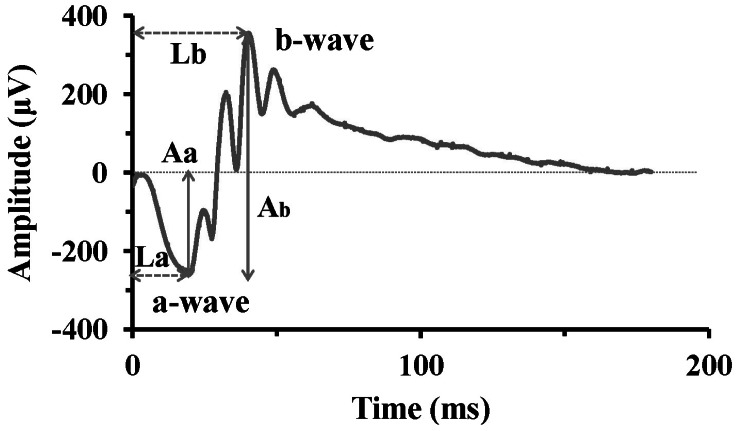 | Fig. 1Typical ERG waveform. The initial negative component, a-wave represents photoreceptor response, while the b-wave, positive peak following the a-wave, represents activities of bipolar cells or Müller cells. The a-wave amplitude (Aa) is measured from the baseline to the a-wave trough, and the b-wave amplitude (Ab) from the a-wave trough to the b-wave peak. The implicit time of a-wave (La) and b-wave (Lb) is measured from the stimulus onset to the a-wave trough and b-wave peak, respectively.
|
Ex-vivo retinal preparation
At each postnatal week (PW) of 2, 2.5, 3, 3.5, 4, and 4.5, three rd10 mice were used for ex-vivo retinal preparation. After anesthesia (same method with ERG recording preparation), the retinal patches were prepared following the method of Stett et al. [18]. Briefly, the eyeball was enucleated, and then, the retina was isolated and cut to the patches of ~3×3 mm sizes. The retinal patches were carried out under moderate illumination in an artificial cerebrospinal fluid (ACSF) solution (124 mM NaCl, 10 mM Glucose, 1.15 mM KH2PO4, 25 mM NaHCO3, 1.15 mM MgSO4, 2.5 mM CaCl2, and 5 mM KCl) bubbled with 95% O2+5% CO2 with a pH of 7.3~7.4 and a temperature of 32℃ and then mounted onto a planar microelectrode array (MEA). The retinal patches were placed ganglion cell layer down onto the MEA.
Electrode and data recording system for ex-vivo recording
The data acquisition system (MEA60 system; Multi Channel Systems GmbH, Reutlingen, Germany) included planar MEA, stimulator (STG1004), amplifier (MEA1060), temperature control units, data acquisition hardware (Mc_Card) and software (Mc_Rack). The MEA contained 64 circular-shaped electrodes in an 8×8 grid layout with electrode diameters of 30 µm and inter-electrode distances of 200 µm and coated with porous titanium nitride (TiN) to minimize electrical impedance. The four electrodes at the vertices were inactive. Multi-electrode recordings of the retinal activity were obtained from 60 electrode channels with a bandwidth ranging from 10 to 3,000 Hz at a gain of 1,200. The data sampling rate was 25 kHz/channel. From the raw waveform of retinal recording, retinal ganglion cell (RGC) spikes and local field potential were isolated by using 100 Hz high-pass filter and 50 Hz low-pass filter, respectively. No light or electric stimulation was applied for this experiment and the spontaneous retinal activity was recorded.
MEA data analysis
Stored data were processed off-line by a spike sorting software (Offline Sorter™) to transform the waveforms containing multiunit activities into multiple single unit spike trains. The spontaneous mean firing rate for each recorded cell was computed as the total number of spikes divided by the length of the recording period. Mean±standard error of the mean (SEM) are presented for the mean firing rate.
Since the strength of neural oscillations are defined in frequency domains on the basis of peaks in the power spectrum, Fourier transform estimated by Burg algorithm [19] was performed for detection of the frequency of local field potential (LFP) with Matlab™ (The Mathworks, Inc., Natick, MA, USA).
Retinal tissue preparation for staining
Enucleated eyes from euthanized rd10 mice of different postnatal ages were placed in phosphate-buffered saline (PBS; 0.1 M, pH 7.4). Following removal of the cornea, lens, and vitreous body, the eyecup was fixed in 4% paraformaldehyde for 6 hours at 4℃. The tissues were then washed three times in cold PBS and cryoprotected by infiltration with 30% sucrose solutions overnight. The tissues were embedded and frozen with liquid nitrogen. Tissue specimens were cut into 10 µm vertical sections to the surface of the retina on a cryostat (CM3050S, Leica, Germany). Cryosectioned tissues were used for cresyl violet and TUNEL staining.
Cresyl violet and TUNEL staining
To examine the histological changes of the retina, a cresyl violet staining was performed. The sections were rinsed in distilled water and stained in 0.1% (w/v) cresyl violet solution for 2~5 minutes. The stained sections were quickly rinsed in distilled water. Next, the sections were dehydrated in alcohol series and cleared in xylene. The sections were mounted with a mounting medium (Richard-Allan Scientific, USA).
To examine dying cells of the rd10 retina, the terminal deoxyuridine triphosphate nick-end labeling (TUNEL) staining was performed using the in situ cell death detection kit (Roche Applied Science, Germany) following the manufacturer's instructions. The sections were mounted with Fluorogel (Electron Microscopy Sciences, USA) and observed with a multipurpose microscopy (DMLB, Leica, Germany) including a digital camera (Macrofire, USA). Images of seven areas (100 µm length) were obtained in each retinal section (n=3~5). The number of TUNEL stained cells was counted from obtained images. Data were presented as the mean±standard error of mean (SEM). The statistical differences between PW2 and PW3, 4, 5, 8 were analysed by a Student's t-test using the Prism 4 program (GraphPad, USA). p<0.05 was defined as statistical significance.
Go to :
RESULTS
Comparison of ERG waveforms in wt mice and rd10 mice
ERG responses to light flashes of scotopic (3 cd·s/m2, 10 cd·s/m2) and photopic 3 cd·s/m2 from PW4 (or PW3.5) wt mice and PW3 and PW4 rd10 mice are illustrated in Fig. 2. The series of ERG waveforms recorded in response to increasing light intensities under scotopic and photopic conditions show increase in amplitude of the a-wave and b-wave. At the same light intensities, responses of the rd10 mice are delayed and reduced in amplitude compared with those of the wt mice. Furthermore, ERGs recorded from PW4 rd10 mice showed reduced responses compared to PW3 rd10 mice. The a-wave is hardly detectable in PW4 rd10 mice.
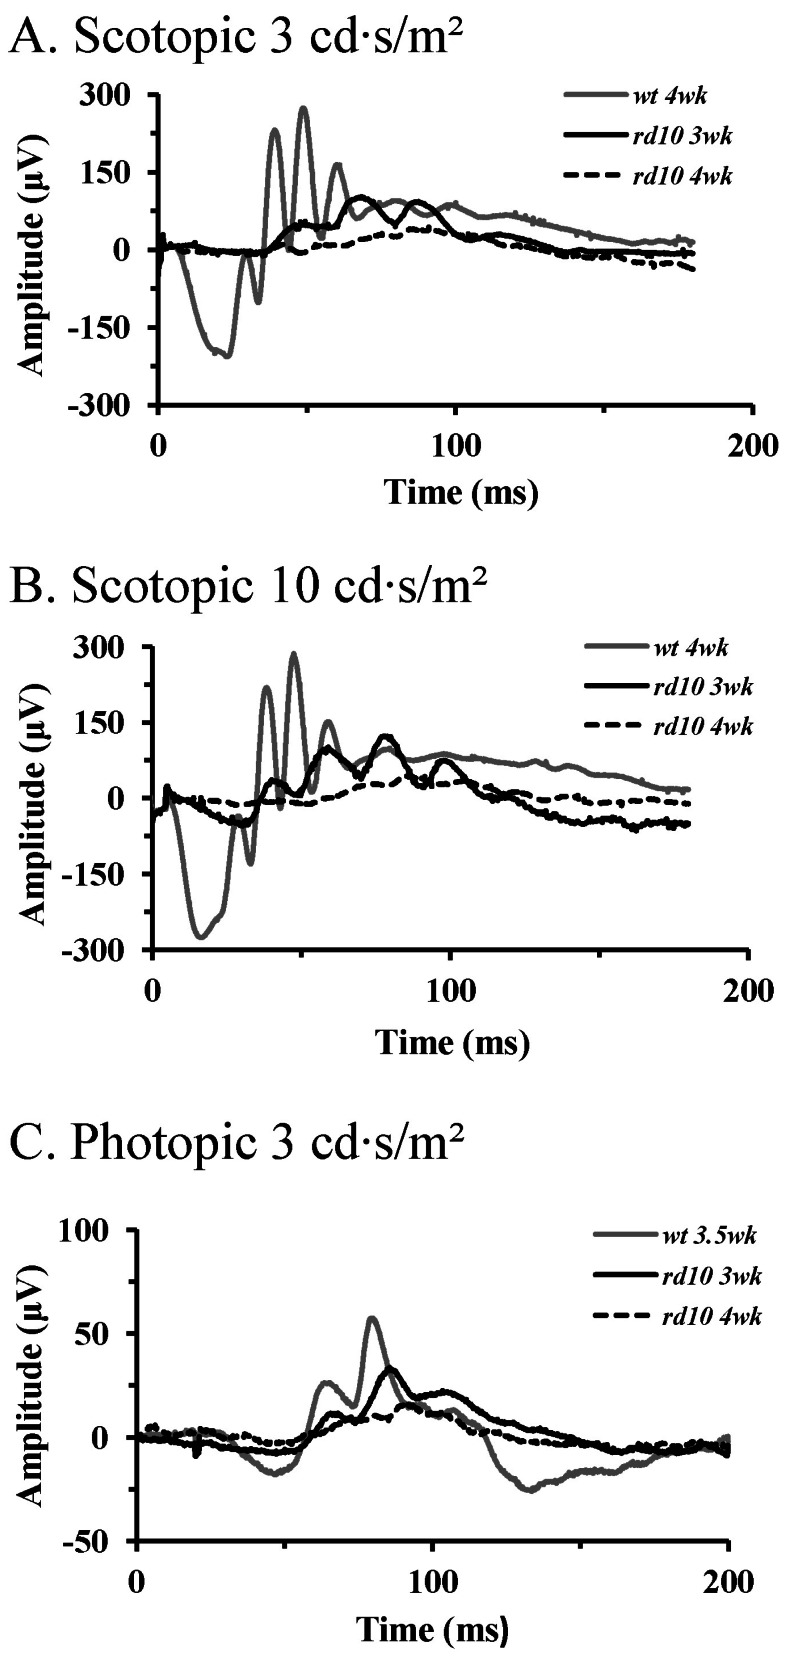 | Fig. 2ERG recordings in wt mice and rd10 mice. (A) Light stimulus condition of scotopic 3 cd·s/m2. (B) Light stimulus condition of scotopic 10 cd·s/m2. (C) Light stimulus condition of photopic 3 cd·s/m2. Dark-adapted responses were recorded after 1 hour of darkad-aptation. Note the increase in amplitudes of the a- and b-wave with increasing light intensities. At the same light intensities, response of the rd10 mice are delayed and reduced in amplitude compared with those of the wt mice. Unlike in wt mice, a-wave in rd10 mice was hardly detectable in postnatal 4 weeks.
|
Comparison of ERG b-wave in wt mice and rd10 mice
We compared the amplitude and implicit time of b-wave in wt mice and rd10 mice because the a-wave was hardly detectable in rd10 mice. Amplitude and implicit time of the scotopic ERG b-wave are plotted in Fig. 3. It shows mean±standard deviation (S.D.) both in wt mice and rd10 mice with different ages. The b-wave amplitude of rd10 mice (20~160 µV) is much smaller than that of wt mice (350~480 µV) for all the intensities used. And the b-wave implicit time of rd10 mice (about 100~150 ms) is slower than that of wt mice (about 55~75 ms) for all the intensities used. These differences between rd10 mice and age-matched wt mice are statistically significant (p<0.001, Student t-test).
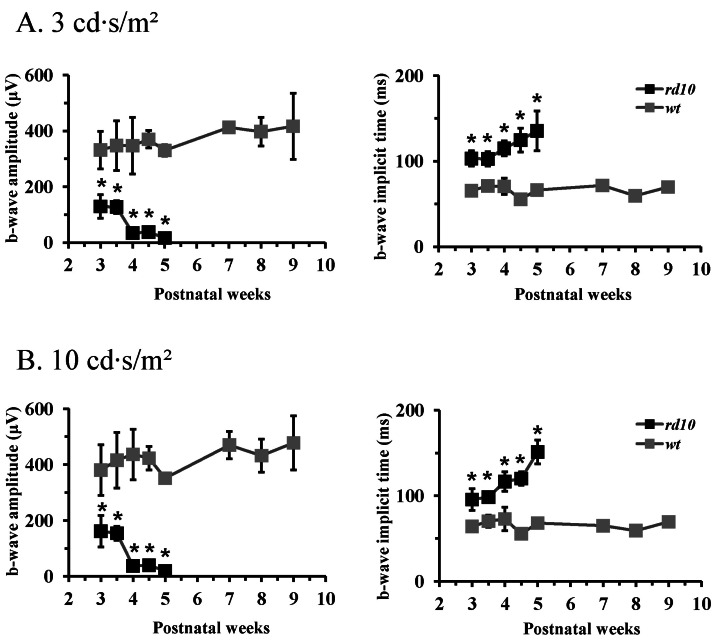 | Fig. 3ERG b-wave of age-matched wt mice and rd10 mice. (A) Light stimulus condition of scotopic 3 cd·s/m2. (B) Light stimulus condition of scotopic 10 cd·s/m2. The b-wave amplitude of rd10 mice is significantly smaller and the implicit time of b-wave is significantly longer than that of wt mice throughout all the postnatal ages. Each point represents the mean±standard deviation (S.D.) (*p<0.001).
|
Analysis of the b-wave amplitude of the ERGs recorded from rd10 mice showed a rapid decline from PW3 to PW4 (162.2±56.4 µV to 37.8±10.7 µV). By PW5, the b-wave amplitude became even smaller (20.0±7.0 µV). Also, the b-wave implicit time steadily increased with age (PW3: 95.7±12.8 ms, PW4: 116.7±11.2 ms, and PW5: 151.2±13.9 ms). These findings are confirmed statistically significant by ANOVA (p<0.001, both in amplitude and implicit time).
Spontaneous retinal ganglion cell (RGC) spikes and local field potential at different postnatal ages
Since in-vivo ERG recording showed significant change of b-wave during PW3 to PW4, we tried to find any degeneration-related changes in retinal network. Therefore, we recorded retinal activity using MEA in rd10 mice starting from PW2 to PW4.5. From the spontaneous activity of rd10 retina, we compared mean spike frequency of RGC across different postnatal weeks (Fig. 4). While spontaneous firing rates varied among individual ganglion cells (Fig. 4B), there was no statistical difference in mean spike frequency through PW2 to PW4.5 (ANOVA, p=0.39).
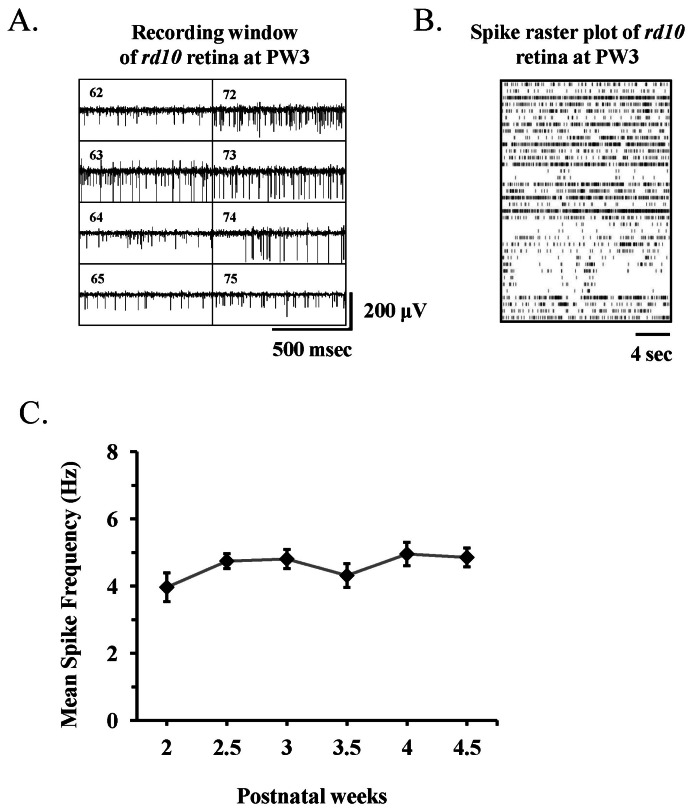 | Fig. 4Spontaneous retinal activity in rd10 mouse recorded with multichannel recording system. (A) Part of real time recording window of data acquisition software (MC_Rack) shows 8 channels of 8×8 multielectrode array. The channel number is shown inside of each channel (e.g., channel 62 means the channel of 6th column and 2nd row). Rd10 mouse at postnatal 3 week (PW3) were used. (B) Raster plots of 36 retinal ganglion cell (RGC) spikes (One RGC spike train per each row of plot) recorded from single rd10 retina at PW3. (C) Mean±standard error of the mean (SEM) firing rate of all cells recorded across different postnatal weeks. There is no statistically significant difference among different postnatal weeks (p>0.05).
|
We compared power of rhythmic local field potential (LFP) among different age groups (Fig. 5), and the power of first and main peak of LFP in PW3 and PW3.5 were significantly different with other age groups (ANOVA and posthoc Tukey criteria, p<0.05).
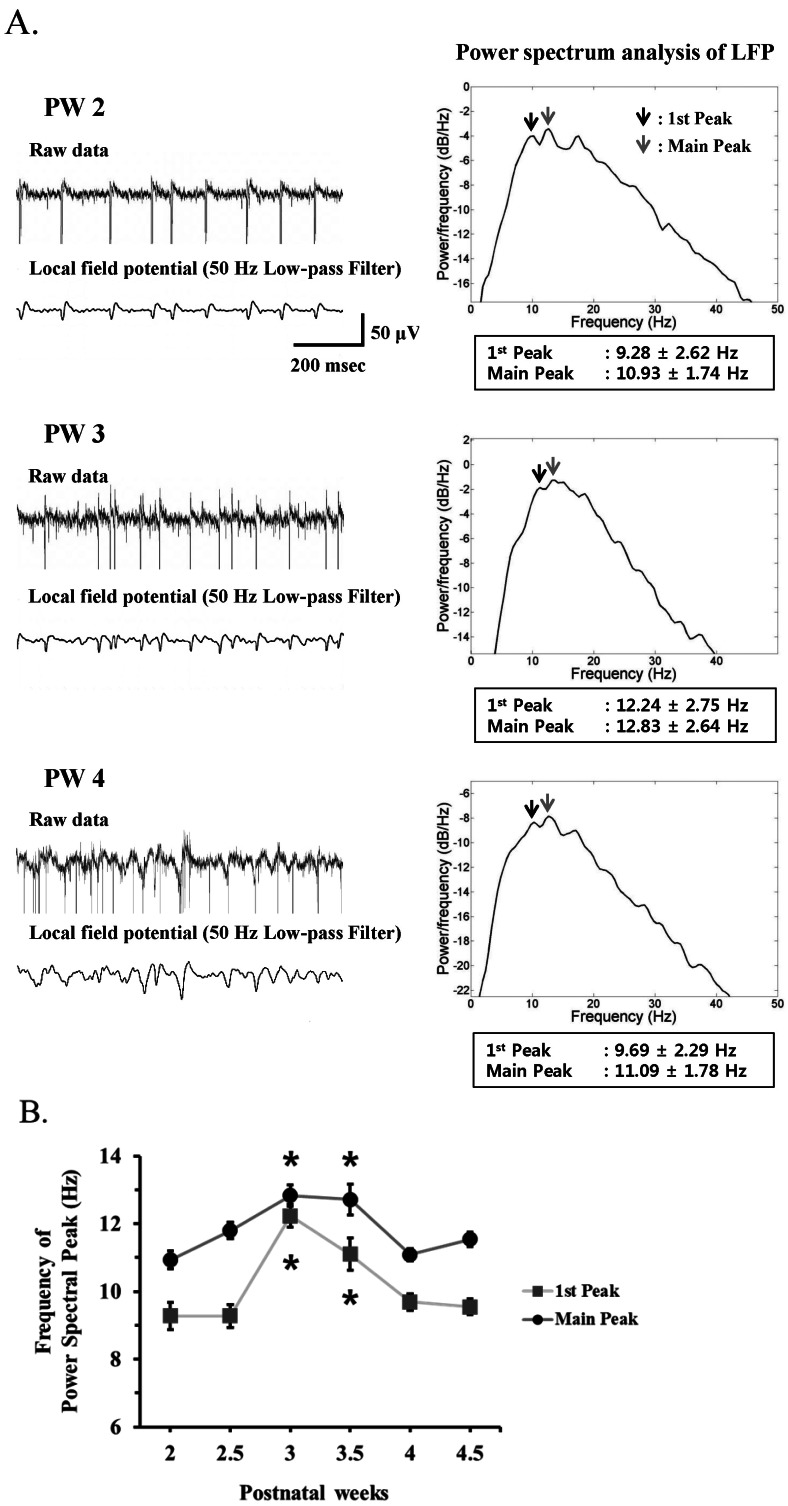 | Fig. 5(A) Left panel. Upper trace: A typical raw waveform of neural activity recorded from postnatal week 2 (PW2), PW3, and PW4 rd10 retina. Lower trace: Local field potential (LFP) waveform obtained from low-pass filtering with 50 Hz cutoff frequency. Right panel: Power spectrum analysis of LFP estimated by the Burg algorithm was shown. Arrows indicate the 1st and main spectral peak. (B) Frequency of power spectral peak of LFP across different postnatal weeks. The 1st and main peak of LFP at PW3 and PW3.5 are significantly different with other age groups (*p<0.05, ANOVA and posthoc Tukey criteria). At each postnatal week, 3 rd10 mice were used. The number of MEA channels for analysis was 44, 87, 68, 50, 95, and 86 at PW2, PW2.5, PW3, PW3.5, PW4, and PW4.5, respectively. Error bars are ±SEM.
|
Morphological changes in different postnatal-aged retina of rd10 mice
The morphology of the PW2 rd10 mice retina (Fig. 6B) was identical to the wt mice retina (Fig. 6A). In the wt mice, the entire thickness of the retina did not change with age from PW2 to PW8 (Fig. 6A, D, G, J, and M). In rd10 mice however, there was apparent reduction in retinal thickness in PW3. After PW3, thickness reduced only slightly with age up to PW8 (Fig. 6E, H, K, and N). Among the retinal layers, thickness reduction was most obvious in the outer nuclear layer (ONL) of the PW3 rd10 mice retina, which had two or three rows of nuclei (Fig. 6E). The morphology of the PW4 rd10 mice retina was similar to that of the PW3 rd10 mice retina (Fig. 6H). The ONL of the PW5 rd10 mice retina consists of only one row of nuclei (Fig. 6K). Only discontinuous single layer is slightly left in PW8 rd10 mice retina (Fig. 6N). Morphological changes in the other layers, except for the ONL, were hardly detectable in our observation.
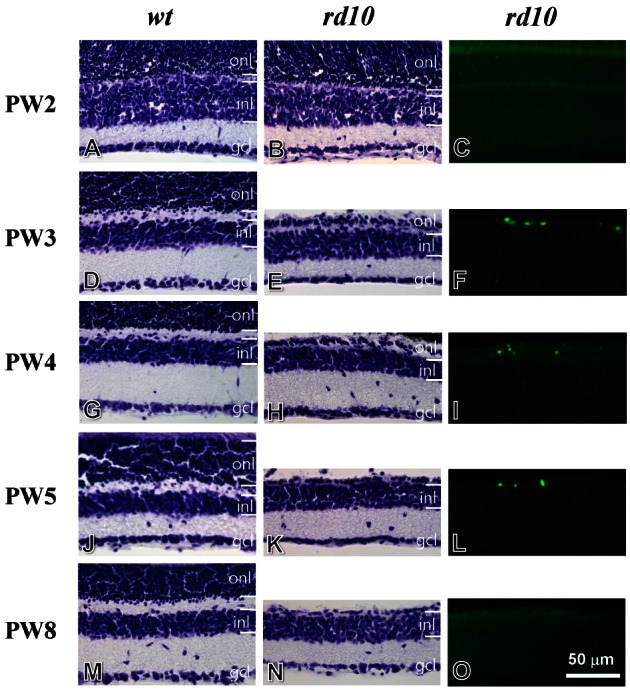 | Fig. 6Cresyl violet staining and TUNEL staining for developing retinae of wt mice (left panel), rd10 mice (middle and right panels). (A~C) Postnatal week 2 (PW2). The retina of the rd10 mice has intact layers, identical to that of the wt mice (A, B). Few TUNEL-stained cells are observed in the rd10 retina (C). (D~F) PW3. Compared to the wt retina (D), the thickness of outer nuclear layer (ONL) is significantly reduced in the rd10 retina (E). A number of TUNEL-stained cells are seen in the ONL of the rd10 retina (F). (G~I) PW4. The morphology of the rd10 retina is similar to that of the PW3 rd10 retina (G~I). (J~L) PW5. Compared to the wt retina (J), one or two row(s) of cells remain(s) in the ONL of the rd10 retina (K). A few TUNEL-stained cells are seen in the ONL of the rd10 retina (L). (M~O) PW8. The morphology of the rd10 retina is similar to the PW5 rd10 retina (M, N). However, TUNEL-stained cells were not detected in the rd10 retina (O). ONL, outer nuclear layer; INL, inner nuclear layer; GCL, ganglion cell layer. Scale bar=50 µm.
|
The result of TUNEL staining supported the cresyl violet staining regarding cell death in the ONL of the rd10 mice retina. In the PW2 rd10 mice retina, there were few TUNEL-positive profiles (Fig. 6C, Fig. 7). Compared to the PW2 rd10 mice retina, the number of TUNEL-positive profiles significantly increased in the PW3 to PW5 rd10 retinae (Fig. 6F, I, L, and Fig 7). TUNEL-positive profiles were most frequently observed in the ONL of the PW3 rd10 mice retina (Fig. 7). However, the number of TUNEL-stained cells was reduced in the PW8 rd10 mice retina (Fig. 6O, Fig. 7).
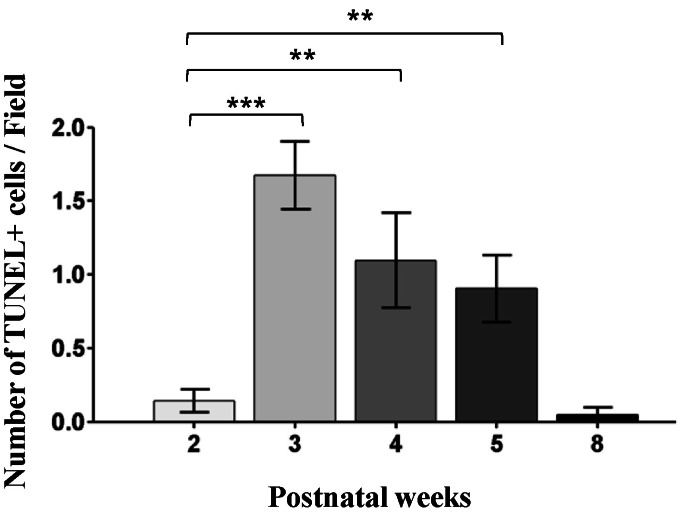 | Fig. 7The number of the TUNEL-stained cells in the developing retinae of the rd10 mice. In comparison to the PW2 rd10 retina, the number of TUNEL-stained cells is significantly increased in the PW3 to PW5 rd10 retinae (***p<0.001, **p<0.01). However, the number of TUNEL-stained cells is reduced in the PW8 rd10 retina. Note that TUNEL-stained cells are most frequently observed in the PW3 rd10 retina.
|
We also tested different apoptosis markers (e.g. Fluoro Jade B histochemistry and caspase 3 antibodies). Except for TUNEL staining, with Fluoro Jade B histochemistry and caspase 3 antibodies, there are no significant changes with postnatal ages in rd10 mice retina.
Go to :
DISCUSSION
It is important to characterize the rd10 mouse model of RP further: firstly because we need to demonstrate in our system that the reported delayed onset and slower progression of retinal degeneration in this model still holds and therefore can be comfortably used in our interventional studies of RP. Secondly, the rd10 mouse is relatively recent and there are not nearly as many studies confirming the characteristics of the model as is the case for rd1 [20-24]. Therefore confirmatory studies such as in this report are warranted.
We have explored the functional properties of wild type and rd10 mice (ages PW3~PW5) retinae by recording and analyzing full field ERG responses to flashes of light and also by multichannel recording of retinal activity. Although we have used similar stimulus paradigms as those by other workers [25], we estimate that our attained luminance for the 3 cd·s/m2 and 10 cd·s/m2 stimuli were 16.6% and 38.7% respectively of Gargini et al.'s intermediate luminance/intensity since 3 and 10 cd·s/m2 stimulus induce 581×3=1,743 photoisomerizations·rod-1·flash-1 (16.6% of 15,000), and 5,810 (581×10) photoisomerizations·rod-1·sec-1 (38.7% of 15,000) based on the calculation of Lyubarsky et al. [26]. Our ERG data shows that the response of rd10 retinae to flashes of light is significantly delayed and of lower amplitude compared to wt mice. The delay is significant and progressive from the youngest age we could record (P21; before that age the mouse eye was too small for our corneal contact electrode), to the oldest (PW5). The rapid progression in diminished amplitude was such that by PW3.5~PW4, the ERG a-wave had become practically unrecognizable. These ERG findings compare favourably with those reported by Gargini and co-workers [25], and Barhoum's group [27].
Since our ERG recording showed significant change of b-wave during PW3.5 to PW4, we tried to find any degeneration-related changes in retinal network by using multichannel recording. We could successfully measure the retinal activity from PW2, and we followed up to PW4.5 in rd10 mice. Our multichannel data shows that there is no difference in the frequency of RGC spike, which is expected from the histologic finding of preserved ganglion cell layer. The first and main peak of local field potential (LFP) in PW3 and PW3.5 rd10 retinae are significantly different with those in other age groups (PW2, PW2.5, PW4, and PW4.5). LFP is known to be a synaptic potential through retinal network, main contributing factor is glutamatergic excitatory input from photoreceptor to bipolar cell and from bipolar cell to ganglion cell [28,29]. This finding is relevant with our histologic data since by PW3, only prominent change in ONL is observed, which possibly change glutamatergic input from photoreceptor to bipolar cell and subsequently change the frequency of LFP. Therefore, the frequency change of power spectral peak in LFP could be used as the early sign of prospective retinal degeneration in rd10 mice. However, why the frequency increase of first and main peak observed in PW3 and PW3.5 never remain but return to lower frequency in later postnatal ages (PW4, PW4.5) should be answered. We are now thoroughly analyzing all the parameters of spike and LFP to answer this question.
Our histologic data show, on cresyl violet stained rd10 retinae, a profound reduction in retinal thickness (in the ONL) at PW3. Although we have not attempted to quantify the age-to-age changes in thickness of rd10 mice (because even minor changes in tangential sectioning of the tissue could suggest a false difference in thickness), we observed very little further change in thickness between PW3 and PW5. This is probably because most photoreceptor cells have died by PW3. This is consistent with our ERG findings as it precedes the dramatic change in b-wave amplitude and implicit time at PW4. Surviving photoreceptors and synaptic input to bipolar cells may have compensated the function of dying photoreceptors until the very end of degenerative changes in bipolar cells by PW4. Other researchers [25,27] have also shown appreciable morphological changes in rd10 rod and cone photoreceptors by P20, with photoreceptor depletion peaking at P25. Our findings are therefore consistent with these reports although we did not observe a centre to periphery gradient in retinal thickness changes [25].
Thus both our functional and morphologic studies demonstrate precipitous retinal degeneration between PW3 and PW4 and suggest that photoreceptor degeneration in rd10 mice is complete by PW5. Furthermore, we show that after the initial rapid denudation of the ONL in PW3, the surviving retinal neuronal elements persist well into PW8. These findings are significant as we are now able to extract degeneration stage-specific optimal stimulation parameters for interventional study [6] using this valuable model of RP.
Go to :
 XML Download