

 PDF
PDF ePub
ePub Citation
 Print
Print


ABBREVIATIONS
VCAM-1
vascular cell adhesion molecule 1
ICAM-1
intercellular adhesion molecule 1
LPS
lipopolysaccharide
HUVEC
human umbilical vein endothelial cell
NF-κB
nuclear factor kappa B
MAPK
mitogen-activated protein kinase
PI3-kinase
phosphatidylinositol 3-kinase
MEK/ERK
mitogen-activated protein kinase kinase/extracellular signal-regulated kinase
JNK
c-Jun N-terminal kinase
IκBα
IkappaBα
INTRODUCTION
Atherosclerosis is a chronic inflammatory disease of the vasculature. Activation of vascular endothelial cell is the initiating event of atherosclerosis. Pro-inflammatory cytokines such as tumor necrosis factor-alpha (TNFα) mediate vascular endothelial cell activation resulting in upregulation of adhesion molecules such as P- and E-selectin, intercellular adhesion molecule 1 (ICAM-1), vascular cell adhesion molecule 1 (VCAM-1). Cell adhesion molecules initiate leukocyte-endothelial cell contact and facilitate subsequent rolling, activation and transendothelial migration into vascular wall [1,2]. Recruited monocytes differentiate into macrophages which engulf lipoprotein particles through endocytosis and become foam cells in vascular intima, which is a hallmark of the nascent of atherosclerotic plaque [1,2]. Expression of ICAM-1 has been observed in human atherosclerotic plaques [3]. Epidemiological studies have demonstrated that increased vascular risk in individuals with elevated levels of cell adhesion molecules such as ICAM-1 and P-selectin [4]. Elevated soluble-ICAM levels demonstrated increase of vascular inflammation in atherosclerotic patients [5]. Serum concentrations of VCAM-1 and ICAM-1 were significantly higher in patient groups with coronary artery disease (CAD) compared with the controls [6]. Moreover, significant correlations between ICAM-1 and VCAM-1 levels and maximal carotid artery intimal-medial thickness were found in type-2 diabetic patients [7].
Ginsenosides, found in the plant genus Panax, are triterpene saponins. These can be classified into two groups as follows: the protopanaxadiol group (Rb1, Rb2, Rc, Rd) and the protopanaxatriol group (Rg1, Re, Rf, Rg2). Ginsenoside Rb1 inhibited TNFα-induced VCAM-1 expression in human endothelial cells [8]. Protopanaxadiol-type saponin was the most potent saponin fraction against TNFα-induced monocyte adhesion as well as the expression of adhesion molecules in vitro and in vivo [9]. Ginsenoside Rb1 acted as a weak phytoestrogen in MCF-7 human breast cancer cells [10]. On the other hand, ginsenoside Rg1 attenuated the oxidative stress in the liver of exercised rats [11]. Ginsenoside Rg2 protected memory impairment via anti-apoptosis in a rat model with vascular dementia [12]. Panax notoginseng reduced atherosclerotic lesions in ApoE-deficient mice and inhibited TNF-alpha-induced endothelial adhesion molecule expression and monocyte adhesion [13], and suppressd RAGE/MAPK signaling and nuclear factor kappa B (NF-κB) activation in apolipoprotein-E-deficient atherosclerosis-prone mice [14]. Therefore, ginsenoside may act as a potential molecule for prevention and treatment against vascular inflammation. However, the mechanism(s) of ginsenoside on decrement of vascular inflammation has not been fully investigated.
The aim of study was to investigate the mechanism(s) of ginsenoside Rg2 on lipopolysaccharide (LPS)-induced VCAM-1 and ICAM-1 expression in human umbilical vein endothelial cell (HUVEC).
Go to : 
METHODS
Materials
Endothelial cell basal medium (EBM)-2 Bullet kit was obtained from Lonza (Walkersville, MD). RPMI 1640, fetal bovine serum (FBS), penicillin-streptomycin, phosphate buffer saline (PBS) and trypsin-EDTA were obtained from Invitrogen Corp (Carlsbad, CA). LPS was obtained from List Biological Laboratories, Inc. Gelatin, Calcein-AM, JSH, SB202190, PD98059, wortmannin, SP600125 and ginsenoside Rg2 were obtained from Sigma-Aldrich Corp (St. Louis, MO). Antibodies against VCAM-1, ICAM-1, IκBα, β-tubulin and horseradish peroxidase-conjugated goat anti-rabbit IgG were purchased from Santa Cruz Biotechnology, Inc (Santa Cruz, CA).
Cell culture
HUVEC was purchased from Lonza (Walkersville, MD) at passage 1 and maintained in EBM-2 Bullet kit with 10% heat-inactivated FBS at 37℃ in a humidified atmosphere of 5% CO2. In experiments, endothelial cells were used at passage 4~9. Cells were plated at 90~95% confluence and treated for 1 hr with 50µM of inhibitor or Rg2 (1~50µM) prior to LPS (1µg/ml) stimulation for 8 hr. A group of cells treated only with dimethylsulfoxide (DMSO) were used as a solvent control. Human-derived THP-1 macrophage cell lines were obtained from the American Type Culture Collection (ATCC) (Manassas, VA). THP-1 cells were cultured in RPMI 1640, and supplemented with 2 mM L-glutamine, 100µg/ml streptomycin, 100 IU/ml penicillin and 10% FBS.
Western blot analysis
The endothelial cells were treated with Rg2 or inhibitor prior to LPS stimulation. After treatment, cells were washed twice in PBS. Whole cell lysates were prepared with RIPA buffer containing the Protease Inhibitor Cocktail V (Calbiochem, Switzerland). Protein concentration was determined by using the Bio-Rad protein assay (Bio-Rad Lab, Hercules, CA) with BSA as the standard. The lysates were resolved on 8% and 12% SDS-polyacrylamide gel. The proteins were electrophoretically transferred to an Immobilon-P membrane (Millipore, Bedford, MA) and the membranes were blocked with 5% nonfat dry milk in Tris-buffered saline containing 0.1% Tween-20 (TTBS) at room temperature 1 hr. The membrane was incubated for overnight with primary antibodies of anti-human ICAM-1, anti-human VCAM-1 and IκBα. After three washes with TBS-T buffer, the membrane was then incubated for 1 hr with goat anti-rabbit IgG horseradish peroxidase. The levels of ICAM-1, VCAM-1 and IκBα proteins were determined by using an Enhanced Chemiluminescence Plus kit (Amersham Biosciences, Piscataway, NJ) and Fujifilm LAS-3000 system (Fujilfilm, Japan). Anti-human β-tubulin antibody was used for the loading control. Each image of Western blot was quantified with Multi Gauge Software Version 2.3 (Fujifilm, Japan).
Cell adhesion assay
HUVEC was grown in EBM-2 containing 10% FBS at a density of 2.0×10⁵ cells/well on 24-well plates. Endothelial cells at 90~95% confluence were treated with Rg2 (1, 20, 50µM) for 1 hr prior to 1µg/ml of LPS stimulation for 8 hr. THP-1 cells were labeled with Calcein-AM (5µM) in RPMI 1640 medium containing 10% FBS for 30 min. After extensive washing with PBS, the labeled THP-1 cells were seeded at a density of 5.0×10⁵ cells/well onto endothelial cells which were treated with the Rg2 and/or LPS and, then, incubated for 1 hr at 37℃ while gentle shaking. After incubation, non-adherent cells were removed by gentle washing two times with PBS. Photograph images were obtained at 485 nm excitation and 538 nm emission using a SPOT II digital camera-attached fluorescence microscope (Diagnostic Instrument, Livingston, Scotland).
Data analysis
The results are presented as means±SEM for each treatment group in each experiment. Data were tested by one-way ANOVA followed by Scheffe post-hoc test for multiple comparisons. Statistical software SPSS (Chicago, IL, USA) was used. p<0.05 was considered statistically significant.
Go to :
RESULTS
Effect of ginsenoside Rg2 on LPS-induced VCAM-1 and ICAM-1 expression from endothelial cells
Treatment of endothelial cells with LPS (1µg/ml) increased VCAM-1 and ICAM-1 expression. By 8 hr after LPS treatment, maximal expression of VCAM-1 and ICAM-1 was attained. To determine whether LPS-stimulated VCAM-1 and ICAM-1 expression is affected by ginsenoside Rg2, endothelial cells were treated for 1 hr with ginsenoside Rg2 (1~100µmol/l) prior to LPS (1µg/ml) stimulation for 8 hr. Ginsenoside Rg2 inhibited VCAM-1 and ICAM-1 expression stimulated with LPS in a concentration-dependent manner, significantly (Fig. 1).
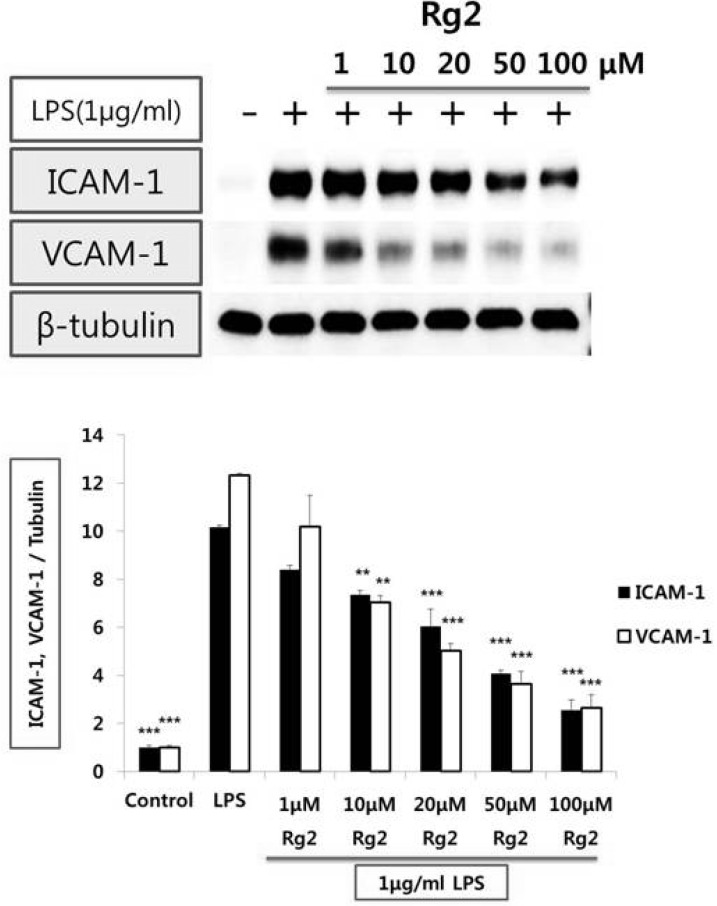 | Fig. 1Effect of Rg2 on the protein expression levels of adhesion molecules in HUVEC stimulated with LPS. Endothelial cell was treated with 1, 10, 20, 50 and 100µmol/l of Rg2 for 1 hr prior to LPS (1µg/ml) stimulation for 8 hr. Cell extracts were resolved on 8% SDS-polyacrylamide gel and Western blot analysis with the respective primary antibody against VCAM-1 and ICAM-1. β-tubulin was used as an internal control. The bar graph represents the amount of VCAM-1 and ICAM-1 estimated by image scanning and is expressed in arbitrary units. Values are means±SEM of 3 independent experiments. Statistical significance assessed by one-way ANOVA followed by Scheffe post-hoc test for multiple comparisons (**p<0.01, ***p<0.001 vs LPS).
|
The signaling mechanism(s) by which LPS induces VCAM-1 and ICAM-1 expression from endothelial cells
We first tested if VCAM-1 and ICAM-1 expression stimulated with LPS were mediated through the nuclear factor kappaB (NF-κB) pathway in HUVEC. LPS-induced VCAM-1 and ICAM-1 expression were prevented by JSH (50µmol/l), inhibitor of NF-κB. Moreover, VCAM-1 but not ICAM-1 expression stimulated with LPS was decreased by SB 202190 (50µmol/l), an inhibitor of p38 mitogen-activated protein kinase (p38 MAPK) or wortmannin (50µmol/l), inhibitor of phosphatidylinositol 3-kinase (PI3-kinase). However, PD98059 (50µmol/l), inhibitor of mitogen-activated protein kinase kinase/extracellular signal-regulated kinase (MEK/ERK) did not affect VCAM-1 and ICAM-1 expression stimulated with LPS. SP600125 (50µmol/l), inhibitor of c-Jun N-terminal kinase (JNK), reduced LPS-mediated ICAM-1 but not VCAM-1 expression (Fig. 2).
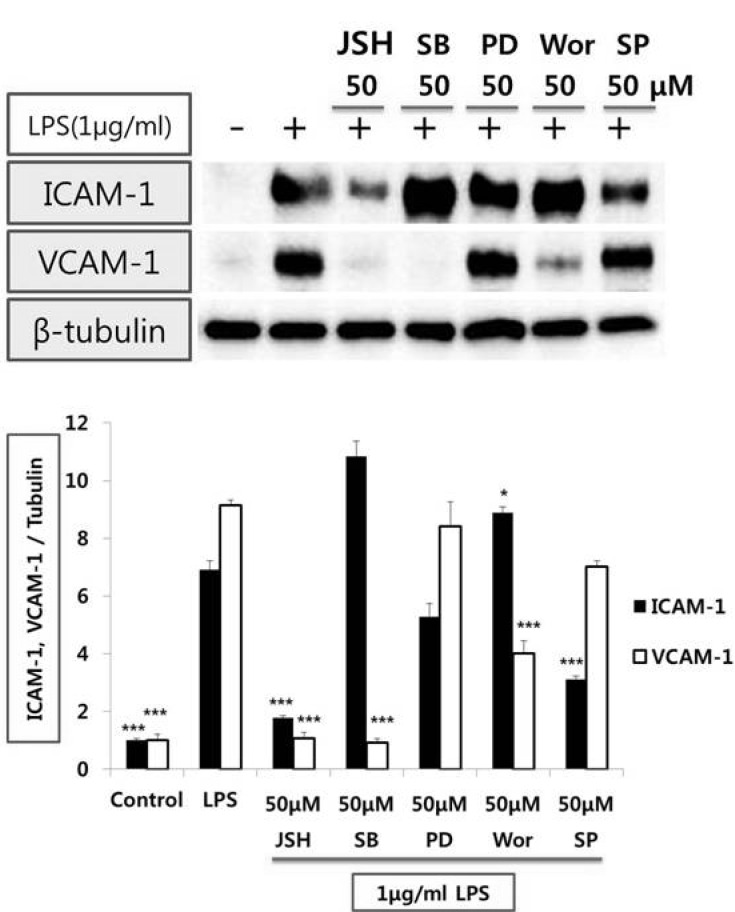 | Fig. 2Effect of inhibitors of signal transduction pathway on the protein expression levels of adhesion molecules in HUVEC stimulated with LPS. Endothelial cell was treated with 50µmol/l of JSH (NF-κB inhibitor), SB202190 (p38 MAPK inhibitor), PD98059 (MEK/ERK inhibitor), wortmannin (PI3-K inhibitor), and SP600125 (JNK inhibitor) for 1hr prior to LPS (1µg/ml) stimulation for 8 hr. Cell extracts were resolved on 8% SDS-polyacrylamide gel and Western blot analysis with the respective primary antibody against VCAM-1 and ICAM-1. β-tubulin was used as an internal control. The bar graph represents the amount of VCAM-1 and ICAM-1 estimated by image scanning and is expressed in arbitrary units. Values are means±SEM of 3 independent experiments. Statistical significance assessed by one-way ANOVA followed by Scheffe post-hoc test for multiple comparisons (*p<0.05, ***p<0.001 vs LPS).
|
Effect of ginsenoside Rg2 on IκBα expression from endothelial cells
Treatment of endothelial cells with LPS (1µg/ml) decreased IκBα expression. By 1 hr after LPS treatment, significant decrease of IκBα was attained (Fig. 3A). To determine whether LPS-stimulated IκBα expression is affected by ginsenoside Rg2, endothelial cells were treated for 1 hr with ginsenoside Rg2 (1~50µmol/l) prior to LPS (1µg/ml) stimulation for 1 hr. Ginsenoside Rg2 reversed the decrease of LPS-induced IκBα expression in a concentration-dependent manner, significantly (Fig. 3B).
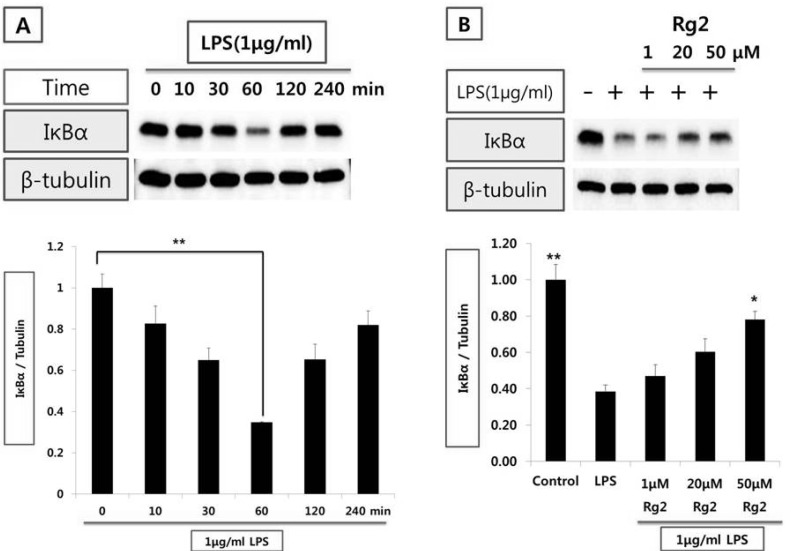 | Fig. 3Effect of Rg2 on IκBα expression in HUVEC stimulated with LPS. (A) Time-course of IκBα expression in HUVECs stimulated with LPS (1µg/ml). (B) Effect of Rg2 on time-course of IκBα expression in HUVEC stimulated with LPS. Endothelial cell was treated with 1, 20, and 50µmol/l of Rg2 prior to LPS (1µg/ml) stimulation for 1 hr. Cell extracts were resolved on 12% SDS-polyacrylamide gel and Western blot analysis with the respective primary antibody against IκBα. β-tubulin was used as an internal control. The bar graph represents the amount of IκBα estimated by image scanning and is expressed in arbitrary units. Values are means±SEM of 3 independent experiments. Statistical significance assessed by one-way ANOVA followed by Scheffe post-hoc test for multiple comparisons (A: **p<0.05 vs control; B: *p<0.05, **p<0.01 vs LPS).
|
Effect of ginsenoside Rg2 on THP-1 cell adhesion from endothelial cells
The adhesion of THP-1 cells to endothelial cells was measured using quantitative monolayer adhesion assay. The adhesion of THP-1 cells onto endothelial cells were increased to five folds by LPS (1µg/ml) stimulation for 8 hrs. Ginsenoside Rg2 (1~50µmol/l) inhibited the adhesion of THP-1 cells to endothelial cells stimulated with LPS, in a concentration-dependent manner (Fig. 4). Moreover, JSH (50µmol/l), inhibitor of NF-κB, attenuated the adhesion of THP-1 cells to endothelial cells stimulated with LPS, significantly (Fig. 4).
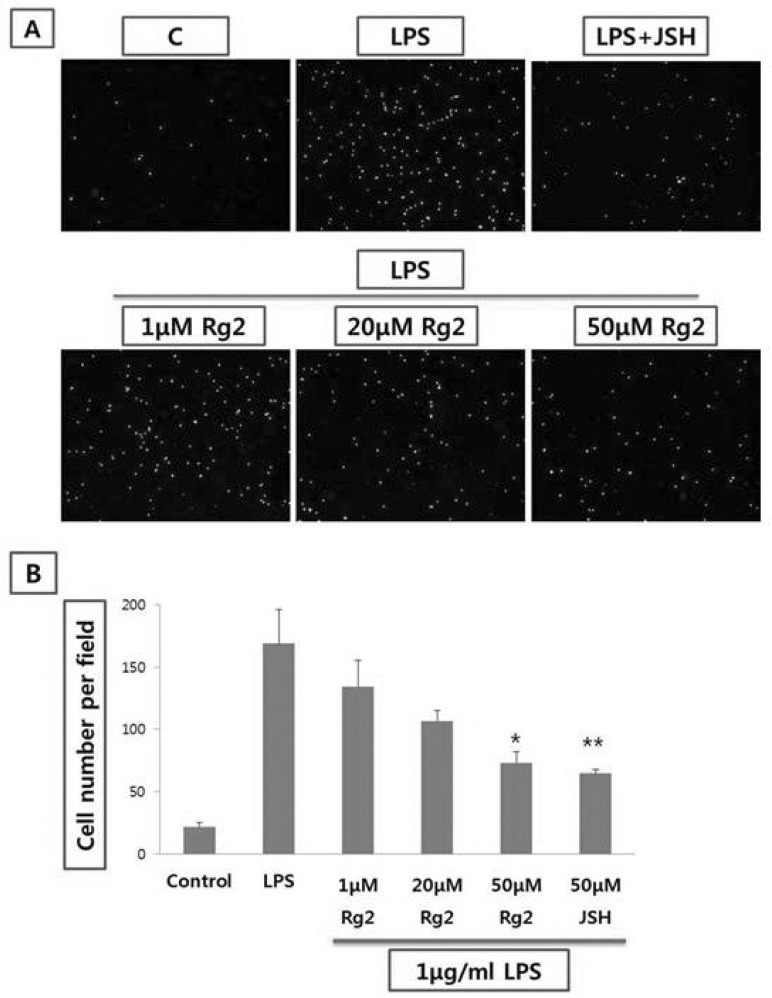 | Fig. 4Effect of Rg2 on THP-1 monocyte adhesion to LPS in HUVEC stimulated with LPS. (A) Endothelial cell was treated with 1, 20, and 50µmol/l of Rg2 prior to LPS (1µg/ml) stimulation for 8 hr. THP-1 cells were labeled with Calcein-AM (5µmol/l) for 30 min. The labeled THP-1 cells were seeded at a density of 5.0×10⁵ cells/well onto endothelial cells treated with the Rg2 and/or LPS and then incubated for 1 hr. Microphotographs (four independent experiments) were obtained using fluorescence microscopy. Magnification ×100. (B) The bar graph represents the cell number of THP-1 monocyte. Values are means±SEM of 3 independent experiments. Statistical significance assessed by one-way ANOVA followed by Scheffe post-hoc test for multiple comparisons (*p<0.05, **p<0.01 vs LPS).
|
Go to :
DISCUSSION
LPS, the prototypical endotoxin, promotes the secretion of pro-inflammatory cytokines in many cell types after binding to CD14/TLR4/MD2 receptor [15]. In our study, stimulation with LPS to HUVEC increased VCAM-1 as well as ICAM-1 expression. The expression of adhesion molecules such as VCAM-1 and ICAM-1 is a pivotal early event for vascular inflammatory diseases [1,2]. Therefore, a natural molecule which inhibits the expression of VCAM-1 and ICAM-1 may be a potential candidate for prevention and treatment of vascular inflammatory diseases such as atherosclerosis with less toxicity.
Ginsenoside, a class of steroid glycosides, is abundant in Panax ginseng root, which has been used for health promotion in Korea for hundreds of years. Ginsenoside Rg2, protopanaxatriol, inhibited VCAM-1 and ICAM-1 expression stimulated with LPS from HUVEC. The inhibition of VCAM-1 and ICAM-1 expression by ginsenoside Rg2 was in a concentration-dependent manner, significantly. Recently, it was reported that ginsenoside Rg3 inhibited TNFα-induced expression of cell adhesion molecules in human endothelial cells [16]. In their study, activities of transcription factor, NF-κB and activator protein-1 (AP-1), were blocked by Rg3. Transcription factor, NF-κB, activity is essential for adhesion molecule expression. In our study, we show that JSH, an inhibitor of NF-κB, attenuated both VCAM-1 and ICAM-1 expression stimulated with LPS. Moreover, ginsenoside Rg2 prevented the decrease of IκB expression stimulated with LPS. IκB dissociation from RelA-p50 complex is crucial for NF-κB activity [17]. Therefore, ginsenoside Rg2 may act as a NF-κB inhibitor. Blockade of NF-κB activity could be beneficial in vascular inflammatory disease such as atherosclerosis although questions remain.
On the other hand, SB202190, p38 MAPK inhibitor, and wortmannin, PI3-kinase inhibitor, decreased VCAM-1 but not ICAM-1 expression stimulated with LPS, respectively. In contrast, inhibitor of p38 MAPK reduced the high glucose-induced induction of ICAM-1 in endothelial cells [18]. Inhibition of PI3-kinase significantly reduced the expression of ICAM-1 stimulated with vascular endothelial growth factor in retinal endothelial cells [19]. Moreover, PD98059, inhibitor of MEK/ERK did not affect VCAM-1 and ICAM-1 expression stimulated with LPS. However, inhibitors of p38 MAPK (SB203580), and ERK (PD98059) could suppress TNFα-induced ICAM-1 expression, while only p38 MAPK and MEK/ERK inhibitors could suppress TNFα-induced VCAM-1 expression in human proximal tubular epithelial cells [20]. It appears that activation of p38 MAPK, PI3-kinase, and MEK/ERK on VCAM-1 and ICAM-1 induction depends on the used ligand and cell type in each experiment. SP600125, inhibitor of JNK, decreased LPS-induced ICAM-1 but not VCAM-1 expression. JNK is the upstream regulator of transcription factor, activator protein-1 (AP-1) [21]. Therefore, it seems likely that ICAM-1 expression by LPS may be regulated by AP-1 as well as NF-κB. VCAM-1 expression by LPS may be regulated primarily by NF-κB rather than AP-1 transcription factor.
The increase of THP-1 monocyte adhesion to endothelial cell by LPS supports the crucial role of VCAM-1 and ICAM-1 in early phase of atherogenesis. Ginsenoside Rg2 significantly reduced THP-1 monocyte adhesion to endothelial cell stimulated with LPS in a concentration-dependent manner. TNFα-induced THP-1 monocyte adhesion to HUVEC was attenuated by ginsenoside Rh1 [22]. Ginsensoside Rg2 as well as Rh1 may be effective against early phase of vascular inflammation such as atherosclerosis. In vivo animal study will further strengthen the evidence for the vascular protective effects of ginsenoside Rg2.
In conclusion, the ginsenoside Rg2 may provide direct vascular benefits with inhibition of leukocyte adhesion into vascular wall thereby providing protection against vascular inflammatory disease.
Go to :
 XML Download