

 PDF
PDF ePub
ePub Citation
 Print
Print


INTRODUCTION
Ginseng, the root of Panax ginseng C.A. Meyer, has been used as a general tonic to promote longevity and to enhance bodily functions to protect against stress, fatigue, and diseases such as cancer and diabetes mellitus [1]. Recent studies have shown that among the various ginseng components, ginsenosides (also called ginseng saponins) exhibit neuroprotective effects against various excitatory stimulants [2]. Approximately 30 different forms have been isolated and identified from the root of Panax ginseng. They are classified into protopanaxadiol (PD) or protopanaxatriol (PT) ginsenosides according to the position of the carbohydrate component at carbon-3 and -6 [3].
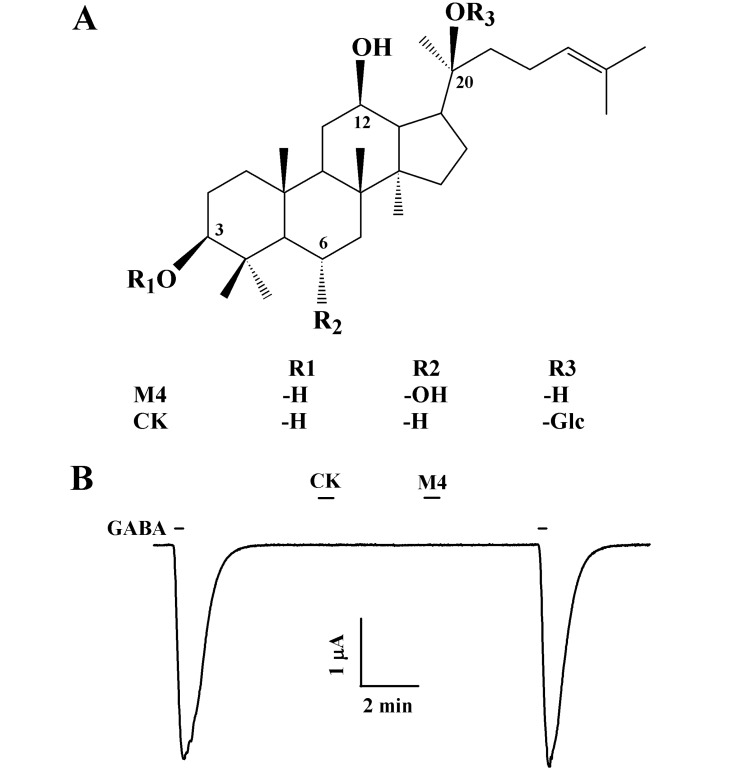
Hasegawa et al. showed that ginsenosides administered via the oral route may pass into the large intestine without decomposition by either gastric juices or digestive enzymes [4]. PD ginsenosides are converted into compound K (CK) by intestinal microorganisms, with glucose at the C-20 position, whereas PT ginsenosides are converted to protopanaxatriol (M4), with only a ginsenoside backbone without a carbohydrate component (Fig. 1). These metabolites are absorbed into the blood of humans and rats [5,6]. Recently, reports have shown that these ginsenoside metabolites might also cause apoptosis of cancer cells and function as anti-cancer agents [7,8], suggesting that ginsenosides may have a role as prodrugs.
GABA receptors, which are activated by GABA, an inhibitory neurotransmitter, exhibit inhibitory actions at the neuronal synaptic membrane and they are classified into 3 types of receptors: GABAA, GABAB, and GABAC. GABAA and GABAC receptors function as anion-selective channels that are permeable to chloride (Cl-) ions, whereas GABAB receptors are G-protein coupled receptors [9,10]. GABAC receptors are members of the large "Cys-loop" super family and form homopentameric Cl- channels by the rho (ρ) subunit [11]. The GABAC receptor is predominantly expressed in retinal bipolar cells [12,13] and less abundantly in the cerebellum [14] and hippocampus [15]. They have important roles in vision, sleep, cognition, and memory [16]. In previous studies, we demonstrated that the ginsenoside Rc (20-[(6-O-alpha-L-Arabinofuranosyl-β-D-glucopyranosyl) oxy]-12β-hydroxydammar-24-en-3β-yl 2-O-β-D-glucopyranosyl-β-D-glucopyranoside) enhanced GABA-elicited inward peak currents (IGABA) and that ginsenoside metabolites inhibited IGABA in oocytes expressing the GABAA (α1β1γ2s) receptor [17,18]. However, little is known regarding the effects of CK or M4 on GABAC receptor channel activity.
In the present study, we examined the effects of CK or M4 on GABAC receptor channel activity. We injected neuronal human GABAC (ρ1) receptor cRNAs into Xenopus oocytes and examined the effect of CK or M4 on IGABA. We found that treatment of CK or M4 inhibited IGABA in a reversible, dose-dependent, and non-competitive manner. We further discussed the possible role of ginsenoside metabolites in the regulation of human GABAC (ρ1) receptor.
Go to : 
METHODS
Materials
Ginsenoside metabolites were provided by the AMBO Institute (Seoul, Korea) (Fig. 1A). cDNAs for the human GABAC receptor ρ1 subunit were purchased from Thermo Fisher Scientific Inc. (Wyman Street Waltham, MA, USA). All other reagents were purchased from Sigma-Aldrich (St. Louis, MO, USA).
Preparation of Xenopus oocytes and microinjection
Xenopus laevis frogs were purchased from Xenopus I (Ann Arbor, MI, USA). Their care and handling were in accordance with the highest standards of the institutional guidelines of Konkuk University. For the isolation of oocytes, frogs were anesthetized with an aerated solution of 3-amino benzoic acid ethyl ester followed by removal of ovarian follicles. The oocytes were treated with collagenase and then agitated for 2 h in Ca2+-free medium containing 82.5 mM NaCl, 2 mM KCl, 1 mM MgCl2, 5 mM HEPES, 2.5 mM sodium pyruvate, 100 units/ml penicillin, and 100 µg/ml streptomycin. Stage V~VI oocytes were collected and stored in ND96 medium (in mM: 96 NaCl, 2 KCl, 1 MgCl2, 1.8 CaCl2, and 5 HEPES, pH 7.5) supplemented with 50 µg/ml gentamicin. The oocyte-containing solution was maintained at 18℃ with continuous gentle shaking and renewed daily. Electrophysiological experiments were performed within 5~6 days of oocyte isolation, with ginsenoside metabolites added to the bath. For GABAC receptor activity experiments, GABAC receptor-encoding cRNAs (1~10 ng/oocyte) were injected into the animal or vegetal pole of each oocyte one day after isolation, using a 10 µl microdispenser (VWR Scientific, San Francisco, CA, USA) fitted with a tapered glass pipette tip (15~20 µm in diameter) [17].
cRNA preparation of the GABAC receptor ρ 1 subunit
cDNA constructs were linearized at the 3' ends by digestion with NotI, and run-off transcripts were prepared using the methylated cap analogue m7G(5')ppp(5')G. cRNAs were prepared using the mMessage mMachine transcription kit (Ambion, Austin, TX, USA) with T3 RNA polymerase. The absence of degraded RNA was confirmed by denaturing agarose gel electrophoresis followed by ethidium bromide staining. The final cRNA products were resuspended at a concentration of 1 µg/µl in RNase-free water and stored at -80℃ [17].
Data recording
A custom-made Plexiglas net chamber was used for 2-electrode voltage-clamp recordings as previously reported [18]. The oocytes were impaled with 2 microelectrodes filled with 3 M KCl (0.2~0.7 MΩ), and electrophysiological experiments were carried out at room temperature using an Oocyte Clamp (OC-725C, Warner Instruments, Hamsden, CT, USA). Stimulation and data acquisition were controlled with a pClamp 8 (Axon Instruments, Union City, CA, USA). For most electrophysiological experiments, oocytes were perfused initially with ND96 solution (in mM: 96 NaCl, 3 KCl, 2 CaCl2, and 5 HEPES, pH 7.4 with NaOH) and control current recordings were obtained. For most electrophysiological data, the oocytes were clamped at a holding potential of -80 mV. For current and voltage (I~V) relationship, voltage ramps were applied from -100 to +40 mV for 300 ms. In various membrane-holding potential experiments, oocytes were clamped at the indicated holding potentials. Linear leak and capacitance currents were corrected by the leak subtraction procedure.
Data analysis
To obtain the concentration-response curve for the effect of ginsenoside metabolites on inward peak IGABA mediated by the GABAC receptor, the IGABA peak was plotted at different concentrations of GABA, and Origin software (Origin, Northampton, MA, USA) was used to fit the plot to the Hill equation: y/ymax=[A]nH/([A]nH+[IC50]nH), where y is the peak current at a given concentration of ginsenoside metabolites, ymax is the maximal peak current, IC50 is the concentration of ginsenoside metabolites producing a half-maximal effect, [A] is the concentration of ginsenoside metabolites, and nH is the Hill coefficient. All values are presented as means±S.E.M. The significance of differences between the mean control and treatment values was determined using Student's t-test, linear regression analysis, and one-way ANOVA. p<0.05 was considered statistically significant.
Go to :
RESULTS
The addition of GABA (2 µM) to the bathing medium induced a large inward current (IGABA) in oocytes injected with GABAC receptor subunits cRNAs, indicating that the GABAC receptor was functionally expressed in this system (Fig. 1B). In oocytes expressing the GABAC receptor, treatment with ginsenoside metabolites such as CK or M4 had no effect at a holding potential of -80 mV. Co-treatment of CK and M4 (100 µM each) for 30 s with GABA inhibited IGABA by 17.7±1.2% and 25.4±2.2%, respectively. Interestingly, pre-treatment of CK or M4 (100 µM) induced a much larger inhibition of IGABA (Fig. 2A and 2B, n=9~12 3 different frogs). Thus, CK or M4 inhibited IGABA by 27.8±3.5% or 42.8±4.4% for GABAC receptors. As shown in Fig. 2C, M4 inhibited IGABA more strongly than CK.
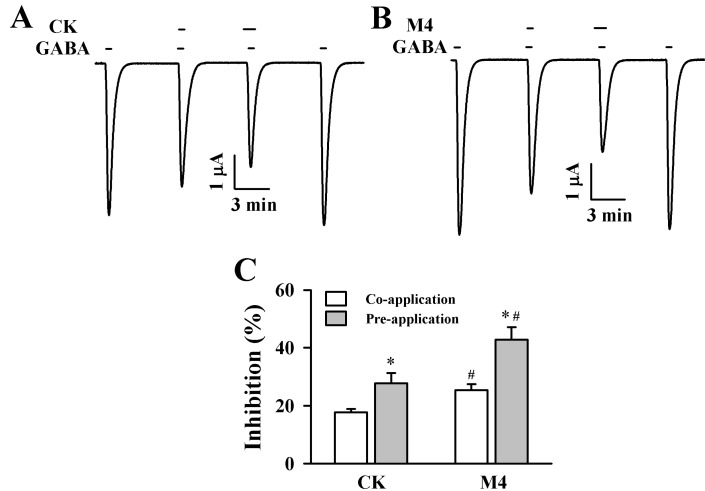 | Fig. 2Effect of CK and M4 on IGABA in oocytes expressing the ρ1 GABAC receptor. (A) GABA (2 µM) was first applied and then was co- or pre-treated with CK (100 µM). Co-treatment of CK with GABA and pre-treatment of CK before GABA application inhibited IGABA in oocytes expressing ρ1 GABAC receptors. (B) GABA (2 µM) was first applied and then co- or pre-treated with M4 (100 µM). Co-treatment of M4 with GABA and pre-treatment of M4 before GABA application inhibited IGABA in oocytes expressing ρ1 GABAC receptors. The resting membrane potential of oocytes was approximately -35 mV and oocytes were voltage clamped at a holding potential of -80 mV prior to drug application. Traces are representative of 8~12 separate oocytes from 3 different frogs. (C) Summary of percent inhibition by CK and M4 of IGABA calculated from the average of the peak inward current elicited by GABA alone before CK and M4 and the peak inward current elicited by GABA alone after co- and pre-treatment of CK and M4 with GABA. Each point represents the mean±S.E.M. (n=9~12 from 3 different frogs). *p <0.05 as compared to co-treatment of CK and M4, and #p<0.05 as compared to CK.
|
Since pre-treatment of CK and M4 induced further inhibition on IGABA as compared to co-treatment, in the following experiments, we examined the effects of CK and M4 on IGABA after pre-treatment. In concentration-response experiments, pre-treatment of CK and M4 for 30 s inhibited IGABA in a concentration-dependent manner (Fig. 3A and 3B). Pre-treatment of CK inhibited IGABA by 1.9±0.5%, 5.8±0.6%, 15.4±2.1%, 28.8±3.9%, and 37.7±4.6%, and pretreatment of M4 inhibited IGABA by 3.0±0.5%, 9.5±1.2%, 24.9±2.9%, 43.8±2.1%, and 56.6±3.5% at 3, 10, 30, 100, and 300 µM, respectively. The IC50 of IGABA by CK and M4 was 52.1 and 45.7 µM in oocytes expressing the GABAC receptor (n=9~12 from 3 different frogs for each point) (Fig. 3C).
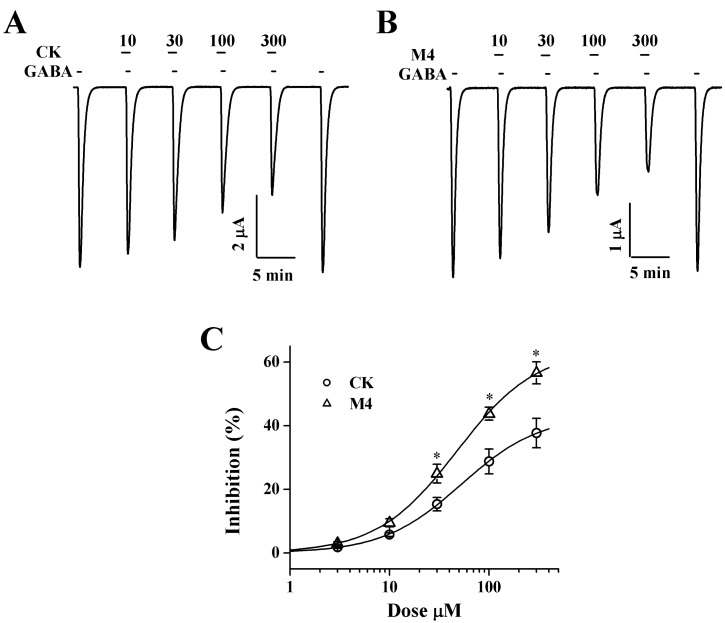 | Fig. 3Concentration-dependent effects of CK and M4 on IGABA in oocytes expressing ρ1 GABAC receptors. (A, B) The trace shows that CK and M4 inhibited the currents elicited by GABA (GABA; 2 µM) in a dose-dependent manner. (C) Percent inhibition by CK and M4 of IGABA was calculated from the average of the peak inward current elicited by GABA alone before CK and M4 and the peak inward current elicited by GABA alone after pre-treatment of CK and M4 before GABA. The continuous line shows the curve fitted according to the equation. Each point represents the mean±S.E.M. (n=9~12 from 3 different frogs). *p<0.005 as compared to CK.
|
Next, we determined that the inhibitory effects of CK and M4 on IGABA were independent of the membrane holding potential (Fig. 4). At membrane holding potentials of -120, -90, -60, and -30 mV, CK inhibited IGABA by 27.9±2.9%, 28.9±2.1%, 27.1±3.7%, and 30.6±3.5%, respectively (n=9~12, from 3 different frogs). M4 also inhibited IGABA by 47.1±3.7%, 46.8±2.0%, 42.4±4.1%, and 46.7±2.6%, respectively (n=9~12, from 3 different frogs), indicating that CK or M4 action on IGABA is not dependent on membrane holding potentials.
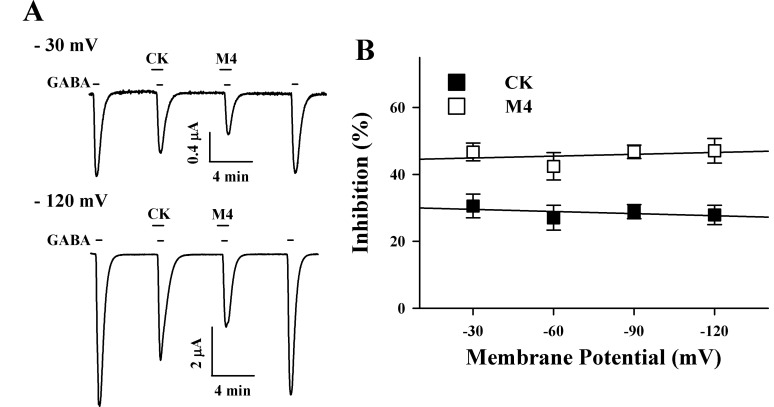 | Fig. 4Voltage-independent inhibition by CK and M4. (A) GABA (2 µM) was first applied and pre-treatment of CK (100 µM) or M4 (100 µM) before GABA application inhibited IGABA in oocytes expressing ρ1 GABAC receptors. The inhibitory degrees were very similar at -30 mV and -120 mV of membrane potential. (B) Voltage-independent inhibition of IGABA in GABAC receptors by CK and M4. Values were obtained from the receptors in the absence or presence of 100 µM CK and M4 at the indicated membrane holding potentials. The observed effects of CK and M4 were correlated with membrane potential. No significant effects were noted for CK (r2=0.28, p>0.31) and M4 (r2=0.10, p>0.44).
|
In experiments exploring current-voltage, the membrane potential was held at -80 mV, and a voltage ramp was applied from -100 to +40 mV for 300 ms. Leakage correction was executed by subtraction of the I~V curve obtained by the same voltage protocol before the application of GABA. In the absence of GABA, the inward current at -100 mV was <0.3 µA, and the outward current at +40 mV was 0.3~0.5 µA. The addition of GABA to the bathing medium resulted in an increase in the inward current at a potential more negative than -20 mV. In contrast, at a potential more positive than -20 mV, GABA caused a large increase in the outward current. Pre-treatment of GABA with CK or M4 inhibited both inward and outward currents as compared with those induced by GABA treatment alone. The reversal potential was near -20 mV in GABA alone and in GABA plus CK or M4, which indicates that GABA induces the CI- current [19]. Additionally, pre-treatment of CK or M4 with GABA did not affect the channel properties of the GABAC receptor (Fig. 5A). To further study the mechanism by which CK or M4 inhibits IGABA, we analyzed the effect of 100 µM CK or M4 on IGABA evoked by different GABA concentrations (Fig. 5B). Pre-treatment of CK and M4 with different concentrations of GABA did not significantly shift the dose-response curve of GABA to the right (p>0.05 compared to GABA alone). The ED50 values were 2.70±0.21, 3.02±0.29 and 3.12±0.42 µM for GABA alone, GABA+CK, and GABA+M4, respectively, and the Hill coefficients were 1.37, 1.34, and 1.28, respectively. Thus, CK and M4 significantly inhibited IGABA elicited by 3, 10, and 30 µM of GABA, independent of the GABA concentration in oocytes expressing the GABAC receptors, indicating that CK and M4 regulate GABAC receptor channel activity in a non-competitive manner (n=8~12 from 3 different frogs; Fig. 5B).
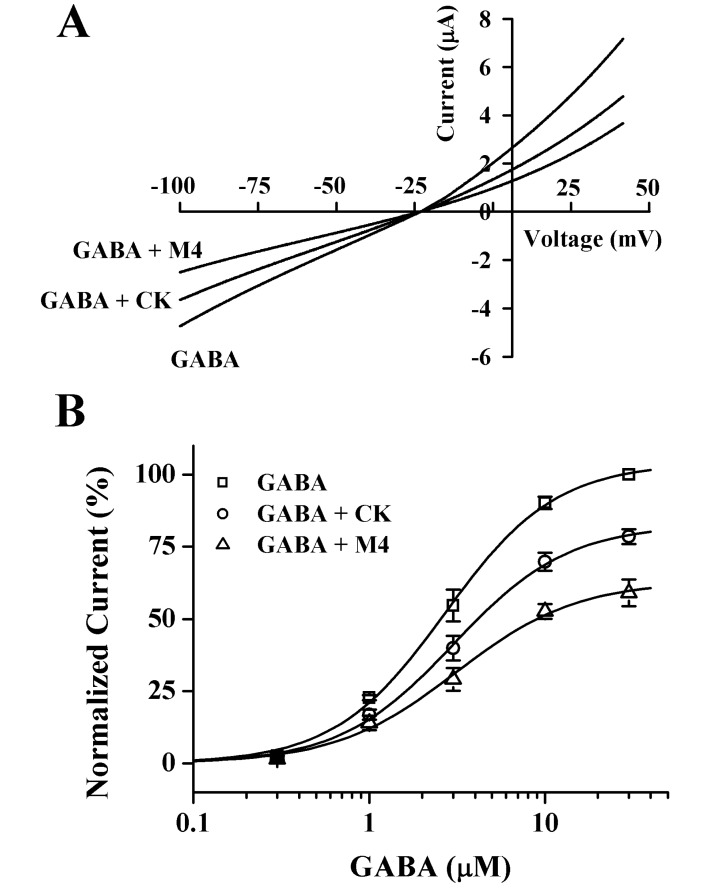 | Fig. 5Current-voltage relationships and concentration-dependent effects of GABA on CK- and M4-mediated inhibition of IGABA. (A) Current-voltage relationships of IGABA inhibition by CK and M4 in GABAC receptors. Representative current-voltage relationships were obtained using voltage ramps of -100 to +40 mV for 300 ms at a holding potential of -80 mV. Voltage steps were applied before and after application of 2 µM GABA in the absence or presence of 100 µM CK and M4. (B) Concentration-response relationships for GABA in GABAC receptors with GABA applied (0.3~30 µM) alone or with GABA plus pre-treatment of 100 µM CK and M4 before GABA application. IGABA of oocytes expressing the GABAC receptors was measured using the indicated concentration of GABA in the absence (□) or presence (○) of 100 µM CK or presence (△) of 100 µM M4. Oocytes were voltage-clamped at a holding potential of -80 mV. Each point represents the mean±S.E.M. (n=8~12/group).
|
Go to :
DISCUSSION
Ginsenosides consist of aglycone and carbohydrate sections. The aglycone is the backbone of the ginsenoside, with a hydrophobic four-ring steroid-like structure that may be non-polar, whereas the carbohydrates on carbon-3, 6, and 20 of the backbone are polar (Fig. 1A). Therefore, ginsenosides are amphiphilic molecules. In vitro and in vivo studies have shown that ginsenosides administered via the oral route were metabolized, and they ultimately become an agylcone such as CK and M4 [4]. Previous studies also showed that ginsenosides and ginsenoside metabolites regulated GABAA receptor activity [17,18]. However, relatively little is known regarding how ginsenoside metabolites regulate GABAC receptor ion channel activity.
In the present study, we investigated the effects of ginsenoside metabolites, CK and M4, on human GABAC receptors heterologously expressed in Xenopus oocytes. We found that (1) co- or pre-treatment with M4 rather than CK induced a large inhibition of IGABA in a reversible manner, (2) pre-treatment of CK or M4 inhibited IGABA in oocytes expressing GABAC receptors dependent on concentration, and (3) inhibition of IGABA by pre-treatment of CK or M4 occurred in a membrane holding potential-independent and non-competitive manner in oocytes expressing GABAC receptors. These results indicate that the ginsenoside metabolites, CK and M4, may be novel GABAC receptor regulators.
GABA is one of the major inhibitory neurotransmitters in the mammalian brain, and it has long been known that many neuroactive drugs such as benzodiazepines, nonbenzodiazepines, barbiturates, ethanol, neuroactive steroids, anaesthetics, and picrotoxin, interact with GABAA receptors by binding to modulatory sites of the receptor [12]. However, GABAC receptors are not sensitive to the GABAA receptor antagonist bicuculline and are not modulated by GABAA receptor modulators such as benzodiazepines and barbiturates [11,20,21]. GABAA receptors are generally composed of heteropentameric ion channels, whereas GABAC receptors can form homopentameric ion channels by ρ subunits [20]. The GABAC receptor is predominantly expressed in retinal bipolar cells [12,13].
In previous studies, we have shown that the ginsenoside Rc enhanced IGABA [17], whereas M4 and PPD showed inhibitory effects on IGABA in oocytes expressing GABAA receptors [18]. Similarly, we have also demonstrated that CK, but not M4, inhibited a neuronal Na+ (Nav1.2) channel [22]. We reported that M4, but not CK, displayed an inhibitory effect on 5-HT3A receptor-mediated currents [23]. Recently, we also reported that although PPD itself had no effects on human HERG K+ channel activity, it inhibited ginsenoside Rg3-mediated decelerating effects on HERG K+ channel currents [24]. In the present study, we found that M4 inhibited GABAC receptor-mediated ion currents more strongly than CK did. The previous and present findings indicate that ginsenoside metabolites as well as ginsenosides themselves have regulatory effects on ligand-gated ion channels and voltage-gated ion channel activity but they show differential effects on the regulation of ligand-gated ion channels and voltage-gated ion channel activity.
Interestingly, the inhibitory effect of CK or M4 was stronger with pre-application of CK or M4 than with co-application with GABA (Fig. 2), indicating that it is possible that the CK- or M4-mediated regulation of GABAC receptor may be indirectly achieved through phosphorylation of the GABAC receptor, as Feigenspan and Bormann reported that the GABAC receptor is regulated by GTP binding protein-coupled receptors [25]. However, ginsenoside metabolite action on GABAC receptor channel activity was not sensitive to staurosporine, a protein kinase C inhibitor (data not shown), indicating that CK- or M4-mediated regulation of GABAC receptor involves mechanism(s) besides activation of GTP binding protein-coupled receptors (data not shown).
It is unclear from the present results exactly how CK and M4 act to inhibit IGABA. Though CK and M4 do not have charges, one possible mechanism is that CK and M4 may act as open channel blockers of the GABAC receptor. However, the inhibitory effect of CK and M4 on IGABA was not voltage-dependent, as shown by the linear regression analysis (Fig. 4). These results suggest that CK and M4 may not be open channel blockers because common open channel blockers are strongly voltage-dependent [26]. Another possibility is that CK and M4 may act as competitive inhibitors by inhibiting GABA binding to its binding site(s) in GABAC receptors. In competition experiments, we observed that the inhibitory effects of CK and M4 on IGABA were not affected by increasing concentrations of GABA without changing the Hill coefficient (Fig. 5). Thus, these results indicate that CK or M4 interaction site(s) with the GABAC receptor might not be related to GABA-binding sites, which is similar to results obtained from other ligand-gated ion channels [27-29]. However, though the chemical structure of CK with a glucose at carbon-20 is different from that of M4 (Fig. 1), their regulatory patterns on GABAC receptor channel activity are very similar with slightly different IC50 values (Fig. 3). These results indicate that the aglycone rather than the carbohydrate portion of CK might play a major role in the regulation of GABAC receptors.
Currently, there are only limited reports on the effects of ginseng on vision. For example, the administration of red ginseng extract to bullfrog improves visual processes by increasing both dark-adapted and light-adapted peak amplitude, as recorded by the electroretinogram [30]. An herbal mixture, including ginseng extract, increased the survival and regeneration of axotomized retinal ganglion cells [31]. Ginseng extract also exhibited ameliorating effects on diabetic-induced retinopathy [32]. Thus, it is likely that ginseng extract may have beneficial effects on visual systems in both normal and pathological conditions. In the present study, we found that ginsenoside metabolites affect GABAC receptor channel activity. It is known that inhibition of GABAC receptor channel activity is closely related to the regulation of vision in retinal bipolar cells [13]. However, we currently do not know whether CK- and M4-induced regulation of GABAC receptor channel activity could be responsible for the beneficial effects exhibited by ginseng extract. Future studies will be needed to elucidate the role of ginsenoside metabolites in the regulation of GABAC receptor channel activity.
In summary, we have examined the effects of ginsenoside metabolites such as CK and M4 heterologously expressed in Xenopus oocytes on human GABAC receptor channel activity. We found that M4, and not CK, mainly inhibits IGABA. Since human GABAC receptor are primarily involved in the modulation of various physiological and pathophysiological activities in the central nervous system, the regulatory effects of M4 on IGABA could provide a molecular basis for the pharmacological actions of ginsenoside metabolites in the nervous system, including the visual system.
Go to :
 XML Download