

 PDF
PDF ePub
ePub Citation
 Print
Print


INTRODUCTION
The most considerable concern about the new drugs is cardiovascular toxicity including tachycardia, QT prolongation, and hypertension. Specially, QT prolongation is associated with potentially fatal, cardiac arrhythmia termed Torsade de Pointes (TdP) [1,2].
It is well known that some psychotropic drugs, including neuroleptics, antipsychotics, antidepressants, stimulants, and antianxiety agents, can be associated with risks of cardiac arrhythmia and sudden death [3]. The common tricyclic antidepressants (TCAs) such as imipramine and amitriptyline exert a significant increase in QT variability that is associated with ventricular arrhythmia [4-6]. Newer compounds, such as selective serotonin reuptake inhibitors (SSRIs) have been reported to have a more benign cardiovascular profile, otherwise fluvoxamine have been reported to prolong QT, even at therapeutic doses [7]. In the perfused rat hearts, SSRIs presented undesired effects on the contractility [8] that may be induced by the inhibition of L-type Ca2+ and transient outward K+ currents of ventricular myocytes [9].
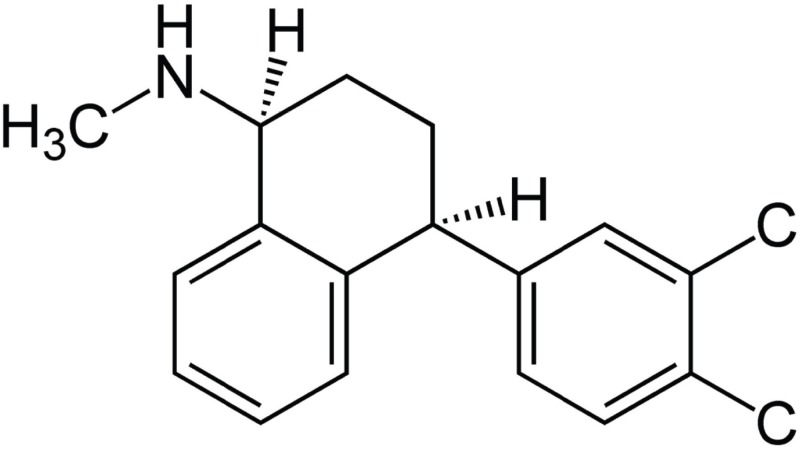
Sertraline is a commonly used antidepressant of the SSRI class (Fig. 1). It was investigated that sertraline had no significant effect on cardiac function like as RR, PR, QRS, and QT intervals in an adult outpatient population (n=1,048) [10]. Whereas previous studies did not reveal any QT prolongation as a side-effect of sertraline, some reports released recently suggests it may have this potential [11]. The sudden cardiac death is also reported in patient taking clozapine and sertraline together [12].
Many antidepressants, especially TCAs can modulate the cardiac action potential (AP) by blocking different cardiac ion channels present in ventricular myocytes. There are various ion channels involved in both the depolarization and repolarization of AP: the inward sodium channel current (INa), the inward Ca2+ channel current (ICa), and several types of outward potassium channels, such as the rapid and slow components of outward delayed rectifier potassium channel currents (IKr and IKs, respectively), the inward rectifying potassium channel current (IK1). Among these potassium channels, the human ether-a-go-go-related gene (hERG) channels conducting IKr is mainly responsible for cardiac repolarization [13,14].
To our knowledge, there is no report investigating the effect of sertraline on various cardiac ion channels. In the present study, we investigated the effect of sertraline on the major cardiac ion channels, such as hERG, IKs, IK1, INa and ICa to evaluate the potential effects of the drug on cardiac repolarization.
Go to : 
METHODS
Reagents
Sertraline and all compounds used to prepare external and internal solutions were purchased from Sigma-Aldrich (MO, USA).
The stock solutions of sertraline were prepared using ethyl alcohol (EtOH), aliquoted and stored frozen. Test concentrations were prepared fresh daily by diluting stock solutions into normal Tyrode (NT) solution. The concentration of EtOH in Tyrode's solution was always kept at 0.1%.
Solutions
The external solution for recording the IKr, IKs and INa channel currents was NT solution as follows (in mM):143 NaCl, 5.4 KCl, 1.8 CaCl2, 0.5 MgCl2, 5 HEPES (4-(2-hydroxyethyl)-1-piperazineethanesulfonic acid ), 0.33 NaH2PO4 and 16.6 glucose (pH adjusted to 7.4 with NaOH). The internal solution for IKr contained the following (in mM):130 KCl, 5 ethylene glycol tetraacetic (EGTA), 10 HEPES, 1 MgCl2, 5 Mg-ATP (pH adjusted 7.25 with KOH), and for IKs in the KCNQ1/KCNE1-cotransfected Human Embryonic Kidney 293 (HEK293) cells, 150 KCl, 5 EGTA, 10 HEPES, 2 MgCl2, 1 CaCl2 and 5 Na2-ATP (pH adjusted 7.25 with KOH). The internal solution for IK1 in KCNJ2-transfected HEK293 cells contained (in mM): 130 K-Asp, 15 KCl, 10 HEPES, 1 MgCl2, 5 Na2-ATP, 5 EGTA (pH adjusted 7.25 with KOH), and for the INa in SCN5A-transfected HEK293 cells, 105 CsF, 35 NaCl, 10 EGTA, 10 HEPES (pH adjusted to 7.25 with NaOH). The ICa was measured in native rat ventricular myocytes, cells were superperfused with an external solution that consisted of (in mM):137 cholin-Cl, 5 CsCl, 0.5 MgCl2, 2, 4-Aminopyridine (4-AP), 10 HEPES, 10 glucose and 1.8 CaCl2 (pH adjusted to 7.4 with NaOH), whereas the solution used to fill the pipette had the following ionic solution (in mM):20 CsCl, 100 Cs-Asp, 10 EGTA, 10 HEPES, 20 TEA-Cl, 5 Mg-ATP (pH adjusted to 7.25 with KOH). Kraft-Bruhe (KB) solution for storage of the freshly isolated rat ventricular myocytes contained (in mM):70 K-glutamate, 55 KCl, 10 HEPES, 3 MgCl2, 20 taurine, 20 KH2PO4, 0.5 EGTA (adjusted to pH 7.2 with KOH).
Cell preparation
For various aspects of cardiac ion channel study, HEK293 (ATCC, Manassas, VA, USA) cells were transiently transfected through the lipofectamine method [15], using lipofectAmin2000 (Gibco BRL, USA) as transfection reagent according to the manufacturer's instructions. The hERG (the gene corresponding to IKr), KCNQ1/KCNE1 (the gene corresponding to IKs), KCNJ2 (the gene corresponding to IK1) or SCN5A (the gene corresponding to INa) cDNA was co-transfected with Green Fluorescence Protein (GFP), the surface marker protein, to allow assessment of the transfection efficiency. L-type calcium currents were recorded form acutely isolated, enzymatically dispersed rat ventricular myocytes.
Recording of ionic currents
The cells were placed in a recording chamber on the stage of a Nikon inverted microscope (Nikon Instruments Inc., Tokyo, Japan), and continuously perfused (5±1 ml/min) with 37±1℃ bath solution. Ionic currents were recorded in a whole-cell configuration with a standard patch clamp technique [16] using a HEKA EPC8 amplifier (Electronik, Lambrecht, Germany). Data were recorded during the approximately 5 minutes following initial application of the bath solution to verify currents stability. Test drug solutions were subsequently perfused for approximately 5 minutes to achieve steady-state blocks. To investigate the effect of sertraline on the ion channel currents, various concentrations (0.01~30 µM) were tested. Voltage-clamp protocol generation and data acquisition were controlled by computers equipped with an A/D converter, Digidata (Axon Inc., USA) and Rclamp software developed in Seoul National University (Seoul, Korea). The patch pipettes were made from borosilicate glass capillaries (Clark Electromedical Instruments, UK) using a pipette puller (PP-830, Narishige, Japan). Their resistances were 3~4 MΩ when filled with pipette solution. The current signals were filtered at a sampling rate of 5 kHz, and they were low-pass filtered at 1 kHz and stored on computer. All experimental parameters, such as pulse generation and data acquisition, were controlled using the Rclamp software.
Data analysis and statistical test
Data analysis and curve fitting were carried out using GraphPad InStat (GraphPad Software, San Diego, CA) and SigmaPlot 2000 (Systat Software, Inc. San Jose, CA). All data are expressed as mean±SEM and an n indicated number of replicates. Student's t tests or ANOVA were used for statistical comparisons when appropriate, and differences were considered significant when p<0.05, or p<0.01. Current amplitudes were measured before and after application of sertraline. The relative remaining currents were calculated according to the following equation: Initial current amplitude/Current amplitude in the presence of compound=Relative remaining current. Effects were calculated from the results of 4 experiments per concentration of sertraline. Concentration response relations were calculated by a non-linear least squares fit of equation [Hill equation; f=xH/(IC50H+xH); H=Hill coefficient, IC50=IC50, x=concentration, f=inhibition ratio] using the SigmaPlot 2000 program. The half-maximum inhibiting concentration (IC50) was calculated with this function.
Go to :
RESULTS
Effect of sertraline on hERG, IKs, and IK1 currents
Fig. 2 shows the effects of sertraline on hERG K+ channel currents. Voltage-dependent effects of sertraline on hERG channels were determined using the protocol shown in the inset of Fig. 2A. Representative hERG current traces in the absence and presence of sertraline (1 µM) are, respectively, shown in Fig. 2A. Both activating currents measured at the end of the depolarizing step (Fig. 2B) and peak tail current amplitude (Fig. 2C) measured following the step to -40 mV were dramatically reduced by sertraline. As demonstrated in Fig. 2D, sertraline concentration-dependently inhibited hERG channel currents. Sertraline at concentrations of 1, 3, 10, and 30 µM inhibited the IKr amplitude by 7.9±1.9%, 24.2±1.9%, 60.1±2.7%, and 86.4±1.4%, respectively (n=4). A non-linear fitting of the experimental values using Hill's equation revealed the 50% inhibitory concentration (IC50) of sertraline. The IC50 and Hill coefficient were 0.7±0.01 µM and 1.3±0.02, respectively.
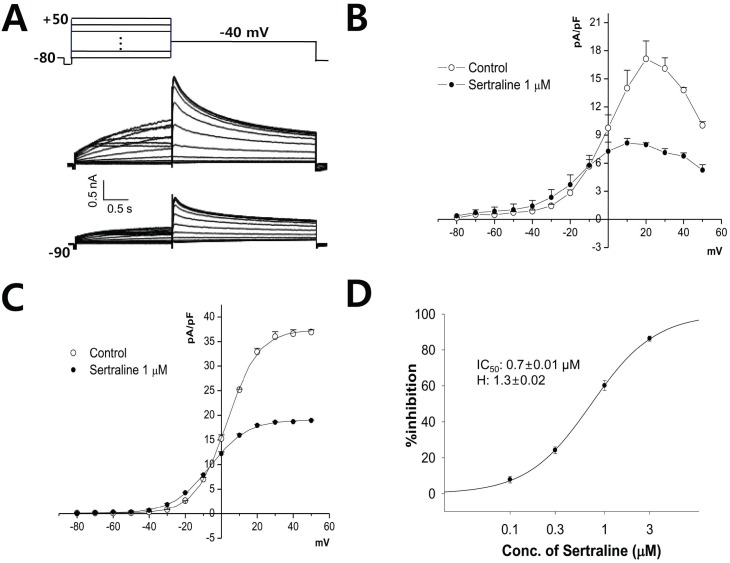 | Fig. 2The effect of sertraline on human ether-a-go-go-related gene (hERG) currents expressed in HEK293 cells. (A) Current responses to step voltage pulses of -80 to +50 mV in 10 mV steps from a holding potential of -80 mV (upper panel). Center: absence of sertraline, control condition; lower: in the presence of 1 µM sertraline. (B) Voltage-relationship of the hERG current measured at the end of depolarizing pulses against the pulse potential in the control and 1 µM sertraline. (C) Voltage-relationship of the tail current measured at its peak just after repolarization in control and after application of 1 µM sertraline. Data were fitted using Boltzmann equation. (D) Dose-response relationship for inhibition of hERG currents by serial application of 0.1, 0.3, 1, and 3 µM sertraline (n=4). The relationship was fitted to a Hill equation. The IC50 and Hill coefficient were 0.7 µM and 1.3, respectively.
|
Fig. 3 shows the effects of sertraline on the slowly activating outward K+ current (IKs) in KCNQ1/KCNE1 cDNA-transfected HEK293 cells. Sertraline inhibited IKs concentration-dependently. Sertraline at concentrations of 1, 3, 10, and 30 µM reduced the IKs amplitude by 1.5±3.8%, 10.3±2.5%, 36.6±3.5%, and 84.0±5.6%, respectively (n=4). The IC50 value calculated from the concentration-response curve was 12.3±1.3 µM, and the Hill coefficient was 2.5±0.1.
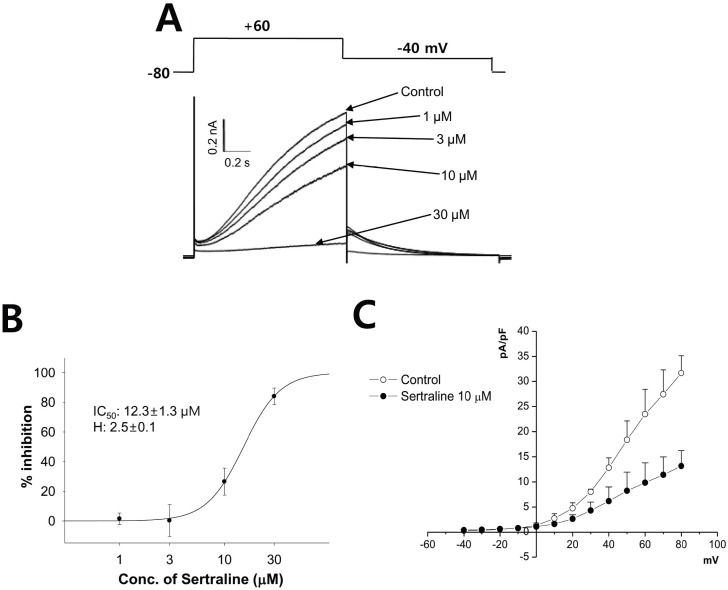 | Fig. 3The effect of sertraline on IKs expressed in HEK293 cells. (A) The cells were depolarized to +60 mV from a holding potential of -80 mV, followed by a 3-s repolarization back to -40 mV (upper). Representative current traces under control condition and after application of 1, 3, 10, and 30 µM sertraline (lower). (B) Concentration response curve for inhibition of IKs by serial application of 1, 3, 10, and 30 µM sertraline. The relationship was fitted to a Hill equation. The IC50 and Hill coefficient were 12.3 µM and 2.5, respectively (n=4). (C) Voltage-relationship of the peak IKs measured at the end of depolarizing pulses against the pulse potential in the control and 10 µM sertraline (n=4).
|
And we also investigated the effects of sertraline on IK1 in KCNJ2 cDNA-transfected HEK293 cells (Fig. 4). Sertraline at concentrations of 1, 3, 10, and 30 µM reduced the IK1 amplitude by 0.7±2.7%, 9.4±1.1%, 45.7±3.9%, and 92.5± 1.2%, respectively (n=4). The IC50 value calculated from the concentration-response curve was 10.5±0.5 µM, and the Hill coefficient was 2.1±0.2.
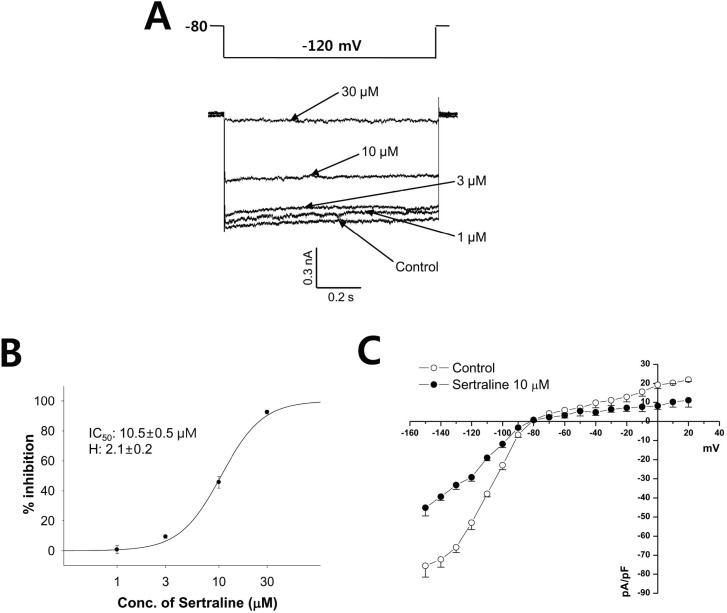 | Fig. 4The effect of sertraline on IK1 expressed in HEK293 cells. (A) The IK1 was elicited by the voltage of a one-step pulse (lasting 1 s) from -80 mV to -120 mV (upper). Representative current traces under control condition and after application of 1, 3, 10, and 30 µM sertraline (lower). (B) Concentration response curve for inhibition of IK1 by serial application of 1, 3, 10, and 30 µM sertraline. The relationship was fitted to a Hill equation. The IC50 and Hill coefficient were 10.5 µM and 2.1, respectively (n=4). (C) Voltage-relationship of the IK1 measured at the end of hyperpolarizing pulses against the pulse potential in the control and 10 µM sertraline (n=4).
|
Effect of sertraline on INa
Fig. 5 shows the inhibitory effect of sertraline on INa in SCN5A-transfected HEK293 cells. Sertraline at concentrations of 0.1, 1, 3, and 10 µM reduced the INa amplitude by 12.8±1.8%, 19.5±3.6%, 33.9±5.0%, and 62.0±7.6%, respectively (n=4). The IC50 value calculated from the concentration-response curve was 6.1±1.7 µM, and the Hill coefficient was 0.7±0.2 (Fig. 5B). Fig. 5C demonstrated the current-voltage relationship (I-V curve) of INa in the contro1 and presence of 3 µM sertraline. Sertraline exerted a concentration-dependent inhibition of INa. The peak amplitidude was observed similary observed at around -50 mV.
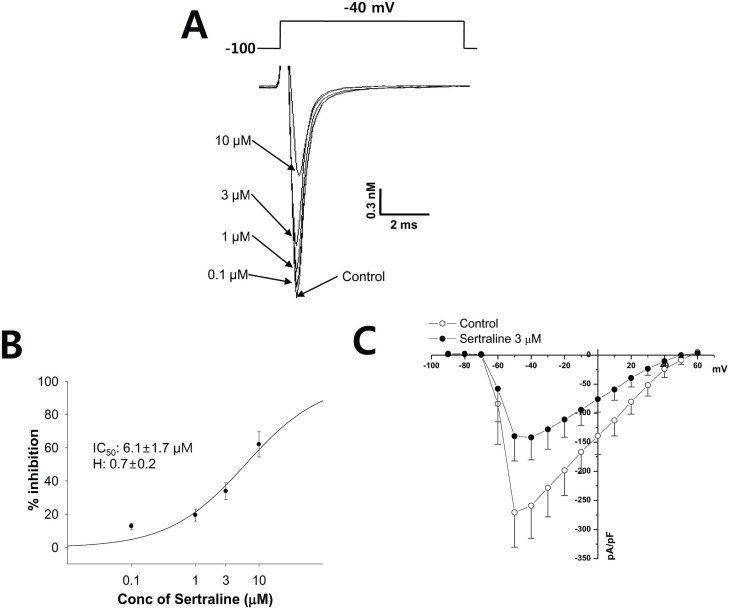 | Fig. 5The effect of sertraline on INa expressed in HEK293 cells. (A) The peak inward INa was generated by pulses of 20 ms duration to -40 mV from a holding potential of -100 mV delivered at a frequency of 10 Hz (upper). Representative current traces under control condition and after application of 0.1, 1, 3, and 10 µM sertraline (lower). (B) Concentration response curve for inhibition of INa by serial application of 0.1, 1, 3, and 10 µM sertraline. The relationship was fitted to a Hill equation. The IC50 and Hill coefficient were 6.1 µM and 0.7, respectively (n=4). (C) Voltage-relationship of the INa measured at its peak just after depolarization pulse against the pulse potential in the control and 3 µM sertraline.
|
Effect of sertraline on ICa
Fig. 6 shows the effects of sertraline on the ICa in freshly isolated rat ventricular myocytes. Sertraline at concentrations of 1, 3, 10, and 30 µM reduced the ICa amplitude by 6.7±3.5%, 18.6±3.6%, 53.5±4.1%, and 99.4±5.2%, respectively (n=4). The IC50 value calculated from the concentration-response curve was 2.6±0.4 µM, and the Hill coefficient was 1.9±0.5 (Fig. 6B).
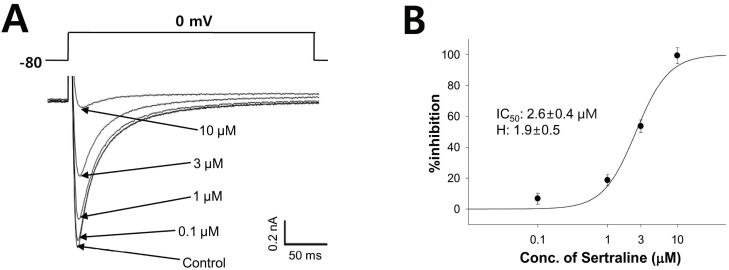 | Fig. 6The effect of sertraline on ICa in rat ventricular myocytes. (A) The peak of the ICa was induced by a single 500 ms voltage pulse to 0 mV from the holding potential of -80 mV (upper). Representative current traces under control condition and after application of 0.1, 1, 3, and 10 µM sertraline (lower). (B) Concentration response curve for inhibition of ICa by serial application of 0.1, 1, 3, and 10 µM sertraline. The relationship was fitted to a Hill equation. The IC50 and Hill coefficient were 2.6 µM and 1.9, respectively (n=4).
|
Go to :
DISCUSSION
The use of SSRIs has increased dramatically [17], because of their superior safety profile compared to TCAs [18]. Several studies have shown that the SSRIs affected various ion channels including volume-regulated anion channels (VRAC) in endothelial cells [19], rat Nav1.4 (encoded by SCN4A both in GH3 cells and heterologously expressed in HEK293) [20], and G protein-activated inwardly rectifying K+ (GIRK) channels expressed in Xenopus oocyte [21].
In the present study, we investigated the effect of sertraline on hERG (for IKr), KCNQ1/KCNE1 (for IKs), KCNJ2 (for IK1), and SCN5A cDNA-transfected HEK293 cells and native rat ventricular myocyte for L-type calcium currents (ICa). All potassium channel currents tested in this study were inhibited by sertraline in concentration-dependent manner. Sertraline is a potent blocker of hERG current with an IC50 of 0.7 µM (Fig. 2), and of IKs (Fig. 3) and IK1 (Fig. 4) as well. The rank order of potency was hERG>IK1>IKs with IC50 values of 0.7, 10.5, and 15.2 µM, respectively.
It is well known that K+ channels play an important role in the repolarization of mammalian cardiac action potential in different species, including human. Specially, hERG channel current, mediating the rapidly activating delayed rectifier K+ current (IKr) in the heart [22], has a key role in repolarization of the cardiac action potential and in controlling action potential duration. Following multiple oral once-daily doses of 200 mg, the mean peak plasma concentration (Cmax) of sertraline is 0.19 µg/ml, approximately 0.6 µM [23]. This value is similar with the IC50 value of the hERG on our study. A 30-fold margin between the effective therapeutic plasma concentration and the IC50 value for IKr block has been suggested as margin of safety relative to the risk of TdP for all drugs with IKr-blocking properties [24]. In this respect, potentially harmful effect of sertraline on cardiac action potential should be considered afterwards.
It is well known that the congenital dysfunction of IKs caused by genetic mutations in the KCNQ1 or KCNE1 gene is linked to congenital long QT syndrome subtype LQT1 or LQT5 [25]. Electrical remodeling in the diseased hearts, like as myocardial infarction [26], chronic heart failure [27], and cardiac hypertrophy [28], is often linked with a reduction of IKs. In case of IK1, the IK1-related heart rhythm disturbances also known [29] but it's less prevalent than those associated with IKr or IKs.
In addition to K+ channels, sertraline also inhibited INa and ICa, and the IC50 value is 6.1 and 2.6 µM, respectively. Because the voltage-gated sodium channel is important to the upstroke phase of the action potential in most excitable cells, the malfunction of the INa cause inherited arrhythmogenic syndromes including long QT syndrome subtype 3 (LQT3), Brugada syndrome, and several cardiac conduction defects (CCD) [30]. Cardiac L-type calcium channel mutations can also induce severe arrhythmic disorder [31].
Although SSRIs (e.g. fluoxetine, fluvoxamine, paroxetine, sertraline, citalopram, and venlafaxin) are considered to be free from the cardiotoxicity, there are increasing number of case reports on various arrhythmias and syncope associated with the use of SSRIs including sertraline [32-35]. The study with spontaneously beating isolated guinea-pig atria, the sertraline caused a dose-dependent decrease in the rate contractions and in the contractile force, which decreased ouabain-induced arrhythmia [36]. According to our present result, this effect probably owes to the inhibition of cardiac Na+ and Ca2+ channels.
When ECG effects of sertraline were investigated in an adult outpatient population, sertraline had no significant effect on the parameters such as RR, PR, QRS, and QT intervals [10]. However, several reports have shown clinically significant QT prolongation during sertraline therapy [37,38]. Recently, the case report for QT interval prolongation after an overdose of sertraline was released [31]. In addition, cardiac arrest [39] and tachycardia [40] during sertaline therapy was also reported on several case.
According to this investigation, the QT prolongation and sudden cardiac death can be induced by the effect of sertraline on several major ion channel of involving cardiac repolarization. Cardiac action potential was made by net of the various ion channels like as K+ channel terminating action potential duration and Na+ or Ca2+ channels prolonging the action potential duration. Some drugs modified these ion channels could induce change of the cardiac action potential duration and QT interval, resulted in cardiac arrhythmia. However, interactions with multiple cardiac ion channels can either enhance or compromise the prolongation of action potential duration and QT. Therefore, in general, an integrated assessment of in vitro and in vivo data is required in order to predict the ventricular arrhythmogenic risk of a new drug candidate in humans.
Taken together with previous in vivo data, the contribution of the inhibitory effects of sertraline on cardiac ion channels to the therapeutic action of sertraline cannot be excluded. Therefore, the patients taking sertraline especially with risks of long QT syndrome should be cautiously monitored for clinical signs of cardiac arrhythmia.
Go to :
 XML Download