

 PDF
PDF ePub
ePub Citation
 Print
Print


INTRODUCTION
β-glucan is a polysaccharide complex derived from a number of different sources, including bacterial cell walls, mushrooms, and seaweeds. Glucans are a heterogeneous group of glucose polymers with different structures that have various activities, including the enhancement of phagocytosis, cytotoxicity of leukocytes, and antimicrobial activities via multiple mechanisms [1,2].
The spleen is a secondary lymphoid organ that plays a major role in processing blood-originated antigens. In addition, it protects the host from systemic infections. Splenocytes consist of CD4+, CD8+ T lymphocytes, CD19+ B lymphocytes, natural killer cells, and antigen-presenting cells, such as macrophage and dendritic cells.
Previous studies have demonstrated the biological effects of β-glucan purified from Paenibacillus (P.) polymyxa JB115 (β-glucan). It induces the activation of macrophages with the production of nitric oxide [3,4] and the maturation of dendritic cells [5]. However, its effects on splenocytes have not been elucidated. Considering the immunostimulatory effects of β-glucan originated from other sources, it is plausible that β-glucan can upregulate the function of splenocytes, a major type of immune cells. Thus we investigated if β-glucan may affect the cell viability, proliferation, and other functions of splenocytes.
Go to : 
METHODS
Animals and reagents
BALB/c mice were purchased from Orient Bio (Republic of Korea) and maintained in our lab animal facility. Female mice (7 to 8 weeks of age) were used in this study. All animal experiments were performed based on the institutional guidelines of Jeju National University for laboratory animal use and care. β-glucan was purified from Paenibacillus (P.) polymyxa JB115 [6].
Preparation and culture of mouse splenocytes
Spleen isolated from BALB/c mouse was mechanically disrupted to get splenocytes as previously described [7]. Specifically, splenocytes were treated with ammonium chloride-potassium (ACK) buffer containing 0.15 M NH4Cl, 10 mM KHCO3, 0.1 mM Na2EDTA to remove red blood cells. Cells were incubated in T-75 culture flasks for 30 min to remove adherent cells. Suspended cells were passed through a cell strainer (cutoff: 40 µm) to obtain single cells. These cells were then cultured in lymphocyte complete medium (RPMI 1640 containing 10% fetal bovine serum [FBS]; 100 IU/ml penicillin/streptomycin; 50 µM 2-mercaptoethanol; 2 mM L-glutamine; 0.1 mM non-essential amino acids; 1 mM sodium pyruvate).
Measurement of the viability and proliferation of splenocytes
Splenocytes were cultured at a concentration of 2×10⁵ cells/200 µl in 96-well culture plates. Cells were treated with 3-[4,5-dimethylthiazol-2-yl]-2,5-diphenyl tetrazolium bromide (MTT; Sigma, [St. Louis, MO]) at 0.5 mg/ml for 4 h. Crystal violet that formed on viable cells was dissolved with a 10% (w/v) sodium dodecyl sulfate (SDS; Sigma) solution. The optical density (O.D.) of each well was measured at 570 nm by a microplate reader (Molecular devices, Sunnyvale, CA) [8]. To measure cell viability, splenocytes treated with or without β-glucan were also stained with a trypan blue solution (Invitrogen, Carlsbad, CA). The numbers of viable and dead cells were counted.
Flow cytometric analysis
Splenocytes were cultured at a concentration of 5×10⁶ cells/5 ml in 6-well culture plates and treated with β-glucan for 3 days. For flow cytometric analysis, cells were stained as described previously [9]. Briefly, splenocytes were treated with 1 µg/sample biotin-labeled anti-CD4, anti-CD8, anti-CD19, anti-CD25 antibody, and either streptavidin-phycoerythrin (PE) or PE-labeled anti-CD69 antibody (all from BD Biosciences, San Jose, CA). To count apoptotic and necrotic cells, the cells were stained using an annexin V-fluorescein isothiocyanate (FITC)/propidium iodide (PI) kit (Biosource International) according to the manufacturer's instructions. For checking the mitochondrial membrane potential [10], cells were incubated with 10 µg/ml Rhodamine 123 (Sigma) for 30 min at room temperature. For measuring cellular proliferation, splenocytes that were treated with or without β-glucan for 2 days were stained with 5 µM carboxyfluorescein diacetate succinimidyl ester (CFSE) for 10 min and then cultured in the presence or absence of IL-2 in 96-well culture plates. All stained cells were analyzed by FACSCalibur™ and CellQuest™ (Beckton Dickinson, Franklin Lakes, NJ).
Enzyme-linked immunosorbent assay (ELISA)
Culture supernatants from treated cells were harvested and used for ELISAs. The amounts of IL-2 and IL-7 in culture supernatants were measured using CytoSet™ kits (Biosource International) according to the manufacturer's instructions. The detection limits of IL-2 and IL-7 ELISA were 20 pg/ml.
Western blot analysis
Splenocytes were grown and treated in 6-well culture plates and prepared for Western blot analysis [11]. Specifically, cells were dissolved in Western blot lysis buffer and protein concentrations were determined using a Bio-Rad protein assay solution. A total of 15 µg of protein was loaded onto each lane in 12% SDS polyacrylamide gels. Proteins blotted on the nitrocellulose membrane were probed with anti-Bcl-2, anti-Bcl-xL, anti-Bax (Santa Cruz Biotechnology, Santa Cruz, CA), or anti-β-actin antibodies (Sigma). Appropriate horseradish peroxidase-labeled secondary antibodies were used for detection. Western blots were developed using a SuperSignal West Pico Chemiluminescent Substrate (Thermo Scientific, Waltham, MA). The density of each band was measured by using 'Image J' program and the ratio to beta-actin was calculated.
Statistical analysis
Data are presented as the mean±standard deviation (SD) and were statistically analyzed using the Tukey-Kramer multiple comparisons test. A p value of <0.05 was considered as statistically significant.
Go to :
RESULTS
The effect of β-glucan on the viability and proliferation of splenocytes
To determine the effects of β-glucan on the viability and proliferation of splenocytes, we performed MTT assays and trypan blue exclusion tests. After 3-day treatments of 0 to 200 ug/ml β-glucan, MTT assays (Fig. 1A) and trypan blue exclusion tests (Fig. 1B) revealed that β-glucan significantly induced higher viability and proliferation than controls over a range of concentrations. The proliferation of splenocytes was significantly induced by β-glucan 50, 100 and 200 µg/ml (O.D. 0.215±0.0200, 0.240±0.0355 and 0.258±0.0025 respectively), compared to the control (O.D. 0.191±0.0051). The viability was more significantly increased by β-glucan 20 and 100 µg/ml (77.1±4.28 and 82.1±2.20% respectively), compared to the control (65.9±4.65%). To determine if a lymphocyte subset preferentially proliferated in β-glucan-treated splenocytes, cells were labeled with surface marker-specific antibodies. Most splenocytes are CD4+, CD8+T lymphocytes and CD19+B lymphocytes. β-glucan treatment did not preferentially alter the proportion of a specific spleen cell subset (Fig. 2).
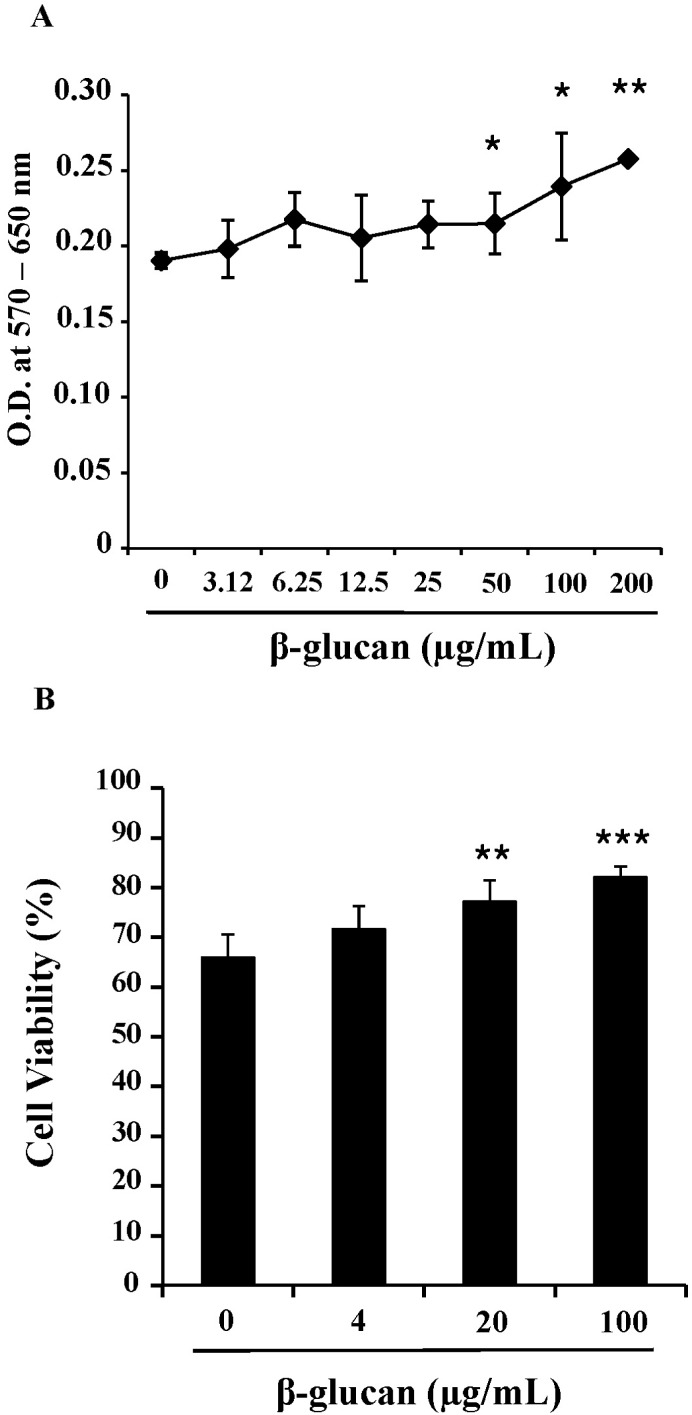 | Fig. 1The enhanced viability and proliferation of splenocytes by β-glucan. The splenocytes were cultured at a concentration of 2×10⁵ cells/200 µl in 96-well culture plates. (A) Splenocytes were treated with 0~200 µg/ml of β-glucan for 3 days and MTT assays were performed. (B) Splenocytes were treated with 0~100 µg/ml of β-glucan for 3 days and trypan blue exclusion tests were performed to count viable/dead cells. *,**,***indicate p<0.05, 0.01, and 0.001, respectively, as compared with the control. Data are mean±SD from three or four individual wells.
|
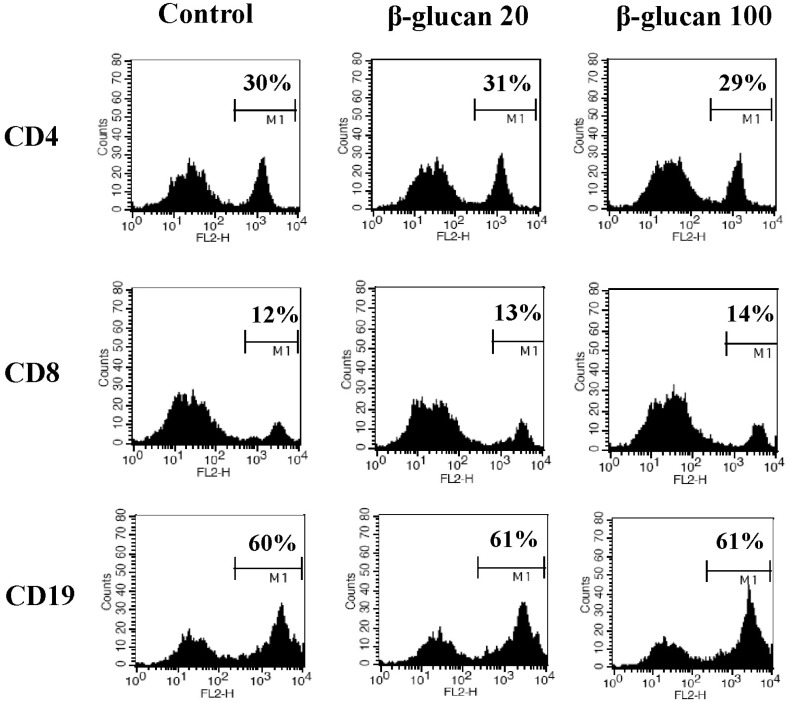 | Fig. 2β-glucan treatment does not alter the proportion of splenic subsets. Splenocytes were treated with 0, 20, or 100 µg/ml for 2 days. The cells were stained for CD4, CD8, and CD19, and analyzed using a flow cytometer. The number in the histograms indicates the percentage of a specific subset. A representative data set is shown from three independent experiments with similar results.
|
β-glucan prevents the spontaneous cell death of splenocytes in cytokine-withdrawal condition
In order to determine if β-glucan treatment altered cell morphology, we analyzed β-glucan-treated cells by flow cytometry. The size of splenocytes treated with β-glucan (FSC/SSC) was slightly enhanced (Fig. 3A). It is generally recognized that splenocytes commence spontaneous cell death after in vitro culture due to cytokine-withdrawal effects [12-14]. We investigated if β-glucan treatment may protect splenocytes from spontaneous cell death. Cells were stained with annexin V-FITC/PI or Rhodamine 123 to measure cell death and mitochondrial membrane potential, respectively. Annexin V positive/PI negative and annexin V positive/PI positive cells represent early and late apoptotic cells, respectively, whereas annexin V negative/PI positive cells represent necrotic cells. The annexin V-FITC/PI staining assay revealed a decrease in cell death (Fig. 3B) and Rhodamine 123 staining confirmed higher mitochondrial membrane potential in β-glucan treated cells compared to control cells (Fig. 3C).
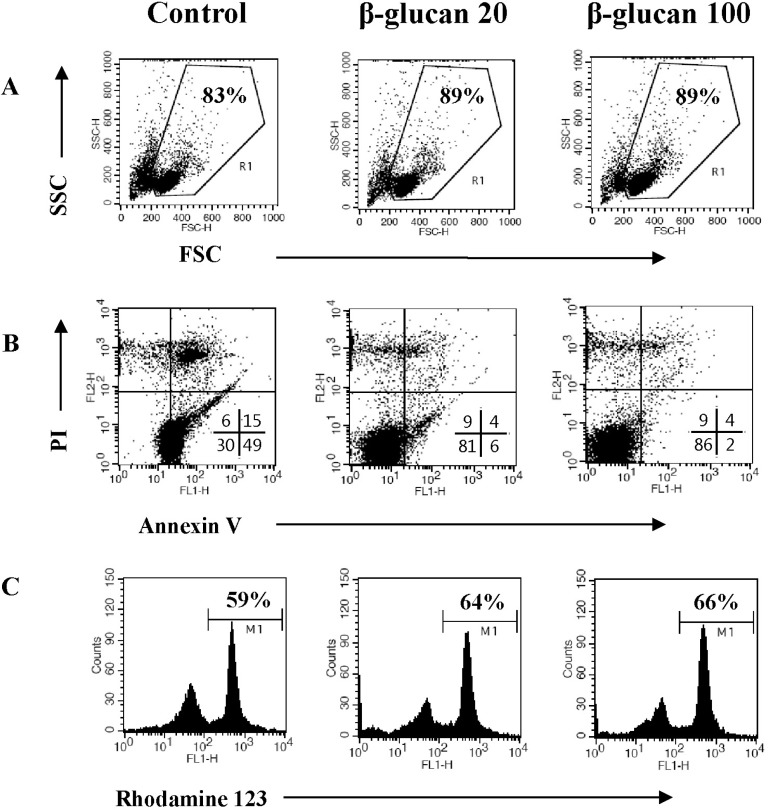 | Fig. 3β-glucan protects splenocytes against spontaneous cell death. Splenocytes were cultured at a concentration of 5×10⁶ cells/5 ml in 6-well culture plates with 0, 20, or 100 µg/ml β-glucan treatment for 2 days. (A) The cell size (FSC/SSC) analysis, (B) annexin V-FITC/PI staining, and (C) Rhodamine 123 staining were performed by a flow cytometer. The number indicates cell percentage (A), the cell percentages in quadrants (B), and the cell percentage with high MFI (C), respectively. Each flow cytometric data set is presented from three independent experiments with similar results.
|
β-glucan treatment alters the expression of apoptosis related molecules in splenocytes
To investigate the mechanistic details of cell survival, the expression of apoptosis-related molecules was examined by Western blot analysis (Fig. 4). The splenocytes treated with β-glucan 20 and 100 µg/ml showed significantly increased expression of Bcl-xL, an anti-apoptotic molecule (0.84±0.355 and 0.93±0.342, respectively), compared to the control (0.65±0.361). And also, the splenocytes treated with β-glucan 4 and 20 µg/ml showed significantly decreased expression of Bax, a pro-apoptotic molecule (0.56±0.047 and 0.49±0.066, respectively), compared to the control (0.74±0.057). Both molecules are well known to be related to mitochondria-involved apoptosis.
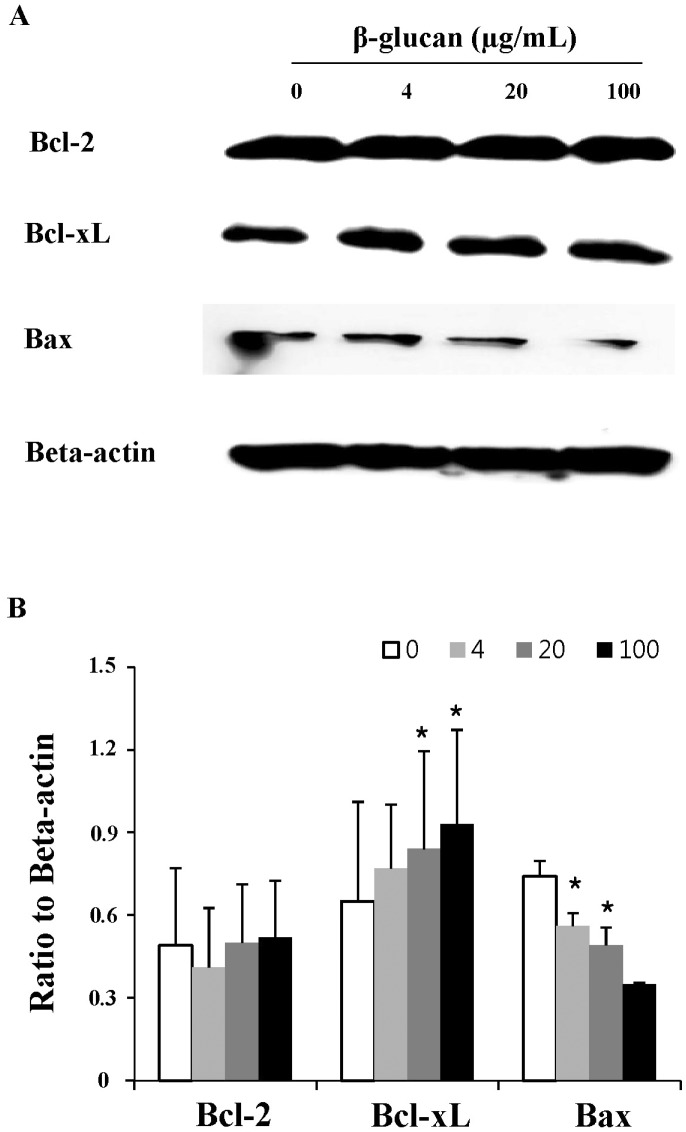 | Fig. 4The altered expression of apoptosis-related molecules in β-glucan-treated splenocytes. Splenocytes were treated as described in Fig. 3 and the cell lysates were prepared for Western blot analysis. A representative image set was selected from two independent experiments with similar results (A). After measuring band densities, the ratio of each band to beta-actin was calculated (B).
|
The induction of IL-7 production in β-glucan treated splenocytes
To further understand the mechanism underlying enhanced cell viability and proliferation, cytokine production in β-glucan-treated splenocytes was measured. IL-2 and IL-7 are essential cytokines that regulate lymphocyte proliferation and survival. ELISA analysis showed that splenocytes treated with β-glucan 20 and 100 µg/ml produced significantly more IL-7 (49.5±15.48 and 94.8±47.12 pg/ml) than the control (14.3±10.61 pg/ml), but not IL-2 (Fig. 5).
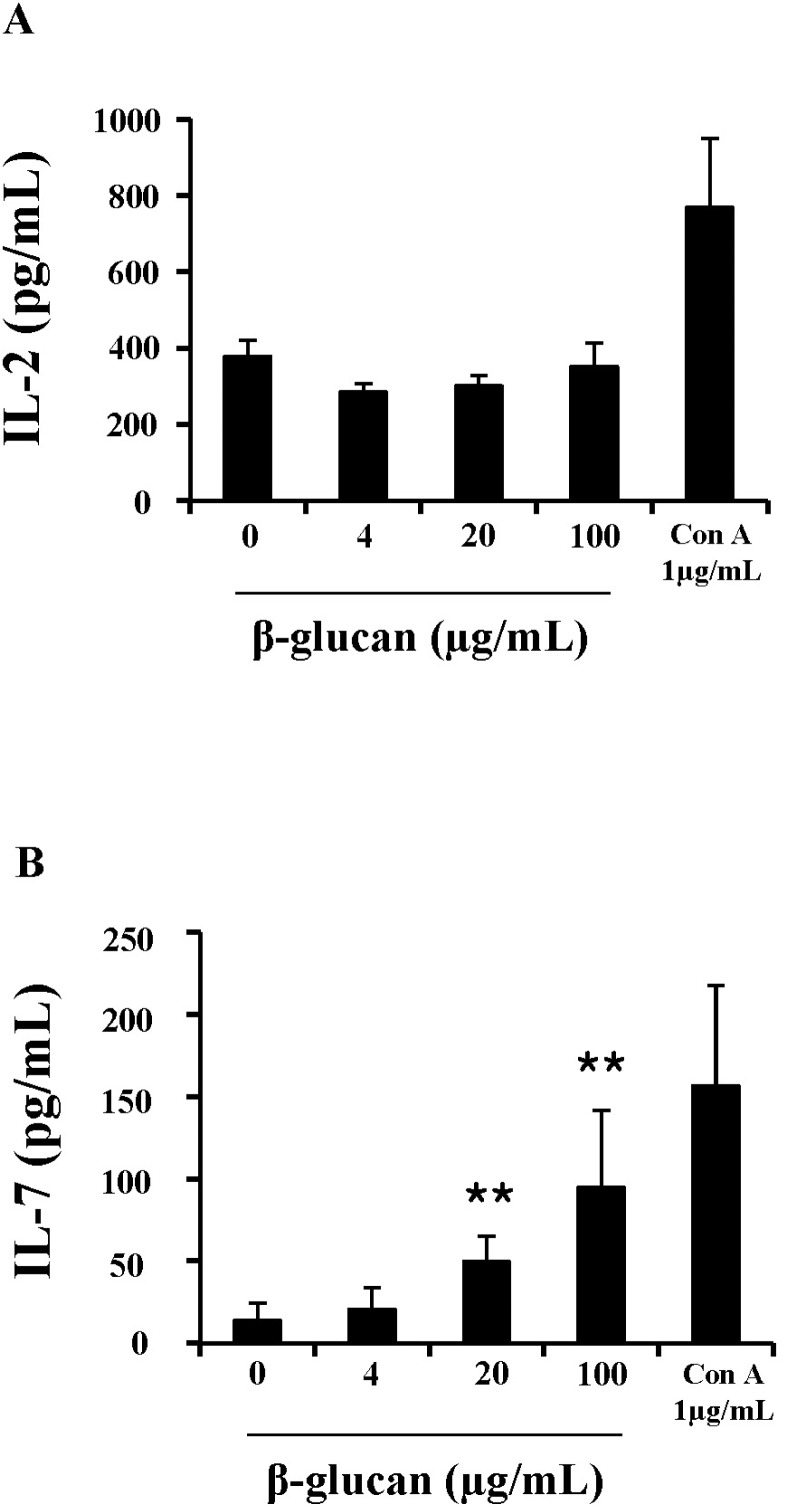 | Fig. 5β-glucan induces the production of IL-7 in splenocytes. Cells were treated in 96-well plates and their supernatants were used for ELISA analysis to determine IL-2 (A), IL-7 (B) concentrations. **indicates p<0.01 compared to control. Data presented is from three independent experiments with similar results.
|
β-glucan activated splenocytes respond to IL-2 dependency
In order to serve as effector immune cells, lymphocytes undergo clonal expansion. Lymphocyte responsiveness to IL-2 is critical for clonal expansion [15,16]. We hypothesized that β-glucan treatment might alter lymphocyte dependency on IL-2 for clonal expansion. First, we analyzed the expression the activation markers, CD25 and CD69 [17] on β-glucan-treated splenocytes. CD25 is the alpha chain of the IL-2 receptor. CD25 makes lymphocytes highly sensitive to IL-2. Flow cytometric analysis revealed that β-glucan enhanced the expression of CD25 molecules on the surface of lymphocytes, but did not alter CD69 expression (Fig. 6A). Second, we investigated if β-glucan-treated splenocytes responded to IL-2. After treating splenocytes with β-glucan for 2 days, treated cells were cultured in the presence or absence of IL-2. Upon IL-2 addition, the cell size of β-glucan-treated splenocytes was larger than control cells (Fig. 6B) and showed lower CFSE intensity, suggestive of a higher proliferation rate (Fig. 6C). These data support that IL-2 dependency of β-glucan-treated splenocytes may be related to the enhancement of CD25 expression.
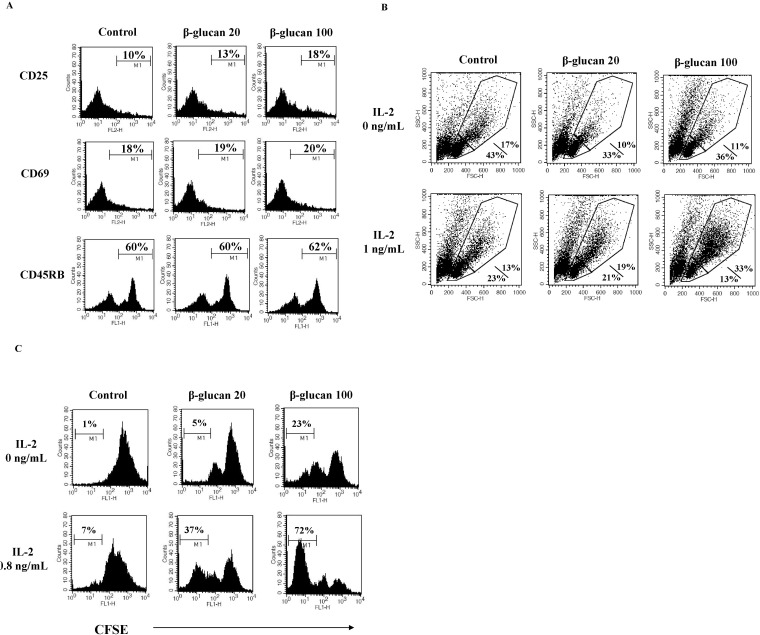 | Fig. 6β-glucan increases spleen cell sensitivity to IL-2. Splenocytes were treated as described in the Methods. Cells were stained for CD25, CD69, or CD45RB (A) and examined using a lymphocyte proliferation assay with CFSE to check IL-2 dependency (B, C). The number indicates the percentage of cells with high MFI (A), the percentage of smaller/bigger cells in treated splenocytes responding to IL-2 (B), and cells with low MFI (C), respectively. A representative data set was selected from three independent experiments with similar results.
|
Go to :
DISCUSSION
β-glucan is a carbohydrate polymer with multiple biological activities, including immunoregulatory function [1]. Although the effects of β-glucan purified from P. polymyxa JB115 (β-glucan) has been investigated in part, there was no available data on splenocytes. Viability and proliferation assays revealed that β-glucan significantly enhanced the viability and proliferation of splenocytes over a range of concentrations. However, FACS analysis revealed no significant alteration in the cellular proportion of splenic subsets. It is thus suggested that β-glucan may not act on the specific type of splenocytes. Without β-glucan treatment, splenocytes showed cytokine withdrawal-induced cell death during in vitro culture, but β-glucan treatment could protect splenocytes from the cell death.
ELISA analysis revealed that β-glucan treatment induced the production of IL-7 in splenocytes, but not IL-2. Both cytokines are essential for the viability and proliferation of lymphocytes and are classified into a group of cytokines whose receptors contain common gamma chains [18]. However, IL-7 is vital for viability, whereas IL-2 is responsible for both viability and proliferation of lymphocytes. Therefore, β-glucan may influence viability of lymphocytes via IL-7 production, causing little or no mitogenic effects.
Previous studies demonstrated that IL-7 is closely related to the maintenance or homeostasis of immune memory cells [19]. We hypothesized that β-glucan can expand or sustain certain immune memory cells. To test this, we measured the expression level of CD45RB on β-glucan-treated splenocytes. It is generally accepted that immune memory cells reduce the expression of CD45RB compared to naïve cells [20]. Flow cytometric analysis showed no significant decrease of CD45RB on treated cells. However, it is possible that 3-day β-glucan treatment was not enough to influence the expression of CD45RB or the generation of memory lymphocytes. The effects of β-glucan administration in vivo should be elucidated in future studies.
Splenic lymphocytes are educated by antigen-presenting cells such as dendritic cells, and are then converted into effector cells. The numbers as well as the functional capabilities of effector cells are essential for generating effective immune responses. The clonal expansion of activated and primed lymphocytes can provide adequate numbers of effector cells and is closely dependent on the surface expression of activation markers such as CD25 [21]. In this study, we detected a consistent increase in CD25 molecules on the surface of β-glucan-treated splenocytes. We also found that β-glucan-treated splenocytes were highly responsive to IL-2. These results provide strong evidence that β-glucan can activate splenic lymphocytes to respond to growth-related cytokines, resulting in the induction of clonal expansion. On the other hand, the expression of CD69 was not increased in same experiments. Considering CD69 as an early activation marker, it is possible that the duration of β-glucan treatment may be optimal for CD25, but too long for CD69.
Taken together, we demonstrated an immunostimulatory effect of β-glucan purified from P. polymyxa JB115 (β-glucan) on mouse splenocytes. β-glucan-treated cells had enhanced viability, were protected against cytokine withdrawal- induced cell death, and were more responsive to IL-2. Natural, biologically active compounds are ideal for clinical purposes due to their low intrinsic toxicities [22,23]. Our data provide valuable information that can be used to broaden the use of β-glucan as a clinically useful natural compound.
Go to :
 XML Download