

 PDF
PDF ePub
ePub Citation
 Print
Print


INTRODUCTION
The nucleus of the solitary tract (NST) is essential as the first central relay of the gustatory system in taste information processing pathway. The taste signals from taste cells on the tongue are transported to the NST through the chorda tympani (CT) and glossopharyngeal nerves [1,2]. Furthermore, visceral taste information is conveyed to the NST from the gastrointestinal tract [3]. This taste signaling to the NST was well verified using c-Fos, an immediate early gene family [4], and electrical recordings [5] for various tastants.
c-Fos-like immunoreactivity (FLI) increases in the NST by various chemicals including general tastants. Carstens et al. [6] reported that stimulation using irritant chemicals (nicotine, capsaicin, histamine, peperine, acetylcoline, and ethanol) increases FLI in the rat NST. Bitter chemicals such as QHCl, denatonium, propylthiouracil increase FLI in rat NST [7]. Yamamoto and Sawa [8] showed that the difference in FLI levels depends on chemicals. For example, most remarkable induction of FLI was observed by stimulation with LiCl, lactose, and ethanol which have been often used as unconditioned stimuli in conditioned taste aversion. Sucrose and maltose induce more FLI than glucose, fructose, and galactose [8]. Meanwhile, sweeteners such as saccharin, glycine, and alanine as well as other basic taste stimuli such as NaCl, HCl, quinine, and umami substances induce relatively low level of FLI in rat NST [8].
The FLI responses to tastants showed topographic patterns in the NST. For example, sucrose stimulation activated FLI which is evenly distributed along the mediolateral axis in the rostral NST [9]. Quinine stimulation induced more FLI in medial subregion in the rat NST but the distributions of FLI are intermingled with sucrose-activated FLI [9]. Along the rostral-caudal axis, FLI induced by quinine stimulation was reduced in rostral regions of the NST [10].
Salt is very important nutrition to keep the body metabolism. Specifically, sodium ion is the major cation of extracellular fluids and essential to keep ions and water homeostasis. Therefore, there is naturally developed salt-sensing system in animals. The salt-sensitive receptors on the tongue are crucial to accept low concentration of sodium as salt appetite [11,12] or to deny high concentration as salt aversion [12,13]. Salt taste stimulation using 0.15 M NaCl was conducted for conditioned taste aversion studies [12,14]. Houpt et al. [15] used 0.3 M NaCl to study sodium depletion effect on the central nervous system. Grancha et al. [16] studied the role of the pontine parabrachial nucleus in conditioned taste aversion using 0.15 M NaCl. In these studies, the main concern was the difference of FLI levels in the specific NST regions before and after taste conditioning. From these studies, it is difficult to discriminate directly the effect of salt taste stimulation on FLI levels in the NST. There were few studies for this issue. Travers and Hu [17] reported an interesting study for the FLI expression following salt taste stimulation in rats NST. The FLI levels for 0.3 M NaCl were not significantly different from control condition using distilled water (DW). The level of FLI was a little lower than control but a little higher than unstimulated condition. Meanwhile, Stratford and Finger [18] recently reported different result while they tested the taste ability of purinergic receptor in mice. The FLI levels following 0.15 M NaCl stimulation were significantly higher than DW and unstimulated condition in the overall NST. The regional difference in FLI levels along the rostral-caudal axis were also reported and salt taste showed higher FLI level. But it is not a direct comparison because they just compared FLI expressions by DW and NaCl stimulation between wild type and purinergic receptor knockout mice. From these two studies, FLI levels along the rostral-caudal axis in the NST are still unclear.
Therefore, the present study was conducted to verify salt concentration-dependent FLI levels in the NST. The FLI levels in the overall NST and six subregions (dorsal/ventral×medial/middle/lateral) of the NST were compared between control (DW) and NaCl solutions with four different concentrations for salt taste stimulations.
METHODS
Animals
All procedures in this study were conformed to guidelines set forth by the National Institute of Health and were approved by the Institutional Animal Care and Use Committee of Yonsei University Health System. Twenty-seven adult Sprague-Dawley rats weighting 270~380 g were used. Rats were housed in plastic cages with a 12:12-h light-dark schedule and given free access to food and water before the taste stimulation study. All stimulation was performed during the light phase.
Tastant stimulation
Rats were anesthetized by intraperitoneal injection of urethane (1.25 g/kg, i.p.). After 30 min, rats were moved to quiet room for tastants stimulation. The rat body was turned left side up to make easy access of pipette to the tongue for tastant solution application. The tail and neck were fixed using tape to prevent body movement during taste stimulation. The tongue was gently pulled out and clamped.
DW for control and NaCl (Duskan Pure Chemicals, Ansan, Korea) solutions with four different concentrations (0.1, 0.3, 0.4 and 1.0 M) was used for a tastant. The NaCl was dissolved in distilled water immediately before experiments. A tastant of 150 µl volumes was dropped to anterior 2/3 portion of the tongue on left side and tried to soak left and right side evenly. After 2 min of tastant application, the applied tastant was washed with DW and excess DW was absorbed using paper tissue gently after 30 sec. This tastant stimulation was performed 8 times with 4 min interval.
c-Fos Immunohistochemistry
After the 1 h poststimulation period, rats were injected with a lethal dose of urethane and perfused through the left ventricle with phosphate-buffered saline (PBS, pH 7.4) and then with 4% paraformaldehyde (PFA). The brain was removed from the skull, postfixed in 4% PFA for overnight. The brain block containing the NST was separated and washed three times for 5 min with PBS and stored in 10%, 20% and 30% sucrose-phosphate buffer (PB, pH 7.4) sequentially at 4℃ overnight.
The brain block was covered entirely with cryo-embedding media (frozen section compound FSC 22, Leica, Wetzlar, Germany) and was frozen completely in -80℃ freezer and stored at -80℃ until ready for sectioning. The coronal sections were cut with 8 µm thickness and 32 µm intervals at -20℃ on a cryotome cryostat. The section was placed onto silane-coated slides glasses (5116-20F, Muto Pure Chemicals CO. LTD, Tokyo, Japan) and stored at -20℃ until ready for c-Fos staining.
Sections were washed three times with 0.02 M PBS and then incubated in PBS containing 0.3% hydrogen peroxide for 5 min to block endogenous peroxidase activity. Sections were then washed three times in PBS for 3 min. We followed the introduction of PK-6200 kit (Vector Laboratories, Burlingame, CA, USA) manual for other staining process. The sections were incubated with PBS-serum solution (PBS 10 ml with 2 drops serum) for 30 min and incubated with PBS containing 0.3% Triton-X, and c-Fos primary antisera (K-25, Santa Cruz Bio, Santa Cruz, CA, USA, diluted 1: 1250; 10 ml PBS+60 µl Trion-X100+8 µl c-Fos) for overnight at 4℃. The sections were then washed three times with PBS for 3 min and incubated with a biotinylated rabbit anti-sheep secondary antibody (Vector Laboratories; 10 ml PBS+2 drops of serum+2 drops of biotinylate solution) for 30 min. The sections were washed three times with PBS for 3 min and incubated for 30 min with PBS containing avidin-biotinylated horseradish peroxidase complex (10 ml PBS+2 drops of A solution+2 drops of B solution). After three times wash with PBS for 3 min, the reaction was visualized using a glucose oxidase-3,3'-diaminobenzidine (DAB) with 5 mg DAB and 5 mg NiCl in 10 ml PBS. The reaction was terminated by washing 3 time with PBS and the reacted section on slides were dehydrated and coverslipped. Photomicrographys were taken with a digital camera (Olympus DP71, Olympus, Victoria, Australia; resolution= 1,036×1,024) with ×40 and ×100 magnification.
Analysis of FLI expression in the NST
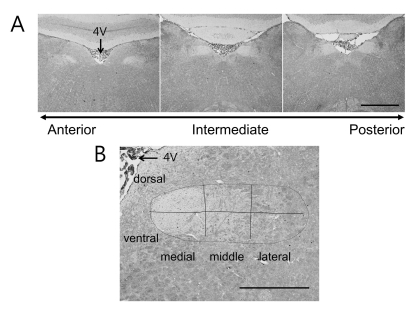
Fig. 1A shows typical coronal sections of the r1 (left), i1 (middle) and i3 (right) areas along the rostral-caudal axis of the NST with ×40 magnification. The arrow in the figure just shows the direction of rostral-caudal axis. The serial sections from each animal need position calibration to compare their FLI levels along the rostral-caudal axis. To calibration the positions of section among animals, the section which showed that the NST meet the fourth ventricle (4V) was positioned as "0" and named i1 area (i: intermediate). If the position of the left and right NST in the same section had different positioning, the calibration was performed separately. The positions of other sections were calculated using their sectioning interval from "0" position. We selected six NST areas along rostral-caudal axis with 200 µm intervals: r1 and r2 to the anterior direction (r: rostral), and i1, i2, i3 and i4 to the posterior direction, here r1 is more rostral than r2, and i4 is more posterior to i1. Each NST had 8~9 serial sections in 200 µm distance and their FLI expressions were averaged to reduce variations of the number of FLI cells, because the FLI cell numbers were not consistent between two serial sections.
The NST in ×100 magnified image was divided into six subregions as described by King et al. [19] in which the nucleus was divided into three equal parts such as medial, middle, and lateral, and two parts such as dorsal and ventral, as depicted in Fig. 1B. To detect FLI-positive cells, we used only NST area encircled with dotted line in Fig. 1B. The background intensity of the NST region was captured and its mean and standard deviations (STD) were calculated. With these two values, the FLI-positive cells were selected if the cell's FLI intensity was bigger than mean+STD×4. This threshold value was chosen to match the FLI cell number with Travers [10] approximately. The brightness and contrast of all images were not adjusted to remove any subjective selection of FLI cells.
RESULTS
Salt taste-induced c-Fos expression in the NST
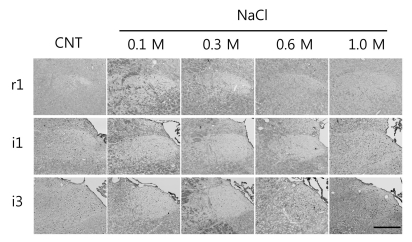
A series of FLI expression images for typical r1, i1, and i3 area are shown in Fig. 2. There was strong tendency that the number of FLI cells is lower in the r1 and r1 area and higher in the i2 and i3 area for all stimulation conditions including DW and four NaCl solutions. The high salt stimulation with 1.0 M NaCl also induced very low FLI in the r1 area. Two moderate salt stimulations with 0.1 and 0.3 M NaCl induced respectively low FLI which was slightly lower than control through all rostral-caudal axis. Meanwhile, FLI responses to 1.0 M NaCl stimulation were higher in the i1 and i3 area than the r1 area. This topographical FLI distribution shows strong tendency of higher FLI toward i3 area.
FLI expression in the overall NST through rostral-caudal axis
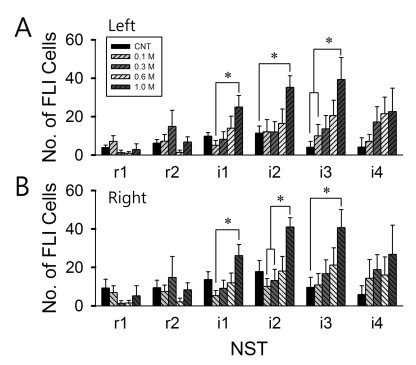
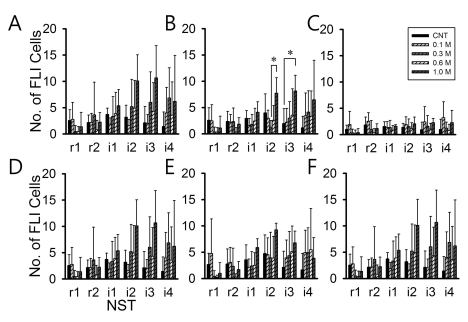
The FLI expression levels in six regions through rostral-caudal axis were plotted in the Fig. 3. There was strong tendency that the FLI cell number increases from r1 to i3 area and reduced toward i4 area for all stimulations. The control stimulation with DW induced maximum FLI level around i2-NST. Meanwhile, 1.0 M NaCl stimulation induced maximum FLI levels in i3 area. This tendency was consistent in both left and right NST. The left i1-NST showed significant difference in FLI cell numbers between 0.1 M and 1.0 M NaCl stimulation (p<0.05). The left i2 area showed significant difference in FLI cell numbers between control (DW) and 1.0 M NaCl stimulation (p<0.05). The left i3 area showed significant difference in FLI cell numbers between control (DW) or 0.1 M NaCl and 1.0 M NaCl stimulation (p<0.05).
As shown in Fig. 3B, the right i1 area showed significant difference in FLI cell numbers between 0.1 M and 1.0 M NaCl stimulation (p<0.05). The right i2-NST showed significant difference in FLI cell numbers between 0.1/0.3 M and 1.0 M NaCl stimulation (p<0.05). The right i3 area showed significant difference in FLI cell numbers between control (DW) and 1.0 M NaCl stimulation (p<0.05). Furthermore, there was a tendency of dose-dependent increase in FLI expression in the left/right i1, i2 and i4 areas but the differences were insignificant.
FLI expression in the subregions of NST along rostral-caudal axis
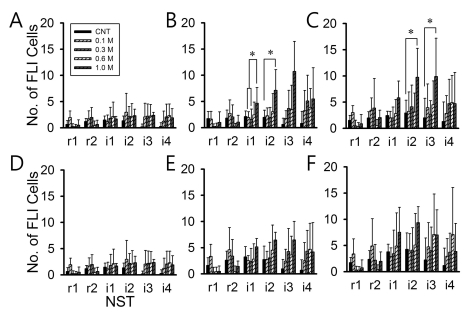
Fig. 4 shows the FLI expression levels in six subregions of the left NST along rostral-caudal axis. There were only two subregions that showed significantly increased FLI expression. The dorsal-middle (Fig. 4B showed increased FLI level between 0.3/0.6 M and 1.0 M NaCl (p<0.05) in the left i1 area and between control (DW) and 1.0 M NaCl (p<0.05) in the left i2-NST. The dorsal-medial subregions (Fig. 4C) showed increased FLI between control (DW) and 1.0 M NaCl in the left i2 area and between control (DW) and 1.0 M NaCl in the left i3 area. There were no significant increases in dorsal-lateral and ventral-lateral/middle/medial subregions. The position difference of maximum FLI level between control and NaCl stimulation was clear in the subregions as in the overall NST including rostral and intermediate NST. In the control, maximum FLI level was observed around i1 area but in the NaCl stimulation it was i2 or i3 area. Therefore, the NST with maximum FLI expression in response to NaCl was located more posterior than control (DW).
The FLI expression levels in six subregions of the right NST through rostral-caudal axis are shown in Fig. 5. The dorsal-middle subregion only showed significantly increased FLI level between 0.3 M and 1.0 M NaCl in the right i2 area (p<0.05) and between control (DW) and 1.0 M NaCl in the right i3 area (p<0.05). The dorsal-middle i2 and i3 areas only increased FLI level significant. The FLI expressions in the right NST in the subregions were different from the left NST.
For cell count, Abercrombie correction factor was calculated using N/n=T/(T+H), here N is real cell number, n is estimated cell number, T is thickness of section, and H is mean height of soma. The length of NST neuron was 11.2±1.9 µm and width was 6.8±1.1 µm. The height of soma was not clear so we used the width instead of height. Applying Abercrombie's calculation for 8 µm section thickness and subtraction the result from one and multiplying by 100 for percentage value, resulted in 45.9%.
DISCUSSION
Salt taste perception is important to determine the intake of food. The discrimination of salt concentration is implied in this perception. Therefore, dose-dependent response is expected in the NST. In this regard, a morphological neural activity may provide an evidence for salt discrimination perception in the NST.
According to human study, salt stimulation produces two different tastes depending on its concentration. Human subject reported sweet and salty taste for 0.01 M NaCl stimulation and salty only for higher than 0.03 M NaCl stimulation [20]. Recently, Chen at al. [5] reported interesting result that temporal coding of the NST neurons depends on NaCl concentration. The electrical activity of single neuron was higher for 0.6 M NaCl than 0.1 M NaCl and also the responses were dose-dependently increased. Their result may not directly be related to FLI expression level, since FLI expression study focused on the number of cells that expressed c-Fos. Therefore, there was no systematic approach to discriminate salt taste perception related to salt concentration.
For systematic approach for FLI expression in the NST, there were several studies previously. Travers [10] reported that the FLI expression following 0.3 M NaCl stimulation in the rat NST. The NST sections from five different levels based on the area postrema were collected and were divided to six subregions as described by King et al. [19]. The FLI expressions in five different anterior-posterior levels, of the overall NST and in six subregions, were not significantly different from DW stimulation. Meanwhile, Stratford and Finger [18] reported different result using mice as experimental animals. Nine NST sections from different anterior-posterior levels were collected and their FLI expressions in the overall NST were compared. There was significant difference in FLI expressions between 0.15 M NaCl and DW stimulation in the NST. In their study, the NST was divided into six subregions as Travers [10] did. But unfortunately, they did not compare the difference of FLI expressions between NaCl and DW stimulation, since their main issue was to study the role of purinergic receptors in taste sensation. They only compared FLI expressions between wild type and P2s2-dblKO mice. We also collected six NST sections from different anterior-posterior levels. In the present study, FLI expressions were not significantly increased in low salt concentration (0.3 and 0.6 M NaCl), than DW stimulation. This result is consistent with Travers [10] (0.3 M NaCl) and Stratford and Finger [18] (0.15 M NaCl). Meanwhile, there was the higher expression of FLI in the intermediate NST levels with high salt (1.0 M NaCl) taste stimulation than DW stimulation. In subregions of the NST, the dorsal-medial and dorsal-middle regions in the intermediated NST showed higher FLI than DW stimulation. Therefore, our results may provide a morphological evidence to salt taste perception related with dose-dependence.
There was similarity in the collecting and positioning NST sections among Travers [10], Stratford and Finger [18], and our study, but the naming of each levels were somewhat different. It is not easy to position each coronal section in serial section of the NST along the rostral-caudal axis among animals. Therefore, we focused on the position where the NST begin to meet the 4V because we thought it is the only clear section to calibrate each section. This section was named i1-NST in Stratford and Finger [18] and ours. The posterior region to i1 area was named as intermediate in Travers [10], and Stratford and Finger [18], and ours. The intermediate NST was further divided into i1, i2, i3 and i4 areas depending on their anterior-posterior level. These regional divisions will allow comparison of the FLI expression in each regional level. It should be note that rostral NST in Travers [10], and Stratford and Finger [18] were different from ours. The r1 and r2 areas in this study covers 400 µm distance from i1 area, so the rostral NST that appear with cochlear nucleus was not included in the FLI analysis. This rostral NST were included in serial section and also its FLI expression was analyzed. But they were very lower than r1-NST and we exclude them in FLI comparison.
It is interesting to determine where FLI was more prominent in the NST for specific tastant, because the area would imply the taste signal pathway of that tastant in the NST. Therefore, the division of the NST into six subregions is reasonable to test the information processing pathway of specific tastant simulation. But there were few studies that considered this issue. Quinine stimulation induced dorsal-medially distributed FLI in the NST [10,19]. Sucrose stimulation induced FLI in dorsal-middle subregions [17]. Dorsal-middle subregion was sensitive to monosodium glutamate (umami taste) [18]. Salt stimulation induced more FLI expressions in dorsal-medial and dorsal-middle subregions of the intermediate NST in the present study. These results imply the topographical distribution of FLI for various tastants were intermingled around the dorsal-medial region.
Recently, Corson and Hill [21] reported an anatomical evidence for the CT tract termination in the NST. The CT tract only was remained after other tracts in the tongue were dissected and was stained with fluorescent anterograde nerve labeling using biotinylated dextran amine. The terminals in the NST were clustered mostly in dorsal-medial regions of the rostral NST. This clustering of terminal could explain the high FLI expressions in dorsal-medial region for most taste stimuli. In our result, the dorsal-medial and dorsal-middle subregions showed significantly higher FLI expressions in i1, i2 and/or i3 areas. Meanwhile, there is inconsistency between CT terminal and FLI expression in the NST along anterior-posterior level. The CT terminals were clustered mostly in the rostral NST but the FLI expression was higher in the intermediate NST than rostral NST in Stratford and Finger [18] and our result. Although some part of CT terminals in the NST maybe specific for salt tastant, this discrepancy could not be explained fully. There is a possibility that the salt solution was flowed or diffused to the posterior part of the tongue during stimulation, even though we tried to apply salt solution to the anterior 2/3 of the tongue.
There are two interesting findings in the present study. The first is the position of maximum FLI expression region. The maximum FLI expression in the NST was more intermediately oriented than control (DW). This tendency was general in the overall NST and each subregions. This result may suggest the difference of taste signaling pathway in the NST between DW and salt taste. The other is the concentration-dependent increase of FLI. Even though it was not statistically significant, there were strong trends. The last finding needs further research to verify the different expression pattern of NaCl stimulation from control. There was one unexpected result that FLI expression in the left and right subregion of the NST showed different expression pattern. In the left NST (Fig. 4), the medial and middle subregion of the NST showed higher FLI expression than lateral subregion. In the right NST (Fig. 5), however, the lateral subregion showed higher FLI expression than other subregions. Why this discrepancy is happened even though the overall FLI expression of the NST in the Fig. 3 showed similar pattern? Currently, we do not have the answer for this discrepancy but one possible explanation is the direction of tastant stimulation. The tastant was applied toward the left side of the tongue and body was left side up, so this positioning may causes different FLI between left and right.
c-Fos immunohistochemistry has been used as a valuable method to verify gustatory signaling in the central nerves system. But there were technical issues related with FLI expression. FLI may depend on anesthesia condition and stimulation modality. Takayam et al. [22] reported urethane anesthesia evoked more FLI cells than fentanyl/midazolam. Rosen et al. [23] suggested water as an independent taste modality because the NST cells electrically responded to water treatment. Nevertheless, c-Fos expression was used in many research fields including the learning effect of food depletion [15,24] or aversion [14,16,25]. Furthermore, many researchers used FLI to figure out the location of taste pathway in the NST [9,17,26]. In our result, water treatment evoked FLI expressions but the response was not significantly higher than high salt concentration treatment in dorsal-middle and dorsal-medial subregions of the NST.
Recently, the taste information processing was analyzed in the gustatory cortex using two photon calcium imaging [27], intrinsic optical imaging [28] and they revealed spatial coding of tastant stimuli, different tastant occupy different region in the gustatory cortex. Direct electrical recordings from the NST were also conducted and revealed the different temporal coding for tastants and their concentration [5]. The c-Fos immunohistochemical study also shows the spatial coding of tastant. Therefore, combination of different approaches would extend our knowledge for gustatory system, especially in the NST.
In conclusion, difference in the FLI expression between 1.0 M NaCl and DW was demonstrated and the dorsal-middle and dorsal-medial subregions showed higher FLI expression than other subregions. The results provide morphological evidence for perceptional and discrimination of salt taste signaling in the NST.
 XML Download