

 PDF
PDF ePub
ePub Citation
 Print
Print


INTRODUCTION
Retinal prostheses are being developed to restore vision for the blind with retinal diseases such as retinitis pigmentosa (RP) or age-related macular degeneration (AMD) [1-3]. While the retinal degenerations result in photoreceptor loss, significant numbers of bipolar and ganglion cells remain for many years. The preservation of the remaining neural network in patients with RP and AMD provides the opportunity to restore vision by means of an electronic retinal prosthesis.
Among the many animal models of RP, the most extensively characterized animal is the rd1 (formerly rd: abbreviated from retinal degeneration, now Pde6brd1) mouse, first described as a rodless phenotype [4]. Rd1 mouse carries a spontaneous non-sense mutation of the β-subunit of the rod-phosphodiesterase (PDE) gene, causing the massive death of rods in the first weeks of postnatal life. Cones eventually die as well as in typical RP [5,6]. The more recently identified Pde6brd10 (rd10) mouse, which carries a mis-sense mutation in the same gene, has a later onset and slower rate of photoreceptor degeneration than the rd1 mouse [7]. The slower degenerative time course makes rd10 a more appropriate model of human RP, and presents a broader window of opportunity to test therapies for photoreceptor rescue [8-11].
In recent studies including ours using rd1 mice, it is known that the neurophysiological properties of photoreceptor-degenerated retinas differ significantly from those of normal retina [12-17]. The most significant alteration of spontaneous activities of retinal networks in rd1 mice is the presence of an oscillatory rhythmic activity with ~10 Hz frequency [12,13,16]. In our previous study, we showed that the rhythmic burst of spontaneous RGC spikes is phase-locked with the oscillatory field potential [16].
While some electrophysiological studies including ours have been done with rd1 mice, however, only few studies have been done regarding electrical characteristics of retinal waveform in rd10 mice, and most of them are focused on in vivo ERG study [18,19]. Therefore, here, we investigate the electrical characteristics of retinal waveform using microelectrode array (MEA).
High frequency oscillations (20 to 120 Hz), those generated by the internal dynamics of the system, have been found at all stages of visual processing, from the retina to the cortex [20]. However, ~10 Hz oscillatory rhythmic activity in adult retina has hardly been reported. Even if there is debate about the role of oscillatory rhythmic activity, other than spike rate it is one way of neural code of retina to communicate with the brain.
Therefore, before adapting rd10 mice as a new animal model for our electrical stimulation study for retinal prosthesis, we investigated electrical characteristics of rd10 mice. In this study, we mainly focused on whether there is oscillatory rhythm in bursting RGC spikes and field potential and whether the bursting spikes of RGC is phaselocked with the oscillatory rhythm of local field potential (LFP) in rd10 mice. Since in rd1 mice LFP shows age dependent occurrence [12], we followed the oscillatory rhythm change from postnatal 4 weeks up to 30 weeks even after the complete histological loss of photoreceptor layer is seen in rd10 mice. Also, we compared the oscillatory rhythm in RGC spikes and field potential in two photoreceptor degeneration mice; rd1 and rd10 mice to understand the neural code used by the two diseased retinas to communicate with the brain. This understanding will facilitate to set new selection criteria for responsiveness to electrical stimulus in rd10 mice and rd10-specific optimal electrical stimulation parameters like we already proposed in rd1 mice [17], eventually. Some of the preliminary results has been reported in Goo et al as a conference proceeding [21].
Go to : 
METHODS
In vitro recording of retinal activity
Wild-type (C57BL/6J strain), rd1 (C3H/HeJ strain), rd10 (B6.CXB1-Pde6brd10/J) were used for this experiment. Animal use protocols were approved by the institutional animal care committee of Chungbuk National University (approval number: CBNURA-042-0902-1). Postnatal 8 weeks wild-type, 4 weeks and 8 weeks rd1 mice and 4, 8, 10, 15, 20 and 30 weeks rd10 mice were used. The animals were anesthetized with intramuscular injection of 30 mg/kg zolazepam hydroxide (Zoletil 50; Virbac, Sao Paulo, Brazil) and 10 mg/kg zylazine hydroxide (Rumpun; Bayer, Shawnee Mission, KS) sufficient to extinguish forefoot withdrawal reflexes. The retinal patches were prepared following the method of Stett et al. [22]. Briefly, the eyeball was enucleated, and then, the retina was isolated and cut to the patches of ~3×3 mm sizes. The retinal patches were carried out under moderate illumination in an artificial cerebrospinal fluid (ACSF) solution (124 mM NaCl, 10 mM Glucose, 1.15 mM KH2PO4, 25 mM NaHCO3, 1.15 mM MgSO4, 2.5 mM CaCl2, and 5 mM KCl) bubbled with 95% O2, 5% CO2 with a pH of 7.3~7.4 and a temperature of 32℃ and then mounted onto a planar microelectrode array (MEA). The retinal patches were placed ganglion cell layer down onto the MEA.
Electrode and data recording system
The data acquisition system (MEA60 system; Multi Channel Systems GmbH, Reutlingen, Germany) included planar MEA, stimulator (STG1004), amplifier (MEA1060), temperature control units, data acquisition hardware (Mc_Card) and software (Mc_Rack). The MEA contained 64 circular-shaped electrodes in an 8×8 grid layout with electrode diameters of 30µm and inter-electrode distances of 200µm and coated with porous titanium nitride (TiN) to minimize electrical impedance. The four electrodes at the vertices were inactive. Multi-electrode recordings of the retinal activity were obtained from 60 electrode channels with a bandwidth ranging from 10 to 3,000 Hz at a gain of 1,200. The data sampling rate was 25 kHz/channel. From the raw waveform of retinal recording, retinal ganglion cell (RGC) Spikes and LFP were isolated by using 100 Hz high-pass filter and 20 Hz low-pass filter, respectively. No light or electric stimulation was applied for this experiment and the spontaneous retinal activity was recorded.
Data analysis
Stored data were processed off-line by a spike sorting software (Offline Sorter™) to transform the waveforms containing multiunit activities into multiple single unit spike trains. The spontaneous mean firing rate for each recorded cell was computed as the total number of spikes divided by the length of the recording period. Mean±standard error of the mean (SEM) are presented for the mean firing rate. However, given the non-normal distribution of the spontaneous firing rate, also central values were expressed as medians± first and third quartiles and compared using Wilcoxon rank sum test. For comparisons across multiple age groups in rd10 mice, one way ANOVA and the Kruskal-Wallis test were employed.
Since the strength of neural oscillations are defined in frequency domains on the basis of peaks in the power spectrum, Fourier transform estimated by Burg algorithm [23] was performed for detection of the frequency of LFP and oscillatory rhythm of bursting RGC spikes with Matlab™ (The Mathworks, Inc., Natick, MA, USA). And to find a frequency from retinal recording for a short period (e.g. several seconds), a continuous wavelet transform was performed using Matlab.
Go to :
RESULTS
Spontaneous hyperactivity in degenerated retina; rd1 and rd10 retina
To determine whether hyperactivity emerges in degenerated retina (rd1 and rd10 retina) as Stasheff's recent results [13,24], we examined the spontaneous activity of wild-type (wt), rd1, and rd10 retina. Whereas spontaneous firing rates varied among individual ganglion cells, the frequency of spontaneous activity was significantly higher overall among rd1 and rd10 ganglion cells than among wt ganglion cells at postnatal 8 weeks (p<0.001). But no statistical difference was found in spontaneous firing rates between rd1 and rd10 retinas of postnatal 4 weeks (PNW4) and 8 weeks (PNW8) (p>0.05). This may be seen in the sample raster plots of Fig. 1A and in the comparison of mean firing rates (+/- SEM) for wt, rd1, and rd10 ganglion cells (Fig. 1B). In rd10 ganglion cells, the mean firing rate at PNW8 and PNW30 are significantly higher than that at the other age groups (ANOVA and posthoc Tukey criteria, p=0.05). Considering the non-normal distribution of ganglion cell's firing rate, we calculated median firing rate and compared the difference among age groups (Fig. 1C). In rd10 ganglion cells, the highest and second highest firing rates were observed at PNW30, PNW8, respectively. There was no statistical difference among the other age groups (Kruskal-Wallis test, Tukey criteria, p=0.05).
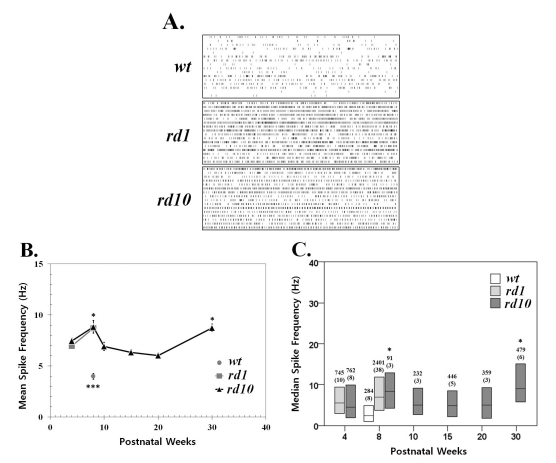 | Fig. 1Spontaneous activity increases with photoreceptor degeneration in rd1 and rd10 ganglion cells. (A) Representative raster plots display extracellular recordings of spontaneous action potentials in wild type (wt), rd1, and rd10 at postnatal ages of 8 weeks. Each panel displays the RGC activity recorded over 10 sec period in a sample of 16 ganglion cells (1 per row) from a single retina. (B) Mean±SEM firing rate of all cells recorded across different postnatal ages. Spontaneous activity significantly increases with aging from postnatal 4 weeks to 8 weeks both in rd1 and rd10 ganglion cells (p<0.05). At PNW8, the mean spike frequency of wt is significantly lower than either rd1 or rd10 (***p<0.001). In rd10, the mean firing rate at PNW8 and PNW30 are highest, and no statistical difference among the other age groups (ANOVA, p=0.05, posthoc Tukey criteria). Statistically significant differences among different age groups are indicated above the mean value (*p<0.05). (C) Median spontaneous firing rates (middle line in each bar) and 1st and 3rd quartiles (ends of bars) are indicated for each of 6 age groups. The median spike rate at PNW8 is the highest, and at PNW30, second highest, and no difference among PNW4, 10, 15, and 20 (Kruskal-Wallis test, p=0.05, Tukey's criteria). Statistically significant differences among different age groups are indicated above the median value (*p<0.05). Data are from the same recordings in B. The number of cells in each sample is indicated above the bar, with the number of retinas in parentheses. Each retina was from a different animal.
|
The distribution of firing rates within the ganglion cell shifts to the right in rd1 and rd10 retina, which means that a greater proportion of cells favor higher frequency firing in rd1 and rd10 in comparison with wt retina (Fig. 2).
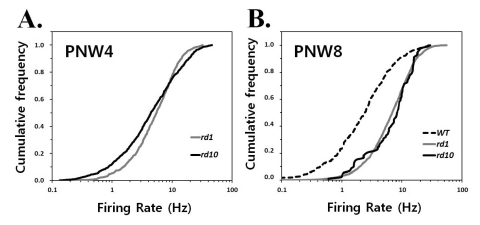 | Fig. 2Quantification of spontaneous hyperactivity in rd1 and rd10 ganglion cells. Cumulative frequency histograms display the distribution
of mean firing rates among all ganglion cells recorded in normal and degenerating retinas at postnatal 4 weeks (PNW4) (A) and 8 weeks (PNW8) (B) The same cells were used as in Fig. 1. Each panel represents the proportion of the ganglion cell population firing at a rate up to the frequency of x axis. A greater proportion of cells is active at higher rates in rd1 and rd10 mice comparing with wt mice, seen as a rightward shift and steeper slope of the histogram curve.
|
Rhythmic local field potential and bursting RGC spikes in rd1 and rd10 retina
Rhythmic oscillatory behaviors in field potential waveforms were clearly observed (Fig. 3), similar to those in our previous study [12]. The spectral peak of the field potential was approximately 10 Hz and 4 Hz, rd1 and rd10 retina of PNW8, respectively (Fig. 3. right panel of Ab and Bb). The spontaneous RGC firing pattern also showed a consistent temporal structure with a rhythmic burst of spikes (Fig. 3Ac, Bc). The interspike interval histogram (ISIH) (Fig. 3. right panel of Ac, Bc) demonstrates the temporal structure of spontaneous RGC spike trains in detail. The first peak, at approximately 15 ms, was the result of interspike interval within a single burst of spikes. The second peak, at approximately 100 ms and 240 ms, rd1 and rd10 retina, respectively corresponds to the interburst interval. These results are consistent with the recent results of Stasheff [13], which showed a rhythmic burst of spikes, and with those of Margolis et al. [14], which showed an oscillatory synaptic input and a rhythmic burst of spikes.
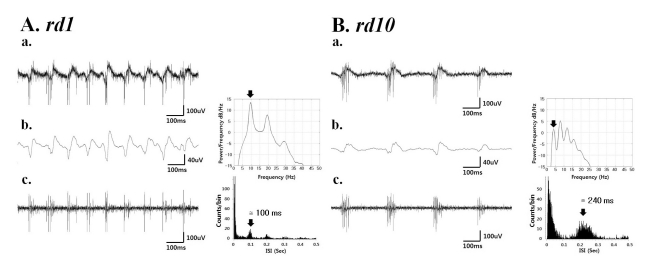 | Fig. 3(a) A typical raw waveform of neural activity recorded from rd1 (A) and rd10 (B) retina. (b) Field potential waveform (left) obtained from low-pass filtering with 20 Hz cutoff frequency and its power spectral density estimated by the Burg algorithm [23] (right). (c) The spiking activity obtained by high-pass filtering with 100 Hz cutoff frequency (left) shows a temporal structure of rhythmic bursts of spikes, where the interburst interval of ~100 ms (corresponding to ~10 Hz) and ~240 ms (corresponding to ~4 Hz) in rd1 and rd10 retina, respectively.
|
The temporal structure of the field potential and the spontaneous spike train suggest that the oscillatory waveform of the field potential reflects synaptic input, which produces the rhythmic burst of spontaneous RGC spikes that is phase-locked with the oscillatory field potential not only in rd1 but also in rd10 retina. One difference found in power spectrum of field potential between rd1 and rd10 retina (Fig. 3. right panel of Ab, Bb) was the second peak (~8 Hz) was more dominant than the first peak (~4 Hz) in rd10 retina.
Rhythmic local field potential and bursting RGC spikes across different age groups
1. Rhythmic burst of spontaneous RGC spikes is always phase-locked with the oscillatory field potential in rd1 retina (Fig. 4)
In rd1 mice, regardless of postnatal ages, there is no statistical difference between the power spectral peak of bursting RGC spikes and LFP at 4 weeks [peak in spike; 9.3±0.9 Hz (n=40), peak in LFP; 9.3±1.3 Hz (n=15); p>0.05] and 8 weeks [peak in spike 10.0±1.3 Hz (n=87), peak in LFP; 10.9±0.8 Hz (n=10); p>0.05].
Also, there is no statistical difference between the peaks in bursting spikes for PNW4 and PNW8, and no statistical difference between the peaks of LFP at PNW4 and PNW8, either.
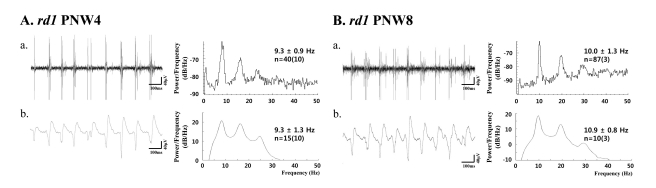 | Fig. 4(a) Bursting RGC spikes (left) and its power spectrum (right) (b) LFP (left) and its power spectrum (right) in rd1 retina at postnatal 4 weeks (PNW4) (A) and PNW8 (B). RGC spikes and LFP were obtained with high-pass filtering and low-pass filtering as in Fig. 3. The number of cells is indicated, with the number of retinas in parentheses. There is no statistical difference between the spectral peak in bursting RGC spikes and LFP (p>0.05) in both PNWs.
|
2. Rhythmic burst of spontaneous RGC spikes is phase-locked with the first spectral peak of the oscillatory field potential in rd10 retina (Fig. 5)
In rd10 mice, except the PNW4 when the degeneration is not fully developed [19], there is strong phase-locking tendency between the spectral peak of bursting RGC spikes (~5 Hz) and the first peak of oscillatory field potential (~5 Hz). Even if there is phase-locking tendency between them, the second peak of oscillatory field potential is always the major peak in power spectral density calculated from the 200 sec recording time, which means on average ~10 Hz frequency rhythm is dominant. Table 1 summarized the spectral peaks of bursting RGC spikes and oscillatory field potential among different age groups. There is no statistical difference between the spectral peaks of bursting RGC spikes and oscillatory field potential (ANOVA, p>0.05) except PNW4 and the second peak of oscillatory potential at 10 Hz is roughly two times of the spectral peak of bursting RGC spikes at 5 Hz. And second spectral peak at ~10 Hz is the same frequency of LFP observed in rd1 retina.
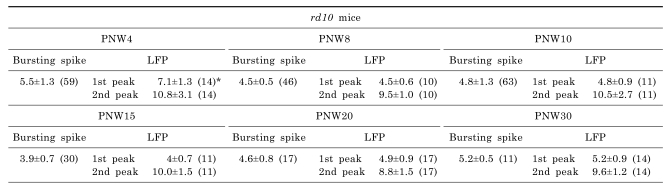
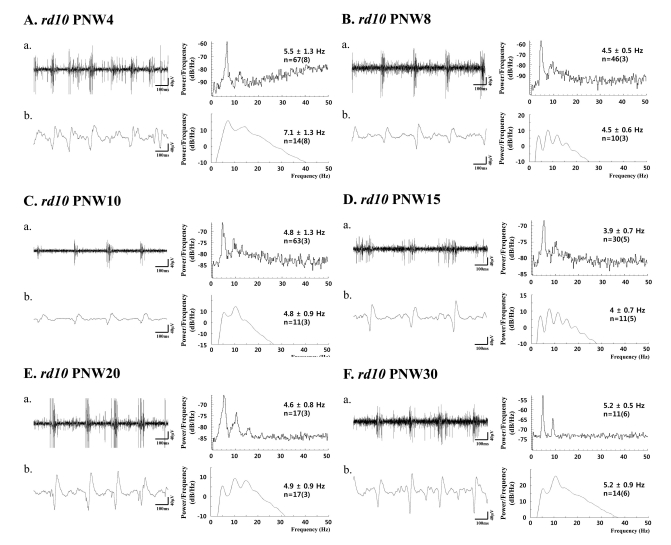 | Fig. 5(a) Bursting RGC spikes (left) and its power spectrum (right) (b) LFP (left) and its power spectrum (right) in rd10 retina with PNW4 (A), PNW8 (B), PNW10 (C), PNW15 (D), PNW20 (E), and PNW30 (F). RGC spikes and LFP were obtained with high-pass filtering and low-pass filtering as in Fig. 3 and 4. The number of cells is indicated, with the number of retinas in parentheses. Except PNW4, no statistical difference between the spectral peak of bursting RGC spikes and first peak of oscillatory field potential was found among different age groups (ANOVA, p>0.05).
|
3. ~ 5 Hz frequency is found in continuous wavelet transform calculated from retinal activity for short recording time in rd10 retina
Since spectral peak of ~5 Hz was evident as first peak even if not dominant in power spectrum of oscillatory field potential, we performed the continuous wavelet transform from the retinal recording for short period of time (e.g. a few seconds). Besides strong hot spot at ~10 Hz, there is always substantial hot spot at ~ 5 Hz (Fig. 6), which means this phase locking of ~5 Hz frequency between the oscillatory field potential and bursting spikes in rd10 retina is not robust as the 10 Hz phase locking in rd1 mice, and it runs only a few seconds. Therefore, dominant peak is observed at ~10 Hz when spectral power was calculated from retinal recording for more than a few minutes.
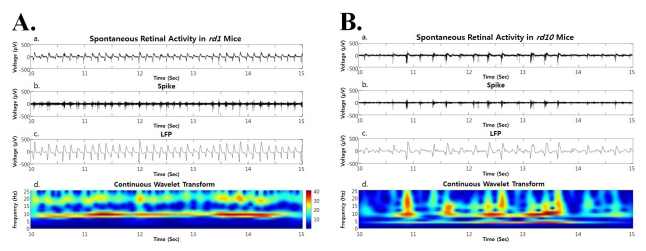 | Fig. 6Both in rd1 and rd10 mice, the spontaneous retinal activity (a), spike obtained by high pass filtering (b), LFP obtained by low pass filtering (c), and power spectrum through continuous wavelet transform are shown. (A) In rd1 mice, hot spot is only observed at ~10 Hz frequency (Ad). (B) In rd10 mice, hot spot is more prominent at ~10 Hz frequency but substantial hot spot is also found at ~5 Hz (Bd).
|
Go to :
DISCUSSION
We show that in degenerated retina, spontaneous hyperactivity and rhythmic bursting is observed not only in rd1 but also in rd10 mice. In rd1 mice, ~10 Hz rhythmic burst of spontaneous RGC spikes is always phase-locked with the oscillatory field potential and this phase-locking property is preserved regardless of postnatal ages (PNW4, PNW8). However, in rd10 mice, there is strong phase-locking tendency between the spectral peak of bursting RGC spikes at ~5 Hz and the first peak of oscillatory field potential at ~5 Hz across different age groups. But this phase-locking property is not robust as in rd1 retina, but maintains for a few seconds, therefore if the power was calculated from the recording of a few minutes, on average dominant spectral peak of LFP is always observed at ~10 Hz.
Spontaneous hyperactivity in rd10 retina
The change of mean firing rates across different age groups corresponds to Stasheff's recent work [24]; highest firing rates at about 8 weeks. But since they only followed up to the postnatal 120 days (~postnatal 17 weeks), they have not showed the rebound increase of firing rates at PNW30 of ours. At this point, it is not clear why this happens. Clearly, we will need to understand in much greater detail about retinal circuits in each developmental stage in rd10 retina.
Phase-locking at different frequency in rd1 and rd10 retina
Degeneration occurs rapidly, with onset of rod loss at P8 and near complete loss of rods by P21 in rd1 mice [25]. Since photoreceptor degeneration completes by 4 weeks and horizontal cells degenerate by 8 weeks in rd1 mice [26], we used PNW4 and PNW8 rd1 mice, and observed if there is any possible change regarding frequency of oscillatory rhythm in RGC spike and field potential. About 10 Hz rhythmic activities were observed from both spontaneous spikes of RGCs and oscillatory field potential and this rhythm preserved up to PNW8 when the degeneration of horizontal cell completed. Our result can be interpreted once the retinal degeneration completes by 4 weeks, no more change in retinal network develops and the same pattern of information processing continues.
While in rd10 mice, rod degeneration starts around P18, and photoreceptor death is accompanied and followed by dendritic retraction in bipolar and horizontal cells [19]. Recent study of Phillips et al. [27] using rd10 mice at various stages of degeneration ranging from P30 to postnatal month 9.5 (PNM9.5) showed that horizontal cells and rod and cone bipolar cells underwent morphological remodeling including loss of dendrites, cell body migration, and the sprouting of ectopic processes. Despite these changes, the laminar organization of bipolar and amacrine cells and the ON-OFF organization in the inner plexiform layer was largely preserved. Surviving cone and bipolar cell terminals continued to express the appropriate cell-specific presynaptic proteins needed for synaptic function up to PNM9.5 [27]. But this may not guarantee that unchanged normal synaptic function of wild-type retina preserves in rd10 retina, probably the opposite would be true. In our experiment with rd10 retina, at PNW4 the power spectrum of LFP shows very different peak at 7.1 Hz. This might be interpreted that due to incomplete degeneration by 4 weeks, sufficient inhibitory input from horizontal cells still persists; therefore, typical oscillatory field potential has not developed yet. But once the typical oscillatory field potential develops by 8 weeks due to degeneration, it preserves until the PNW30 (p>0.05: comparison among the peaks of LFP).
Before we answer why in rd10 retina phase locking at ~5 Hz frequency runs only for a few seconds not for longer period of time (~minutes) as in rd1 retina, we will need to understand in much greater detail about retinal circuits in each developmental stage in rd1 and rd10 retina. At least, one thing is clear that more complicated neural code is used in rd10 retina; ~5 Hz oscillatory field potential for short period time and long-lasting ~10 Hz oscillatory field potential (corresponds to the first and second peak at power spectrum; Fig. 5Bb, Cb, Db, Eb, and Fb).
Functional role of oscillatory rhythm
Neuronal oscillations appear throughout the nervous system, in structures as diverse as the cerebral cortex, hippocampus, subcortical nuclei and sense organs [28]. Unlike the case for mammalian vision, in which the function of oscillations remains subjects of debate, the behavioral role of synchronous gamma oscillations (20~80 Hz) among retinal dimming detectors is important for frog's survival - it triggers escape behavior [29]. Whether neuronal oscillations contribute to normal function, are merely epiphenomena, or even interfere with physiological processing are topics of vigorous debate [28].
Koepsell et al. reported that individual RGCs multiplex two streams of information; one stream encodes visual information by changes in firing rate time-locked to external visual stimuli, the other stream encodes information using spike timing relative to intrinsic retinal oscillations [30]. Since the oscillatory rhythm of bursting RGC spikes differ in rd1 and rd10 mice in our study, this might be related with the intrinsic property difference encoding the visual information both in rd1 and rd10 mice.
Implication of different phase locking property in rd1 and rd10 retina
Since rd1 and rd10 retina show phase-locking at different frequency (~10 Hz vs. ~5 Hz) between the bursting RGC spikes and oscillatory field potential, we expect different response patterns to electrical stimulus between rd1 and rd10 retina. We already proposed tentative optimal stimulation parameters for electrical stimuli in rd1 retina [17]. Therefore, to extract optimal stimulation parameters in rd10 retina, first we might define selection criteria for responding rd10 ganglion cells to electrical stimulus.
Go to :
 XML Download