Journal List > Korean J Physiol Pharmacol > v.15(6) > 1025769

Yoon, Park, Cho, Kim, Lee, Kang, Han, and Kang: Cigarette Smoke Extract-induced Reduction in Migration and Contraction in Normal Human Bronchial Smooth Muscle Cells

Abstract

The proliferation, migration, cytokine release, and contraction of airway smooth muscle cells are key events in the airway remodeling process that occur in lung disease such as asthma, chronic obstruction pulmonary disease, and cancer. These events can be modulated by a number of factors, including cigarette smoke extract (CSE). CSE-induced alterations in the viability, migration, and contractile abilities of normal human airway cells remain unclear. This study investigated the effect of CSE on cell viability, migration, tumor necrosis factor (TNF)-α secretion, and contraction in normal human bronchial smooth muscle cells (HBSMCs). Treatment of HBSMCs with 10% CSE induced cell death, and the death was accompanied by the generation of reactive oxygen species (ROS). CSE-induced cell death was reduced by N-acetyl-l-cysteine (NAC), an ROS scavenger. In addition, CSE reduced the migration ability of HBSMCs by 75%. The combination of NAC with CSE blocked the CSE-induced reduction of cell migration. However, CSE had no effect on TNF-α secretion and NF-κB activation. CSE induced an increase in intracellular Ca2+ concentration in 64% of HBSMCs. CSE reduced the contractile ability of HBSMCs, and the ability was enhanced by NAC treatment. These results demonstrate that CSE treatment induces cell death and reduces migration and contraction by increasing ROS generation in normal HBSMCs. These results suggest that CSE may induce airway change through cell death and reduction in migration and contraction of normal HBSMCs.

ABBREVIATIONS

CSE

cigarette smoke extract

HBSMCs

human bronchial smooth muscle cells

[Ca2+]i

intracellular Ca2+ concentration

NAC

N-acetyl-l-cysteine

ROS

reactive oxygen species

TNF

tumor necrosis factor

INTRODUCTION

Cigarette smoke (CS) is well known to be a risk factor for lung diseases, including chronic obstructive pulmonary disease (COPD), lung cancer, and asthma [1,2]. These lung diseases are accompanied by airway inflammation, airway hyperresponsiveness, and airway remodeling [3].
Airway remodeling is characterized by epithelial detachment, subepithelial fibrosis, mucus hyperplasia, airway edema, and an increase in airway smooth muscle mass. Abnormalities in the proliferation, apoptosis, migration, cytokine secretion, and contraction of smooth muscle cells play important roles in airway remodeling [4-6]. The cause of such abnormalities is complex and depends on a network of inflammatory mediators and cytokines [7]. These cytokines play important roles in airway smooth muscle remodeling. CS induces significant increases in multiple cytokines including tumor necrosis factor (TNF)-α, which is central to many acute inflammatory cascades [8,9]. In addition to inflammatory cytokines, reactive oxygen species (ROS) generation is also a risk factor for the airway remodeling in lung diseases. CS is a potent source of ROS generation [10,11]. ROS mediates cell contraction in canine tracheal smooth muscle cells (SMCs) [12]. CS extract (CSE)-induced oxidant production induces the dysregulation of inflammatory processes [13]. Some of the chemical and oxidizing pollutants contained in CSE directly affect airway smooth muscle contractility [14,15]. The in vivo responsiveness of airways is augmented after CS exposure [16-18]. However, acute exposure to CSE leads to airway relaxation [19]. Smooth muscle contraction plays a fundamental role in regulating the functions of airways, and it could be mediated by an increase in intracellular Ca2+ concentration ([Ca2+]i) [20].
CSE effect has been studied in a variety of cell types, such as pulmonary endothelial cell, lung fibroblasts, epithelial cells, and airway smooth muscle cells [21-24]. Relatively little is known concerning the effect of CSE on airway smooth muscle contractility compared to the CSE effect on inflammation, oxidative stress, and airway hyperresponsiveness. In addition, the effects of CSE on increase in airway smooth muscle mass in lung diseases are established, but little is known about the effect of CSE on the increase in mass and contractility of normal airway smooth muscle. Human bronchial (airway) smooth muscle cells (HBSMCs) are well-suited for studying CSE-induced cell contractility and hypertrophy in airway remodeling. This study was performed to identify whether CSE changes airway remodeling-related processes, such as cell viability, migration, contraction, TNF-α release, or [Ca2+]i in normal HBSMCs. We found that CSE induced cell death and reduced cell migration and contraction but it had no effect on TNF-α release and NF-κB activation.

METHODS

Chemicals

All of the chemicals used in this study were purchased from Sigma (St. Louis, MO, USA) unless otherwise specified. The stock solution of N-acetyl-l-cysteine (NAC, 500 mM) and ethylene glycol tetraacetic acid (EGTA, 50 mM) was prepared in distilled water. Nicotine (100 mM) and 1,2-Bis (2-aminophenoxy) ethane-N,N,N',N'-tetraacetic acid tetrakis-acetoxymethyl ester (BAPTA-AM, 10 mM) were dissolved in ethanol and dimethyl sulfoxide (DMSO), respectively. The stock solutions of chemicals were diluted in culture medium to a working concentration. When ethanol or DMSO was used as a solvent, a solution containing an equivalent concentration was used as a control.

Preparation of CSE

CSE was prepared using a previously published method [22]. To produce 100% CSE, one unfiltered Camel cigarette (R.J. Reynolds, Winston-Salem, NC, USA) was passed through 10 ml of phosphate-buffered saline (PBS) using a vacuum pump. The 100% CSE solution was adjusted to a pH of 7.4 and filtered through a 0.2-µm-pore filter (Minisart®, Sartorius, Goettingen, Germany) to remove particles and bacteria. The CSE was diluted to the appropriate concentration and was added to HBSMCs within 10 min of preparation.

Cell culture

Normal HBSMCs were purchased from PromoCell GmbH (Heidelberg, Germany). The HBSMCs were cultured in smooth muscle cell basal medium supplemented with 0.5 ng/ml epidermal growth factor, 2 ng/ml basic fibroblast growth factor, 5µg/ml insulin, 5% fetal calf serum, 50µg/ml amphotericin B, and 50 ng/ml gentamycin based on the manufacturer's recommendations (PromoCell). Cells were incubated at 37℃ in humidified air containing 5% CO2. The medium was replaced every two days.

Cell viability assay

Cell viability was determined colorimetrically using the 3-(4,5-dimethylthiazole-2-yl)-2,5-diphenyl tetrazolium bromide (MTT) reagent (Duchefa, Haarlem, Netherlands). Cells at the exponential phase were seeded (4×10⁴ cells/ml) in a 24-well plate. After 24 h of extract or chemical treatment, 20µl of 5 mg/ml MTT solution was added to each well (0.1 mg/ml) and incubated for 4 h. The supernatants were aspirated, the formazan crystals in each well were dissolved in 200µl DMSO for 30 min at 37℃, and the 24-well plates were read at 570 nm with a microplate reader (Bio-Rad, Hercules, CA, USA).

Measurement of ROS generation

The HBSMCs were cultured with or without 3 mM NAC while exposed to 10% CSE for 4 h. The HBSMCs were loaded with 5µM of dichlorodihydrofluorescein diacetate (H2DCFDA, Calbiochem, San Diego, CA, USA) for 30 min in the dark. After incubation, the cells were washed three times with PBS and immediately analyzed for fluorescence intensity using a confocal laser scanning microscope equipped with a fluorescence system (IX70 Fluoview, Olympus, Tokyo, Japan). For the detection of green fluorescence (H2DCFDA), cells were illuminated with 488- and 519-nm laser lines. The fluorescent images were saved in the tagged image file format and analyzed using the Fluoview software program (version 2.0, Olympus).

Migration assay

For the two-dimensional (2-D) migration assay, cells were seeded in a µ-dish (ibidi GmbH, Munich, Germany) at a density of 1×10⁶ cells/ml and treated with 8µg/ml mitomycin C in culture media for 2 h to eliminate proliferation. Photomicrographs were taken after incubation. Relative cell migration distance (closure) was determined by measuring the gap width on the monolayer under 10× magnification (Axiovert 40C, Carlzeiss MicroImaging, Göttingen, Germany) and by subtracting this value from the initial value (i.e., the initial width at 0 h). The transwell (three-dimension, 3-D) migration assay was performed using the CytoSelect™ Cell Migration Assay Kit containing polycarbonate membrane inserts (8-µm-pore membrane; Cell Biolabs, San Diego, CA, USA) according to the manufacturer's instructions. A cell suspension containing 1×10⁵ cells/ml in serum-free medium was prepared, and 300µl of the cell suspension was added to the upper chamber of each insert. The lower chamber contained medium with 10% FBS to allow cell migration toward the lower face of the transwell culture inserts. Cells were incubated for 12 h at 37℃ in a 95% air-5% CO2 gas mixture. Non-migrating cells on the inner side of the transwell culture inserts were gently removed with a cotton-tipped swab. Migrated cells remaining on the bottom surface were stained with a cell-staining solution (1% methylene blue) for 40 min at room temperature. Photomicrographs of five individual fields per insert were taken using a microscope (Axiovert 40C), and cells were enumerated to calculate the average number of cells that had migrated. The stained insert was washed thoroughly and dissolved by incubating for 10 min with extraction solution (1% Triton X-100). Each sample was transferred to a 96-well microtiter plate, and the absorbance at 560 nm was measured using a plate reader (Infinite® F200, Tecan, Männedorf, Switzerland).

Measurement of intracellular Ca2+ changes

The changes in [Ca2+]i was measured using the Ca2+-sensitive fluorescent indicator fluo 3-AM (Molecular probe, Eugene, Oregon, USA) and a confocal laser scanning microscope (IX70 Fluoview). The HBSMCs were incubated with 5µM fluo 3-AM in a coverglass-bottom dish (SPL, Pocheon, South Korea) for 45 min and washed three times with serum-free medium. Fluorescent images were scanned every 5 sec at 488 nm with an excitation argon laser and 530 nm longpass emission filter. All scanned images were processed to analyze changes in [Ca2+]i at the single-cell level.

Cell contraction assay

The contraction assay was performed using a cell contraction assay kit (Cell Biolabs). Briefly, HBSMCs (5×10⁵ cells/ml) were cultured for 2 days; the cultured HBSMCs were resuspended in culture media; and the cell suspension was mixed with collagen gel solution (bovine Type I). The cell-collagen mixture was placed in a 24-well plate and incubated for 1 h at 37℃. After collagen polymerization, culture medium without the growth factor supplement was added onto the collagen gel lattice. Cells in collagen gels were allowed to equilibrate for 2 days, the gels were released from the culture plate, and various agents were added to the media 1 h prior to release. The control for CSE and NAC was serum free media, and the control for 2, 3-butanedione monoxime (BDM) was 0.1% DMSO in medium. BDM was used as a contraction inhibitor (negative control). Images of the gels were captured with a camera (Canon, Tokyo, Japan), and the gel size change was measured at the indicated times with a ruler and quantified with image analysis software (Fluoview software program, Olympus). For each condition, collagen contraction was determined in at least quadruplicate.

Measurement of TNF-α concentration

The HBSMCs were treated with 10% CSE for 24 h in the presence or absence of NAC in 96-well plates. The cell culture media was collected and stored at -20℃ prior to the analysis. The amounts of secreted TNF-α in the media were measured using TNF-α ELISA kits (BioSource; Camarillo, CA, USA) according to the manufacturer's instructions.

Western blot analysis

The HBSMCs were homogenized in a protein extraction solution (PRO-PREP™, iNtRON Biotechnology Inc, Seongnam, Korea) containing 50 mM Tris-Cl (pH 7.5), 150 mM NaCl, 1 mM dithiothreitol (DTT), 0.5% nonyl phenoxylpolyethoxylethanol (NP-40), 1% Triton X-100, 1% deoxycholate, 0.1% sodium dodecyl sulfate (SDS), 1 mM ethylenediaminetetraacetic acid (EDTA), 1µM leupeptin, 1µM pepstatin A, 1 mM phenylmethylsulfonyl fluoride (PMSF), and 0.1µM aprotinin. After the addition of the protein extraction solution, the cells were incubated for 30 min on ice with intermittent vortexing. The extracts were clarified by centrifugation at 13,000 rpm (16,609×g; Micro 17TR, Hanil, Korea) for 20 min at 4℃. The resulting supernatant was separated with 8% SDS-polyacrylamide gel and transferred to PVDF membrane for 15 min using a semi-dry transfer (Bio-Rad, CA, USA). The membranes were blocked with 5% fat-free dry milk and then incubated with NF-κB p65 polyclonal (1:1,000 dilution) (Cell Signaling, Danvers, MA, USA), Phospho-NF-κB p65 (Ser536) rabbit monoclonal (Cell Signaling, 1:1,000 dilution), and α-tubulin monoclonal antibodies (1:10,000 dilution). The primary antibody incubation was followed by incubation with a secondary peroxidase-conjugated anti-rabbit or anti-mouse antibody at 1:10,000. Immuno-positive bands were visualized by enhanced chemiluminescence (ECL Plus kit, ELPIS, Taejon, Korea) following the manufacturer's instructions.

Statistics

A one-way ANOVA (SPSS18, Chicago, IL, USA) was used with p<0.05 as the threshold for significance. Data are represented as mean±SD.

RESULTS

Effect of CSE on cell proliferation and migration in normal HBSMCs

The cytotoxicity of CSE was examined in HBSMCs using an MTT assay. The HBSMCs were cultured in the presence of various concentrations of CSE (0.01~30%). When the cells were treated with CSE for 24 h, the cell viability significantly decreased by approximately 38% in the 10% CSE treatment compared with the control (Fig. 1A). As shown in Fig. 1B, ROS was detected using H2DCFDA that has been widely used as a detector of ROS in many kinds of cells. The dye becomes fluorescent after cellular oxidation. CSE significantly increased ROS levels by 2.5-fold compared with the control (p<0.05, n=5). CSE-induced ROS generation was attenuated by pretreatment for 1 h with 3 mM NAC. The CSE-induced cell death was also reduced by NAC treatment (Fig. 1C).
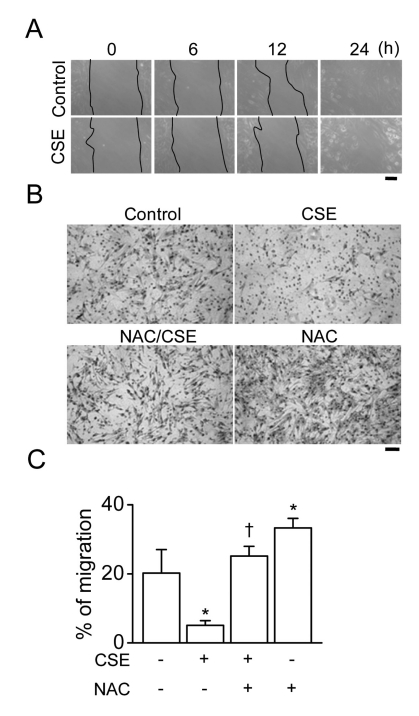
To test the migration ability of HBSMC, the cells were incubated in a µ-dish (ibidi GmbH). However, the 10% CSE treatment reduced cell migration ability by 57% compared with the control (Fig. 2A). The cells' migration ability was determined using a 3-D migration assay. The 3-D migration assay revealed that CSE treatment significantly inhibited cell migration (p<0.05, Fig. 2B), reducing migration by 75% in the CSE treatment (Fig. 2C). The combination of NAC and CSE offset the CSE-induced reduction in cell migration (Fig. 2C). NAC alone also enhanced cell migration, suggesting that regulation of ROS concentration might play a role in migration of HBSMCs. NAC treatment may reduce endogenous ROS generation in HBSMCs.

Effect of CSE on inflammatory cytokine release and NF-κB activation

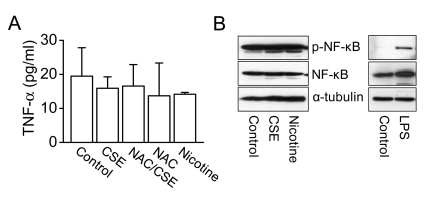
The TNF-α concentration was analyzed in the supernatants obtained after CSE treatment of HBSMCs. CSE had no significant effect on TNF-α concentration compared with that in the control (Fig. 3A, 15.9±3.4 pg/ml in CSE versus 19.5±8.4 pg/ml in control), and CSE (10%) failed to induce NF-κB activation (Fig. 3B). Nicotine (10µM), a major component of CSE, also failed to increase TNF-α concentration and NF-κB activation (Fig. 3). CSE (0.01~1%) reduced NF-κB activation compared with the control (data not shown).

Effect of CSE on intracellular Ca2+ changes and cell contraction

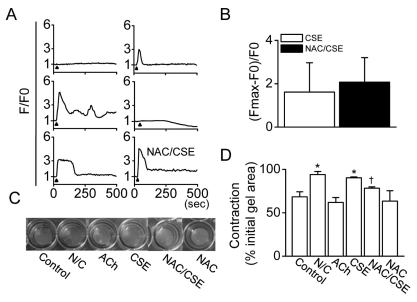
To identify CSE-induced changes in [Ca2+]i, a calcium image analysis was performed. The addition of 10% CSE to the normal physiological solution transiently increased [Ca2+]i in the HBSMCs. The application of the 10% CSE produced different patterns of transient Ca2+ spikes in the HBSMCs (Fig. 4A). The 10% CSE treatment induced a low repetitive Ca2+ spike in some HBSMCs while some cells showed a high Ca2+ spike with or without a plateau in response to CSE treatment. These Ca2+ responses were observed in 128 of 200 HBSMCs. However, the rest of the cells (72 of 200, 34.6±11.3%) did not produce Ca2+ peaks or showed reduction in response to 10% CSE (Fig. 4A). The combined treatment with both CSE and NAC did not show significant increase in the levels of intracellular Ca2+ (CSE: 1.6±1.4 in 200 of 200; CSE+NAC: 2.1±1.1 in 66 of 66, Fig. 4B). The combined treatment with CSE and NAC also showed similar patterns of transient Ca2+ spike to CSE treatment (data not shown). As shown in Fig. 4A, the changes in [Ca2+]i were represented as fluorescence intensity (F), and the F was normalized to basal F before CSE treatment (F/F0). The net changes in F shown in Fig. 4B were calculated with subtraction of F0 from the maximum level of F showing after the addition of 10% CSE divided by F0 ((Fmax-F0)/F0). The data shown in Fig. 4B were obtained from average of all data tested in this study.
Cell contraction is a result of cell proliferation, migration, Ca2+ changes, or cytokine release. To test whether CSE modulates the contractility of HBSMCs, a gel contraction assay was performed. The addition of 10% CSE to the HBSMC gels reduced contractility by 32% compared with the control (Fig. 4C), and the area of the treated gels was larger than that of the control gels (Fig. 4D). However, the treatment combination of CSE with NAC increased contraction compared with the cells treated only with CSE (Fig. 4C and D). The results of combined treatment with both CSE and Ca2+ chelator (EGTA or BAPTA) could not be clearly analyzed because the gel's properties were transformed (e.g. gel is torn easily) (data not shown).

DISCUSSION

In this study, CSE showed an inhibitory effect on cell proliferation, migration, and contraction of normal HBSMCs. However, we could not find a direct effect of CSE on TNF-α secretion or on the NF-κB activation of HBSMCs. Numerous studies have reported that CSE has a deleterious effect on cellular proliferation, migration, and contraction, and thus, CSE induces lung diseases, such as COPD, lung cancer, and asthma. Cell proliferation is required for airway remodeling, which includes hypertrophy and hyperplasia. However, in both our previous and this current study, CSE induced cell death through ROS generation in HBSMCs [11]. Control of ROS generation could be a factor for regulation regulation of cell proliferation [26]. Studies in the CSE's effect on cell proliferation show varying results. Some researchers have reported that CSE promotes the cell proliferation of bovine tracheal SMCs [27] and human aortic SMCs [28]. However, other researchers have reported that CSE induces apoptosis of human airway SMCs [29,30] and human pulmonary endothelial cells [22], which is consistent with our results. These different results are likely due to use of different cell types, CSE isolation methods, and CSE components.
CS is a mixture of more than 4,000 different compounds that include significant amounts of free radicals, toxins, and electrophiles [2,28]. The components differ depending on the isolation methods, producing smoke particles that are heptane-, water-, or DMSO-soluble. Of the many chemicals in CSE, nicotine is one of the most active pharmacological compounds. Nicotine has anti-inflammatory effects in ulcerative colitis and has been shown to decrease the release of interleukin 1β and TNF-α in alveolar macrophages [31-34]. In addition, nicotine promotes vascular SMC migration [35]. The components of CSE, including nicotine, can induce changes such cell proliferation, cell migration, TNF-α secretion, and contraction in many types of cells. Heptane- and DMSO-soluble smoke particles, but not water-soluble smoke particles, enhanced contractile responses in vasculature and airway [28]. However, chronic treatment of bovine tracheal smooth muscle strips with CSE decreased maximal methacholine- and KCl-induced contraction [27]. In contrast, acute exposure to CSE leads to airway relaxation in mice, which is partially mediated by nicotine [19].
CSE increases TNF-α expression and secretion in human keratinocytes [8] and mouse middle ear cells [9]. Many studies indicate that CSE induces changes in TNF-α expression [36,37], but there are no direct reports from bronchial SMCs. In contrast, CSE inhibited nuclear factor kappa B (NF-κB) expression in human airway SMCs [28]. NF-κB is a key molecule for the induction of TNF-α. Other studies reported that CSE induced nuclear transcription of NF-κB and COX-2 genes in human tracheal SMCs [38, 39]. In our study, CSE (10%) had no effect on TNF-α release and NF-κB activation. Low levels (0.01~1%) of CSE decreased NF-κB activation. The decrease in or the absence of change in TNF-α secretion and NF-κB activation in HBSMC could be resulted from anti-inflammatory effect of the nicotine in the CSE.
Changes in [Ca2+]i are responsible for the enhanced bronchial smooth muscle contraction induced by CSE [40]. CSE mobilized Ca2+ in cultured guinea pig jugular ganglia neurons and promoted contraction of isolated guinea pig bronchi [41]. In this study, however, not all HBSMCs exhibited CSE-induced Ca2+ increases. CSE even decreased the Ca2+ response in some cells. All cells did not respond to any treatments [42,43] because of differences in cell condition and cycles. The collagen gel contraction assay used in this study has been used to study the cell-mediated reorganization of the extracellular matrix and the contraction exerted collectively by a population of cells [44,45]. The contraction of cells showing a CSE-induced Ca2+ increase might be a compensation for the cell that show a CSE-induced Ca2+ decrease or no response. However, we cannot exactly explain the relationship between CSE and Ca2+ changes in the cell contraction because of gel's properties transformed by Ca2+ chelators. The inhibitory effect of CSE on contraction could be a result of cell death or a reduction in migration by the HBSMCs. CSE-induced cell death could affect cell migration, and the altered cell migration could affect cell contraction.
Our study found that CSE induced cell death and reduced cell migration and contraction via ROS generation. The combination of NAC with CSE blocked the CSE-induced changes in cell viability, migration, and contraction. CSE induced high ROS generation in HBSMCs. The control of ROS generation could be a key factor in CSE-induced airway remodeling. Our results suggest that CSE may induce airway change through cell death and reduction in migration and contraction of normal HBSMCs. Further studies will be needed to analyze the components of CSE extracted from different cigarettes to identify the molecular mechanism by which CSE affects cell proliferation, migration, TNF-α secretion, and contraction.

ACKNOWLEDGEMENTS

This work was supported a grant from the National Research Foundation of Korea, which is funded by the Korean government (KRF-2008-313-E00026).
The authors have no financial or commercial conflicts of interest in this study.

ABBREVIATIONS

CSE

cigarette smoke extract

HBSMCs

human bronchial smooth muscle cells

[Ca2+]i

intracellular Ca2+ concentration

NAC

N-acetyl-l-cysteine

ROS

reactive oxygen species

TNF

tumor necrosis factor

References

1. Banerjee S, Chattopadhyay R, Ghosh A, Koley H, Panda K, Roy S, Chattopadhyay D, Chatterjee IB. Cellular and molecular mechanisms of cigarette smoke-induced lung damage and prevention by vitamin C. J Inflamm (Lond). 2008; 5:21. PMID: 19014449.
crossref
2. Pryor WA, Stone K. Oxidants in cigarette smoke. Radicals, hydrogen peroxide, peroxynitrate, and peroxynitrite. Ann N Y Acad Sci. 1993; 686:12–27. PMID: 8512242.
crossref
3. Tang ML, Wilson JW, Stewart AG, Royce SG. Airway remodelling in asthma: current understanding and implications for future therapies. Pharmacol Ther. 2006; 112:474–488. PMID: 16759709.
crossref
4. Xu W, Hong W, Shao Y, Ning Y, Cai Z, Li Q. Nogo-B regulates migration and contraction of airway smooth muscle cells by decreasing ARPC 2/3 and increasing MYL-9 expression. Respir Res. 2011; 12:14. PMID: 21251247.
crossref
5. An SS, Fredberg JJ. Biophysical basis for airway hyperresponsiveness. Can J Physiol Pharmacol. 2007; 85:700–714. PMID: 17823634.
6. Sumi Y, Hamid Q. Airway remodeling in asthma. Allergol Int. 2007; 56:341–348. PMID: 17965577.
crossref
7. Doherty T, Broide D. Cytokines and growth factors in airway remodeling in asthma. Curr Opin Immunol. 2007; 19:676–680. PMID: 17720466.
crossref
8. Jeong SH, Park JH, Kim JN, Park YH, Shin SY, Lee YH, Kye YC, Son SW. Up-regulation of TNF-alpha secretion by cigarette smoke is mediated by Egr-1 in HaCaT human keratinocytes. Exp Dermatol. 2010; 19:e206–e212. PMID: 20653771.
crossref
9. Preciado D, Kuo E, Ashktorab S, Manes P, Rose M. Cigarette smoke activates NFκB-mediated Tnf-α release from mouse middle ear cells. Laryngoscope. 2010; 120:2508–2515. PMID: 21108432.
crossref
10. Barnes PJ. Mediators of chronic obstructive pulmonary disease. Pharmacol Rev. 2004; 56:515–548. PMID: 15602009.
crossref
11. Jeong YY, Park HJ, Cho YW, Kim EJ, Kim GT, Mun YJ, Lee JD, Shin JH, Sung NJ, Kang D, Han J. Aged red garlic extract reduces cigarette smoke extract-induced cell death in human bronchial smooth muscle cells by increasing intracellular glutathione levels. Phytother Res. 2011.
crossref
12. Li QF, Tang DD. Role of p47(phox) in regulating Cdc42GAP, vimentin, and contraction in smooth muscle cells. Am J Physiol Cell Physiol. 2009; 297:C1424–C1433. PMID: 19812368.
13. van der Vaart H, Postma DS, Timens W, ten Hacken NH. Acute effects of cigarette smoke on inflammation and oxidative stress: a review. Thorax. 2004; 59:713–721. PMID: 15282395.
crossref
14. Marthan R, Roux E, Savineau JP. Human bronchial smooth muscle responsiveness after in vitro exposure to oxidizing pollutants. Cell Biol Toxicol. 1996; 12:245–249. PMID: 9034616.
crossref
15. Ben-Jebria A, Marthan R, Rossetti M, Savineau JP, Ultman JS. Effect of in vitro exposure to acrolein on carbachol responses in rat trachealis muscle. Respir Physiol. 1993; 93:111–123. PMID: 8367612.
16. Xu LJ, Dandurand RJ, Lei M, Eidelman DH. Airway hyperresponsiveness in cigarette smoke-exposed rats. Lung. 1993; 171:95–107. PMID: 8426466.
crossref
17. Wu ZX, Lee LY. Airway hyperresponsiveness induced by chronic exposure to cigarette smoke in guinea pigs: role of tachykinins. J Appl Physiol. 1999; 87:1621–1628. PMID: 10562600.
18. Barrett EG, Wilder JA, March TH, Espindola T, Bice DE. Cigarette smoke-induced airway hyperresponsiveness is not dependent on elevated immunoglobulin and eosinophilic inflammation in a mouse model of allergic airway disease. Am J Respir Crit Care Med. 2002; 165:1410–1418. PMID: 12016105.
crossref
19. Streck E, Jörres RA, Huber RM, Bergner A. Effects of cigarette smoke extract and nicotine on bronchial tone and acetylcholine-induced airway contraction in mouse lung slices. J Investig Allergol Clin Immunol. 2010; 20:324–330.
20. Karaki H, Ozaki H, Hori M, Mitsui-Saito M, Amano K, Harada K, Miyamoto S, Nakazawa H, Won KJ, Sato K. Calcium movements, distribution, and functions in smooth muscle. Pharmacol Rev. 1997; 49:157–230. PMID: 9228665.
21. Baglole CJ, Sime PJ, Phipps RP. Cigarette smoke-induced expression of heme oxygenase-1 in human lung fibroblasts is regulated by intracellular glutathione. Am J Physiol Lung Cell Mol Physiol. 2008; 295:L624–L636. PMID: 18689604.
crossref
22. Nana-Sinkam SP, Lee JD, Sotto-Santiago S, Stearman RS, Keith RL, Choudhury Q, Cool C, Parr J, Moore MD, Bull TM, Voelkel NF, Geraci MW. Prostacyclin prevents pulmonary endothelial cell apoptosis induced by cigarette smoke. Am J Respir Crit Care Med. 2007; 175:676–685. PMID: 17255567.
crossref
23. Smelter DF, Sathish V, Thompson MA, Pabelick CM, Vassallo R, Prakash YS. Thymic stromal lymphopoietin in cigarette smoke-exposed human airway smooth muscle. J Immunol. 2010; 185:3035–3040. PMID: 20660708.
crossref
24. Lau WK, Chan SC, Law AC, Ip MS, Mak JC. The role of MAPK and Nrf2 pathways in ketanserin-elicited attenuation of cigarette smoke-induced IL-8 production in human bronchial epithelial cells. Toxicol Sci. 2011.
crossref
25. Lee SA, Kim HJ, Chang KC, Baek JC, Park JK, Shin JK, Choi WJ, Lee JH, Paik WY. DHA and EPA down-regulate COX-2 expression through suppression of NF-kappaB activity in LPS-treated human umbilical vein endothelial cells. Korean J Physiol Pharmacol. 2009; 13:301–307. PMID: 19885014.
26. Lee DH, Choi HC, Lee KY, Kang YJ. Aprotinin inhibits vascular smooth muscle cell inflammation and proliferation via induction of HO-1. Korean J Physiol Pharmacol. 2009; 13:123–129. PMID: 19885007.
crossref
27. Pera T, Gosens R, Lesterhuis AH, Sami R, Toorn M, Zaagsma J, Meurs H. Cigarette smoke and lipopolysaccharide induce a proliferative airway smooth muscle phenotype. Respir Res. 2010; 11:48. PMID: 20429916.
crossref
28. Xu CB, Lei Y, Chen Q, Pehrson C, Larsson L, Edvinsson L. Cigarette smoke extracts promote vascular smooth muscle cell proliferation and enhances contractile responses in the vasculature and airway. Basic Clin Pharmacol Toxicol. 2010; 107:940–948. PMID: 20618305.
crossref
29. Hu W, Xie J, Zhao J, Xu Y, Yang S, Ni W. Involvement of Bcl-2 family in apoptosis and signal pathways induced by cigarette smoke extract in the human airway smooth muscle cells. DNA Cell Biol. 2009; 28:13–22. PMID: 19090673.
crossref
30. Oltmanns U, Chung KF, Walters M, John M, Mitchell JA. Cigarette smoke induces IL-8, but inhibits eotaxin and RANTES release from airway smooth muscle. Respir Res. 2005; 6:74. PMID: 16029496.
crossref
31. Sandborn WJ. Nicotine therapy for ulcerative colitis: a review of rationale, mechanisms, pharmacology, and clinical results. Am J Gastroenterol. 1999; 94:1161–1171. PMID: 10235187.
crossref
32. Goerig M, Ullrich V, Schettler G, Foltis C, Habenicht A. A new role for nicotine: selective inhibition of thromboxane formation by direct interaction with thromboxane synthase in human promyelocytic leukaemia cells differentiating into macrophages. Clin Investig. 1992; 70:239–243.
crossref
33. Tsoyi K, Jang HJ, Kim JW, Chang HK, Lee YS, Pae HO, Kim HJ, Seo HG, Lee JH, Chung HT, Chang KC. Stimulation of alpha7 nicotinic acetylcholine receptor by nicotine attenuates inflammatory response in macrophages and improves survival in experimental model of sepsis through heme oxygenase-1 induction. Antioxid Redox Signal. 2011; 14:2057–2070. PMID: 21083424.
crossref
34. Joe Y, Kim HJ, Kim S, Chung J, Ko MS, Lee WH, Chang KC, Park JW, Chung HT. Tristetraprolin mediates anti-inflammatory effects of nicotine in lipopolysaccharide-stimulated macrophages. J Biol Chem. 2011; 286:24735–24742. PMID: 21606497.
crossref
35. Yoshiyama S, Horinouchi T, Miwa S, Wang HH, Kohama K, Nakamura A. Effect of cigarette smoke components on vascular smooth muscle cell migration toward platelet-derived growth factor BB. J Pharmacol Sci. 2011; 115:532–535. PMID: 21422730.
crossref
36. Moodie FM, Marwick JA, Anderson CS, Szulakowski P, Biswas SK, Bauter MR, Kilty I, Rahman I. Oxidative stress and cigarette smoke alter chromatin remodeling but differentially regulate NF-kappaB activation and proinflammatory cytokine release in alveolar epithelial cells. FASEB J. 2004; 18:1897–1899. PMID: 15456740.
37. Vayssier M, Favatier F, Pinot F, Bachelet M, Polla BS. Tobacco smoke induces coordinate activation of HSF and inhibition of NFkappaB in human monocytes: effects on TNFalpha release. Biochem Biophys Res Commun. 1998; 252:249–256. PMID: 9813178.
38. Cheng SE, Luo SF, Jou MJ, Lin CC, Kou YR, Lee IT, Hsieh HL, Yang CM. Cigarette smoke extract induces cytosolic phospholipase A2 expression via NADPH oxidase, MAPKs, AP-1, and NF-kappaB in human tracheal smooth muscle cells. Free Radic Biol Med. 2009; 46:948–960. PMID: 19280714.
39. Yang CM, Lee IT, Lin CC, Yang YL, Luo SF, Kou YR, Hsiao LD. Cigarette smoke extract induces COX-2 expression via a PKCalpha/c-Src/EGFR, PDGFR/PI3K/Akt/NF-kappaB pathway and p300 in tracheal smooth muscle cells. Am J Physiol Lung Cell Mol Physiol. 2009; 297:L892–L902. PMID: 19717552.
40. Chiba Y, Murata M, Ushikubo H, Yoshikawa Y, Saitoh A, Sakai H, Kamei J, Misawa M. Effect of cigarette smoke exposure in vivo on bronchial smooth muscle contractility in vitro in rats. Am J Respir Cell Mol Biol. 2005; 33:574–581. PMID: 16166743.
41. Andrè E, Campi B, Materazzi S, Trevisani M, Amadesi S, Massi D, Creminon C, Vaksman N, Nassini R, Civelli M, Baraldi PG, Poole DP, Bunnett NW, Geppetti P, Patacchini R. Cigarette smoke-induced neurogenic inflammation is mediated by alpha,beta-unsaturated aldehydes and the TRPA1 receptor in rodents. J Clin Invest. 2008; 118:2574–2582. PMID: 18568077.
42. Lee B, Vermassen E, Yoon SY, Vanderheyden V, Ito J, Alfandari D, De Smedt H, Parys JB, Fissore RA. Phosphorylation of IP3R1 and the regulation of [Ca2+]i responses at fertilization: a role for the MAP kinase pathway. Development. 2006; 133:4355–4365. PMID: 17038520.
43. Cho SK, Yoon SY, Hur CG, Yang HY, Choe C, Kim EJ, Joo JS, Kang KR, Park JY, Hong SG, Han J, Kang D. Acetylcholine rescues two-cell block through activation of IP3 receptors and Ca2+/calmodulin-dependent kinase II in an ICR mouse strain. Pflugers Arch. 2009; 458:1125–1136. PMID: 19484474.
44. Bell E, Ivarsson B, Merrill C. Production of a tissue-like structure by contraction of collagen lattices by human fibroblasts of different proliferative potential in vitro. Proc Natl Acad Sci USA. 1979; 76:1274–1278. PMID: 286310.
crossref
45. Vernon RB, Gooden MD. An improved method for the collagen gel contraction assay. In Vitro Cell Dev Biol Anim. 2002; 38:97–101. PMID: 11929002.
crossref
Fig. 1
CSE-induced cell death in HBSMCs. (A) The effect of CSE on HBSMC viability. HBSMCs were exposed to 0 to 30% CSE for 24 h. (B) CSE-induced ROS generation in HBSMCs. Representative photomicrographs of HBSMCs labeled with H2DCFDA to evaluate ROS generation (left panel, fluorescent image; right panel, phase contrast). The ROS levels in the cells were quantified by fluorescence microscopy after 4 h of CSE treatment. NAC was pretreated 1 h before CSE treatment. The 10% CSE and 3 mM NAC were applied to HBSMCs. The scale bar represents 100µm. (C) The effect of NAC on HBSMC viability. HBSMCs were exposed to 10% CSE and/or NAC (3 mM) for 24 h. Each bar is the mean±SD of five independent experiments. The plus and minus signs (+ and -) represent conditions with and without each treatment, respectively. *p<0.05 compared with the corresponding control (0% or -/-), p<0.05 compared with the CSE treatment.
kjpp-15-397-g001
Fig. 2
CSE-induced reduction of cell migration. (A) Migration ability of HBSMCs by CSE treatment. Phase-contrast images of wound areas at 0, 6, 12, and 24 h after 10% CSE treatment. (B) Representative microscopic images of migrating cells by 3-D migration assays. HBSMCs were seeded onto the transwell culture inserts and incubated at 37℃ for 12 h. Migrated cells remaining on the bottom surface were stained with 1% methylene blue. (C) Summary of effect of CSE on migration ability of HBSMCs. Each bar is the mean±SD of five independent experiments. The scale bar represents 100µm. *p<0.05 compared with the control (-/-), p<0.05 compared with the CSE treatment.
kjpp-15-397-g002
Fig. 3
Effect of CSE on TNF-α secretion and NF-κB activation in HBSMCs. (A) TNF-α concentration secreted from HBSMCs by CSE treatment. HBSMCs were treated with 10% CSE and/or 3 mM NAC for 24 h. Nicotine (10µM) effect was compared with the control. The supernatants were collected and measured using a TNF-α ELISA kit. Each bar is the mean±SD of seven independent experiments. (B) No effect of CSE on NF-κB activation. HBSMCs were treated with CSE (10%) or nicotine (10µM) for 24 h. Total protein was extracted and subjected to western blot analysis using anti-NF-κB and anti-phospho-NF-κB antibodies. Lipopolysacarride was used as a positive control for NF-κB activation [25]. The time of chemiluminescent reaction was controlled to show strong signals.
kjpp-15-397-g003
Fig. 4
Effect of CSE on intracellular Ca2+ increase and cell contraction. (A) CSE-induced Ca2+ wave patterns in HBSMCs. CSE (10%) was applied to the bath medium. Arrowheads indicate the addition of CSE and/or NAC. (B) Effect of NAC on the CSE-induced Ca2+ increase. The net change in Ca2+ levels was normalized to F0 (Fmax-F0/F0), and the data obtained from all cells were averaged. Fmax and F0 represent the maximum fluorescence level and initial fluorescence intensity of a cell. (C) Representative photographs of collagen matrices in a collagen gel contraction assay. Cells were exposed to control medium or medium containing 10% CSE for 24 h. N/C represents negative control containing BDM (a contraction inhibitor). ACh represents acetylcholine, which was used as a positive control. (D) Summary of the evaluation of assay results of cell contraction. Each bar is the mean±SD of five independent experiments. *p<0.05 compared with the control, p<0.05 compared with the CSE treatment.
kjpp-15-397-g004
TOOLS
Similar articles