Experimental data for analysis
To simulate temperature-dependent properties of the APs, we performed experiments using Aplysia neurons. In these experiments, the cells showed a bursting-oscillation pattern at temperatures between 28.8℃ and 32.2℃ and then became silent when the temperature was increased over about 35℃. However, the temperature had to be reduced to prevent the cell from becoming silent after the bursting-oscillation pattern appeared because the silent state at high temperature could influence the activity of APs.
Table 1 shows the conditions of each experiment (Experiment A to E). In these experiments the species
A. juliana and
A. kurodai were used. Only large cell somata bigger than ~100 micron were selected for recording and these neurons were located at the dorsal surface of the left caudal quarter-ganglion. The temperature was controlled between 6.9℃ and 32.4℃. The total length of time for recording was between 351 and 2,719 min. The total number of spikes recorded from each neuron was from 35,983 to 125,487. The average firing rate was between 33.9 min
-1 and 102.5 min
-1. The duration of recording sections subjected to data analysis varied from 29 to 66 min. In
Table 1, we selected the five datasets of the experiments that showed the following seven spiking patterns sequentially as temperature increased: silent, beating (sinusoidal bursting with a very long burst duration and short interburst intervals (IBI)), doublets, beating-chaos, bursting-chaos, square-wave bursting, and bursting-oscillation. In these experiments when the temperature was decreased over a similar range, the above seven patterns reappeared in reverse order. For each of the five separate experiments the temperature intervals corresponding to each spiking pattern are presented at the bottom of
Table 1, suggesting that the firing pattern is likely determined by the instantaneous temperature; there were no data acquired below 15.2℃ in Experiment D (no silent state), and above 25.9℃ in Experiment E (no bursting-oscillation).
Table 1
Dissection and electrophysiological properties for the experiments A to E and details of the seven different firing patterns observed in the acquired data. Silent, beating (bursting with very long burst duration and short interburst intervals), doublet, beating chaos, bursting chaos, bursting, and bursting oscillation patterns are shown
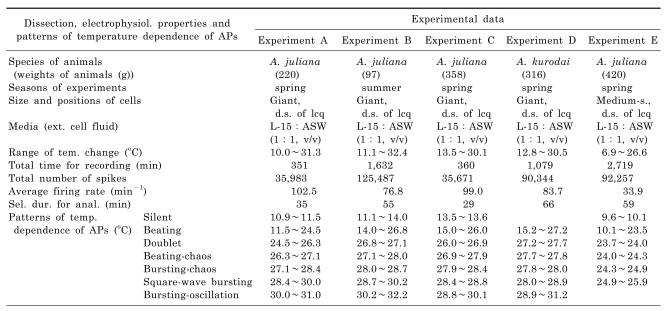

Fig. 1 displays the averaged values of AP parameters as a function of temperature. The IBI has larger errors bars than the other AP parameters. The A
AP, Δt
AP, 1/2, and ISI decreased with increasing temperature. The IBI in
Fig. 1 E also decreased with increasing temperature; however, the error bars in
Fig. 1 E from 20℃ to 24℃ are relatively large because different values of the IBI in the sinusoidal bursting pattern appeared at different temperatures within these temperature ranges. |V
np| in
Fig. 1B and the Frequency in
Fig. 1 F increased with increasing temperature. Likewise, the spiking frequencies of warm (cold) receptors increase as the temperature increase (decrease).
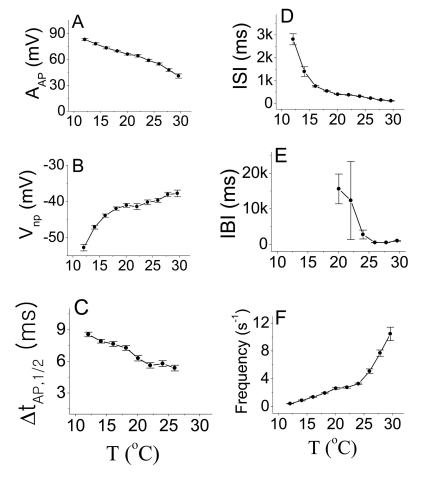 | Fig. 1Average values of six AP parameters with error bars. AAP, ΔtAP, 1/2, ISI, and IBI displayed in panels A, C, D, and E, respectively, decreased as temperature increased. |Vnp| and Frequency displayed in panels B and F, respectively, increased as temperature increased. 
|
Based on these experimental results, we wanted to compose equations to simulate all of the seven different spiking patterns. In order to do this, we selected experimental data from two of the five experiments, i.e., Experiments A and B. Although the selected data had similar firing patterns, data from Experiment A displayed more stable firing patterns, especially in the doublet, beating-chaos, bursting-chaos, and square-wave bursting patterns. For this reason we chose to use the data from Experiment A to draw multiple graphs corresponding to each spiking pattern. It was also necessary to select a section of the data containing the properties of all of the spiking patterns; for this the 80-minute data which correspond to one temperature cycle was selected from the data of Experiment A. The temperature values and interval duration (ID) of APs are presented as functions of time in
Fig. 2. In this figure, it is shown that when the temperature was increased or decreased over the same temperature range, the same spiking patterns reappeared in reverse order. For example, when the temperature was decreased from 31℃ to 11℃, the seven firing patterns of
Aplysia neurons changed sequentially: bursting-oscillation, square-wave bursting, bursting-chaos, beating-chaos, doublets, beating, and silent. These spike trains in continuous time series are shown in
Fig. 3. The small box at the top of
Fig. 2 displays a magnified view of the IDs from 3,500 s to 4,000 s and clearly shows doublets appearing. The symbols "E1A"~"E4A (
Fig. 5)" written on the lower big plot correspond to the names of the panels that are displayed in more detail in
Fig. 4E1A to
Fig. 5E4A, respectively. Several sinusoidal burstings with very long burst duration and short IBI are shown by the sign looked like "∧" in the bottom trace in
Fig. 2. Since these signals appeared irregularly, we did not simulate these phenomena.
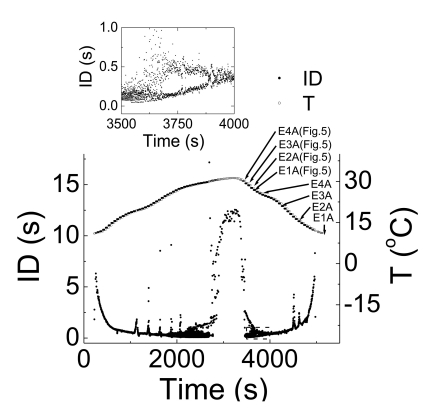 | Fig. 2Temperature and ID as a function of time. Data acquired from one temperature cycle in Experiment A are plotted. The near symmetry of the graph is taken to mean that the time-dependence of the data to be analyzed is reproducible. The small upper box displays a magnified view from 3,500 s to 4,000 s. The symbols E1A to E4A ( Fig. 5), written in the large bottom box correspond to the time series displayed in each panel in Fig. 4E1A to Fig. 5E4A. Sinusoidal bursting with very long burst duration and short IBI is shown by the sign looked like "∧" in the bottom trace. 
|
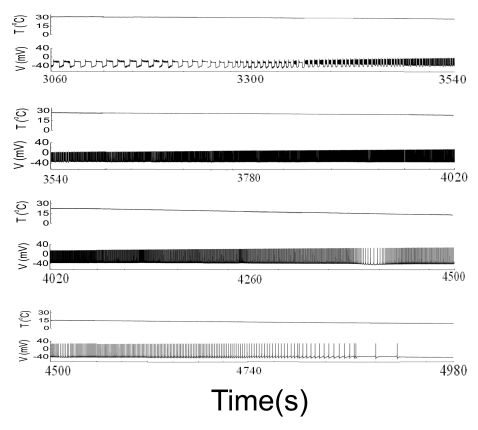 | Fig. 3The upper and lower traces represent temperature and membrane potential, respectively. When the temperature was decreased from 31℃ to 11℃, the seven firing patterns of Aplysia neurons changed sequentially: bursting-oscillation, square-wave bursting, bursting-chaos, beating-chaos, doublets, beating, and silent. 
|
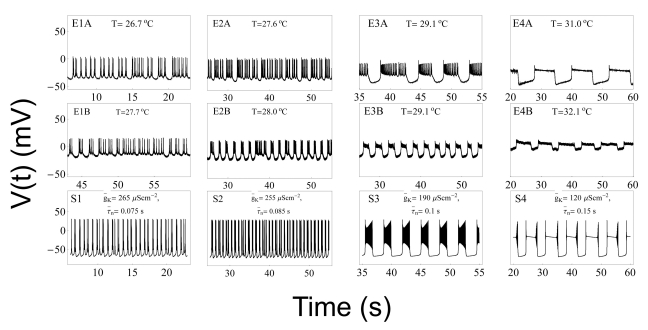 | Fig. 5Comparison of experimental results with results from computer simulations. Panels E1A~E4A display data from Experiment A. Panels E1B~E4B display data from Experiment B. The relevant temperatures are shown at the top of each box. Panels S1~S4 display values calculated from equations (1) to (4) using parameters from the type 1 model at the temperatures shown in panels E1A~E4A, respectively. The variables g̅K and τ̅n used in the simulations are shown at the top of the boxes in the bottom panel of each set of three panels. Panels E1A, E1B, and S1 display beating chaos. Panels E2A, E2B, and S2 display bursting chaos. Panels E3A, E3B, and S3 display square-wave bursting. Panels E4A, E4B, and S4 display bursting-oscillation. 
|
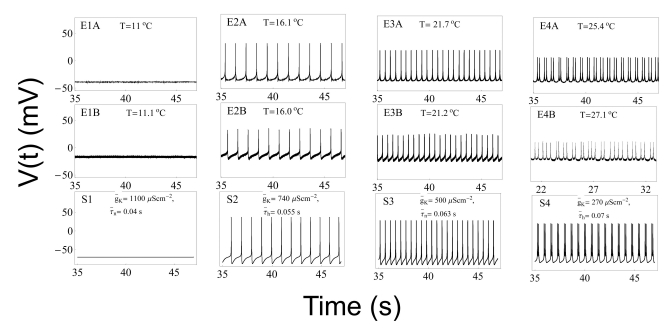 | Fig. 4Comparison of experimental results with results from computer simulations. Panels E1A~E4A display data from Experiment A. Panels E1B~E4B display data from Experiment B. The relevant temperatures are shown at the top of each box. Panels S1~S4 display values calculated from equations (1) to (4) using parameters from the type 1 model at the temperatures shown in panels E1A~E4A, respectively. The variables g̅K and τ̅n nused in the simulations are shown at the top of the boxes in the bottom panel of each set of three panels. Panels E1A, E1B, and S1 display silent pattern. Panels E2A, E3A, E2B, E3B, S2 and S3 display beating pattern. Panels E4A, E4B, and S4 display doublet pattern. 
|
The model
Although the Huber-Braun cold receptor model [
14,
15] describes cold receptors well, proper biophysical model for warm receptors has not been searched. To set up nonlinear differential equations that could simulate all of these various spiking patterns together, it was necessary to modify the equations (Chay-Lee model) derived by Chay and Lee [
6,
7] with temperature-dependent scaling factors; we adapted the temperature-dependent scaling factors for the ionic currents, ρ(T), and for the ionic kinetics, φ(T), that are used in the Huber-Braun cold receptor model. To consider a temperature-dependent scaling factor for reversal potentials (or Nernst potentials), a new temperature-dependent scaling factor, σ(T), was defined and used. The reference temperature T0 was also present in these new equations. As a result, we obtained equations using 23 parameters with temperature-like scaling factors to simulate the sequential firing patterns shown in
Fig. 3.
The cell membrane of this model contains sodium, calcium, and potassium channels carrying a fast sodium current, INa, fast calcium current, ICa, and a potassium current, IK, respectively. The sodium channel contains a fast-activated m gate and a fast-inactivated h gate upon depolarization. The calcium channel contains a fast-activated d gate and a slow-inactivated f gate. The potassium channel is controlled by an activated n gate. This membrane also contains a leak current, IL. And then the membrane potential, V, is given by
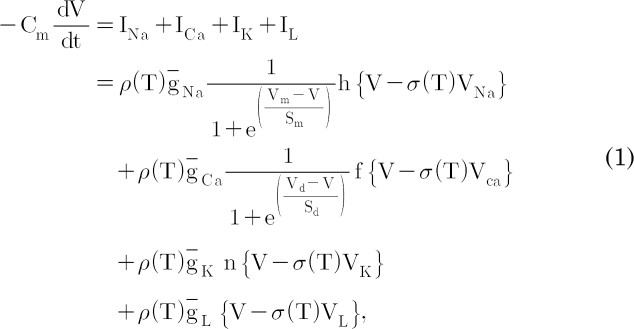
where C
m is the membrane capacitance. The temperature-dependent scaling factor, ρ(T), is defined as

; the temperature coefficient of the single-channel conductance is Q
10=1.35 [
18]. The other temperature-dependent scaling factor, σ(T), is defined as

. In Eq. (1), V
Na, V
Ca, V
K, and V
L are the Nernst potentials for the Na
+, Ca
++, K
+, and leak currents, respectively; and g̅
Na, g̅
Ca, g̅
K, and g̅
L are the maximal conductance for the respective currents. V
m and S
m, V
d and S
d are the half-maximal potentials and the slopes at these half-maximal potentials of the activation variables m and d, respectively. The inactivation variables h and f, and the activation variable n are all functions of voltage and time and these are described by the following differential equations,


where the temperature-dependent scaling factor, φ(T), is defined as

; many enzyme reactions have a Q
10 value near 3, as does the gating of many ion channels [
18]. The sigmoidal steady-state inactivations, h
∞ and f
∞ are defined as

and

, and the steady-state activation, n
∞, is defined as

. The parameters h
∞, f
∞, and n
∞ are functions of voltage and time. The relaxation time constants τ
h, τ
f, and τ
n are respectively defined as

,

, and

, where τ̅
h, τ̅
f, and τ̅
n are maximal time
constants; these are also functions of voltage and time. The actual forms of these variables are described in equations (2)~(4). The variables V
h and S
h, V
f and S
f, V
n and S
n are the half-maximal potentials and the slopes at these half-maximal potentials of h, f, and n, respectively.
We modified the equations derived by Chay and Lee [
6,
7] for excitable cells by adopting temperature-like scaling factors defined in the Huber-Braun model. This modified Chay-Lee model is required to explain the temperature dependence of the sequence of the seven different firing patterns. Various combinations of ρ(T), φ(T), and σ(T) are shown in
Table 2. Scaling factors in the type 1, 2 and 3 models have similar temperature-dependent scaling factors as those in the above mentioned paper by Braun et al. We tried to apply scaling factors that depend on temperature in this new equations as much as possible. To do this, we considered all eight combinations of scaling factors.
Table 2 and
3 contains details of the eight different type models obtained by changing the temperature-dependent scaling factors. In type 1 model g̅
K and τ̅
n were used as variables, and the temperature-dependent scaling factors used in the Huber-Braun cold receptor model were chosen. Although the reference temperature was 25℃ in the Huber-Braun model, in this model we took a value of 21℃ as the reference temperature because this represents the middle of the temperature range (from 11℃ to 31℃) of Experiment A. The type 2 and 3 models used the same combination of factors as type 1 model except that the variable g̅
Ca, τ̅
h was used in the type 2 and g̅
Ca in the type 3 instead of g̅
K,τ̅
n in type 1. The type 4 model is different from the type 1 because a scaling factor, σ(T) is considered in addition to the type 1 parameters. g̅
Ca is the only variable used in the type 4 model. The type 5 model differs from the type 1 model because a scaling factor for the maximum conductance of leak current is considered, and a new reference temperature, 23.2℃, is used. The type 6 model is the same as the type 5 except for an additional scaling factor, σ(T). The type 7 model is the same as the type 1 model except that the reference temperature is taken to be 11℃ and the variables g̅
Ca and τ̅
f are used instead of g̅
K and τ̅
n. Twenty one fixed parameters are used in the type 8 model and g̅
Ca and τ̅
h are variables [
19].
Table 2
Seven arrangements of temperature-dependent scaling parameters for maximum conductance and time constants


Table 3
Numerical values of the parameters in the models. The first seven parameters are the same in all eight model types. For the middle 11 parameters, numerical values in bold type indicate the parameters that have different values from that used in type 1. The last five parameters denote variables


From these eight types of model, it was necessary to select the best type of model to properly explain the temperature dependence of the sequence of firing patterns. Each value of the first seven parameters in
Table 3 was the same for all models. In the middle section of the table, numerical values in bold type indicate the parameter values that differ from the corresponding values in the type 1 model. The five parameters at the bottom of
Table 3 are variables: g̅
Ca, g̅
K, τ̅
h, τ̅
n, and τ̅
f. g̅
Ca is a variable in all of these seven types of model except the type 1 model.
It is, however, necessary to check other merit points of the type 1 model. The first merit point is that the type 1 model was obtained using the same kind of temperature-dependent scaling factors used by the Huber-Braun cold receptor model. The second one is that the temperature range of the doublet in the experiment (between 24.5℃ and 26.3℃) was similar to that in simulation results (between 24.0℃ and 26.5℃). The last point to consider is that g̅
K and τ̅
n were used as variables. These two variables are associated with the potassium channels. Interestingly, we found that the spiking pattern changed from beating to doublet (from
Fig. 8E1 to E2), when potassium channel blockers, TEA and 4-AP were used. It is noteworthy that this change phenocopies the temperature-induced change from beating to doublets (from
Fig. 4E3A to 4E4A). Therefore, the type 1 model was considered to be a suitable simulation model as it contains the potassium channel associated variables, g̅
K and τ̅
n. The procedure to draw figures using parameters of the type 1 model is as follows.
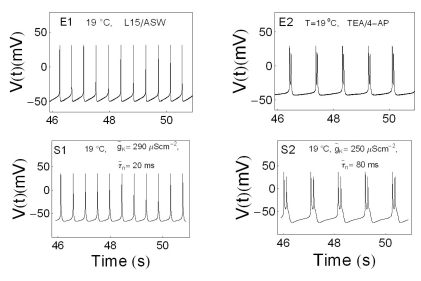 | Fig. 8Comparison of beating and bursting signals influenced or uninfluenced by drugs with simulation results. Panel E1 and E2 represents time series of APs without drug and with the treatment of drugs mixed with 10 mM TEA and 10 mM 4-AP, respectively. Panel S1 and S2 represents the results of computer simulation with modified Chay-Lee model with temperature-like scaling factors. 
|
Computer simulation
The time traces of APs in
Fig. 4S1 are plotted from the equations (1) to (4) at temperatures indicated in
Fig. 4E1A using the values of the maximal potassium conductance and maximal potassium time constant in
Fig. 4S1. Panels from
Fig. 4S2 to
Fig. 5S4 are also composed of the graphs plotted from these equations at temperatures indicated in the corresponding panels (from
Fig. 4E2A to
Fig. 5E4A) using the values of the corresponding potassium maximal conductances and maximal time constants shown in the panels from
Fig. 4S2 to
Fig. 5S4. In order to draw these graphs, we used the following numerical values in the type 1 model:
membrane capacitance: Cm=1µFcm-2;
the Nernst potentials for ions: VNa=80 mV, VCa=140 mV, VK=-90 mV, VL=-71 mV;
the maximal conductance: g̅Na=1,000µS cm-2, g̅Ca=28µS cm-2, g̅K=variable (120~1,100µS cm-2), g̅L=18µS cm-2;
maximal time constants: τ̅h= 0.16 s, τ̅f= 100 s, τ̅n= variable (0.040~0.150 s);
the half-maximal potentials: Vm=-12 mV, Vh=-35 mV, Vd=-48.4 mV, Vf=-54 mV, Vn=15 mV;
the slopes at the half-maximal potentials: Sm=6.4 mV, Sh=-5.4 mV, Sd=5.7 mV, Sf=-8.5 mV, Sn=15 mV;
reference temperature: T0=21℃.
The values of the variables g̅
K and τ̅
n used in each simulation are shown in the bottom panels of
Fig. 4 and
5.
To compare the simulation results with experimental results, eight sets of three figures are drawn in
Fig. 4 and
5. The time traces of membrane potentials displayed in the top panels of
Fig. 4 and
5 (from
Fig. 4E1A to
Fig. 5E4A) show a part of data from Experiment A shown in
Fig. 3, whereas those in the middle panels (from
Fig. 4E1B to
Fig. 5E4B) show a part of data from Experiment B. These sets of figures are arranged from low to high temperatures. Simulation results of the type 1 model are displayed in the bottom panels in
Fig. 4 and
5 (from
Fig. 4S1 to
Fig. 5S4); these figures were obtained by solving equations in modified Chay-Lee model using Mathematica 5.1. To summarize, the bottom panels of
Fig. 4 and
5 show the simulation results of this model at the temperatures shown in top panels; the used values of variables are shown in bottom panels.
In
Fig. 4 panels E1A, E1B, and S1 show silent patterns. Panels E2A , E3A, E2B, E3B, S2, and S3 show beating, whereas panels E4A, E4B, and S4 show doublet patterns. In
Fig. 5, panels E1A, E1B and S1 show beating-chaos, whereas panels E2A, E2B, and S2 show bursting-chaos. Panels E3A, E3B, and S3 show square-wave bursting, whereas panels E4A, E4B, and S4 show bursting-oscillations. Although the AP amplitudes in the simulation results (panels from
Fig. 4S1 to
Fig. 5S4) and the corresponding experimental results (from
Fig. 4E1A to
Fig. 5E4A) are slightly different, the frequencies of the time series of simulated APs are all very similar to the corresponding experimental results. This is in line with the fact that specific intensity information of environmental stimulus is transformed into a corresponding AP frequency in sensory receptors. Therefore, the simulation results of these eight model types can be interpreted as similar results to the experimental ones despite a little discrepancy in the AP amplitude simulation.
Fig. 6A and
Fig. 6B displays the values of variables, τ̅
n and g̅
K, respectively, with respect to temperature.
Fig. 6C displays the maximum time constant τ̅
n, divided by the temperature-like scaling factor φ(T), τ̅
n/φ(T) as a function of temperature. The solid line in this figure displays τ̅
n/φ(T) where τ̅
n varies with temperature with each value in the panel A; at low temperatures, the values of τ̅
n/φ(T) are lower, and at high temperatures those are higher than the expected values, which is shown as a dotted line in this panel.
Fig. 6D displays the maximum potassium conductance, g̅
K, multiplied by the temperature-like scaling factor ρ(T), i.e., ρ(T) · g̅
K. The solid line in this panel displays ρ(T) · g̅
K where g̅
K varies with temperature with each value in the panel B; the values of ρ(T) · g̅
K decrease, yet the expected values of these increase as the temperature increases.
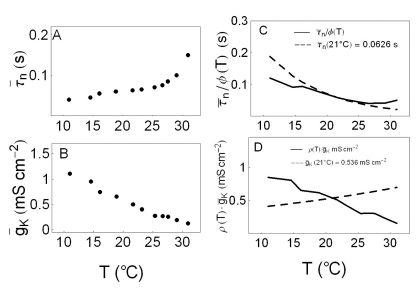 | Fig. 6Simulation variables. Panel A display the variation in τ̅n with respect to temperature. Panel B displays the variation in g̅K with respect to temperature. Panel C displays τ̅n/φ(T). In this panel the dotted line displays the value of τ̅n/φ(T) when τ̅n is a constant value at reference temperature 21℃. The solid line in panel C displays τ̅n/φ(T) with τ̅n as a variable represented in panel A at the corresponding temperatures. At low (high) temperatures the value of τ̅n/φ(T) is smaller (larger) than the expected value, which is shown as a dotted line. Panel D displays ρ(T)·g̅K. In this panel the dotted line displays the value of ρ(T)·g̅K when g̅K is a constant value at reference temperature of 21℃. The solid line in this panel displays the value of ρ(T)·g̅K with g̅K a variable represented in panel B at the corresponding temperatures. Although the dotted line increase as temperature increase, the solid line decrease. 
|
Fig. 7A, B, C displays the calcium current, I
Ca(t), the sodium current, I
Na(t), and the potassium current, I
K(t), as functions of time, respectively. The solid, dotted, dashed, dash-dotted, dashed-double dotted lines in panels from A to F are used to represent the variables as a function of time at temperatures 16.1℃, 21.7℃, 25.4℃, 27.6℃, and 31℃, respectively. As shown in
Fig. 7A the maximum calcium currents increase as the temperature rises until 21.7℃ and then decrease, but sodium currents increase as the temperature increases as shown in
Fig. 7B and inset figure. The maximum potassium current decreases as the temperature increases. This is shown in
Fig. 7C. Time series of the potassium conductance, g
K(t) are shown in
Fig. 7D. The maximum potassium conductance also decreases as the temperature increases. Time series of the potassium time constants τ
n(t) are shown in
Fig. 7E. The maximum values of τ
n(t) decrease as the temperature rises until 25.4℃ and then decrease as the temperature increases further.
Fig. 7F displays a time series of the probability of the opening of the potassium channel activation gate, n(t). In this panel, the maximum values of n(t) at high temperatures are larger than those at low temperatures. However, we need more experimental data to investigate the exact mechanisms inherent in determining the temperature-dependent properties of
Aplysia neurons. We then carried out the experiments with potassium channel blockers since potassium channels are known to critically regulate the shape of AP and the firing pattern.
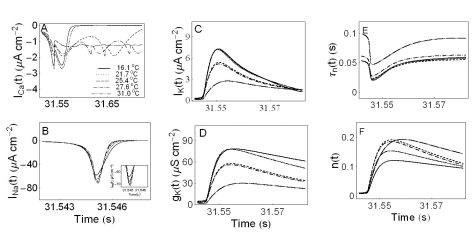 | Fig. 7Ionic currents and parameters as a function of time. Panel A, B, and C display ICa(t), INa(t), and IK(t), respectively. The solid, dotted, dashed, dash-dotted, dashed-doubledotted lines in panels from A to F are used to represent the variables as a function of time at temperatures 16.1℃, 21.7℃, 25.4℃, 27.6℃, and 31℃, respectively. Panel D displays gk(t). The potassium channel relaxation time constants τn(t) and the probabilities of openings for activation of the potassium channels n(t) as a function of time are shown in panels E and F, respectively. 
|
We used two distinct, specific potassium channel blockers TEA and 4-AP to find inter-relationships between TEA, 4-AP and APs. Our electrophysiological recording data revealed that TEA and 4-AP produced distinct pattern changes. Treatment of 10 mM TEA made AP frequency rise, width of APs wider, negative peak value rise, and amplitude of APs decrease. Treatment of 10 mM 4-AP made mostly opposite effects. It made AP frequency fall and width of APs narrower, and amplitude of APs increase, but negative peak value is not much affected. Mixing both 10 mM TEA and 10 mM 4-AP showed similar results to 10 mM TEA treatment (
data not shown). We also found that the spiking pattern changed from beating (
Fig. 8E1) to doublet (
Fig. 8E2) at 19℃ when mixed K
+ channel blockers (10 mM TEA and 10 mM 4-AP) were bath applied to
Aplysia neuron. It is noteworthy that this is similar to the change from beating (
Fig. 4E3A)to doublets (
Fig. 4E4A) when temperature was changed from 21.7℃ to 25.4℃. Fig. 8S1 and S2 represents the results of computer simulation with modified Chay-Lee model using the values of variables shown in each panel at 19℃.
Ionic currents and parameters analyzed in the experiments with drugs (
Fig. 8E1, E2, S1, and S2) or changing temperatures (
Fig. 4E3A, E4A, S3, and S4) are shown in
Fig. 9 as a function of time.
Fig. 9A and B display I
K(t) and g
K(t), respectively. The solid, dotted lines in the panels from A to D shows the time series of ionic currents and parameters without drugs and with drugs (10 mM TEA and 10 mM 4-AP) at 19℃, respectively. The dashed and dash-dotted lines in the panels from A to D show the time series of those parameters in the firing state of beating at 21.7℃ and in the spiking state of doublet at 25.4℃, respectively. The time series of the potassium channel relaxation time constant, τ
n(t) and the probabilities of the openings for the activation of the potassium channels, n(t) are shown in the panels C and D. The maximum value of τ
n(t) increases whereas the maximum value of n(t) decreases as temperature increases.
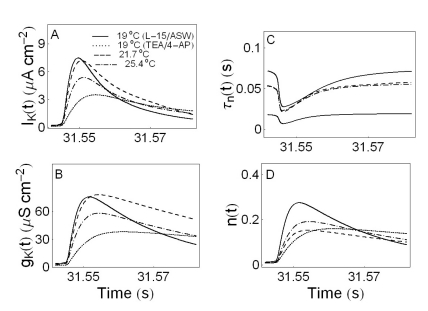 | Fig. 9Ionic currents and parameters as a function of time. Panel A and B display IK(t) and gK(t), respectively. The potassium channel relaxation time constants τn(t) and the probabilities of openings for activation of the potassium channels n(t) as a function of time are shown in panels C and D, respectively. The solid, dotted, dashed, and dash-dotted lines in panels from A to D indicate L15/ASW medium control without drugs at 19℃, L15/ASW medium containing 10 mM TEA and 10 mM 4-AP at 19℃, L15/ASW medium at 21.7℃, and L15/ASW medium at 25.4℃, respectively. 
|


 ; the temperature coefficient of the single-channel conductance is Q10=1.35 [18]. The other temperature-dependent scaling factor, σ(T), is defined as
  . In Eq. (1), VNa, VCa, VK, and VL are the Nernst potentials for the Na+, Ca++, K+, and leak currents, respectively; and g̅Na, g̅Ca, g̅K, and g̅L are the maximal conductance for the respective currents. Vm and Sm, Vd and Sd are the half-maximal potentials and the slopes at these half-maximal potentials of the activation variables m and d, respectively. The inactivation variables h and f, and the activation variable n are all functions of voltage and time and these are described by the following differential equations,


 ; many enzyme reactions have a Q10 value near 3, as does the gating of many ion channels [18]. The sigmoidal steady-state inactivations, h∞ and f∞ are defined as
  and
and  , and the steady-state activation, n∞, is defined as
  . The parameters h∞, f∞, and n∞ are functions of voltage and time. The relaxation time constants τh, τf, and τn are respectively defined as
  ,
,  , and
, and  , where τ̅h, τ̅f, and τ̅n are maximal time
constants; these are also functions of voltage and time. The actual forms of these variables are described in equations (2)~(4). The variables Vh and Sh, Vf and Sf, Vn and Sn are the half-maximal potentials and the slopes at these half-maximal potentials of h, f, and n, respectively.


 PDF
PDF ePub
ePub Citation
 Print
Print


 XML Download