Abstract
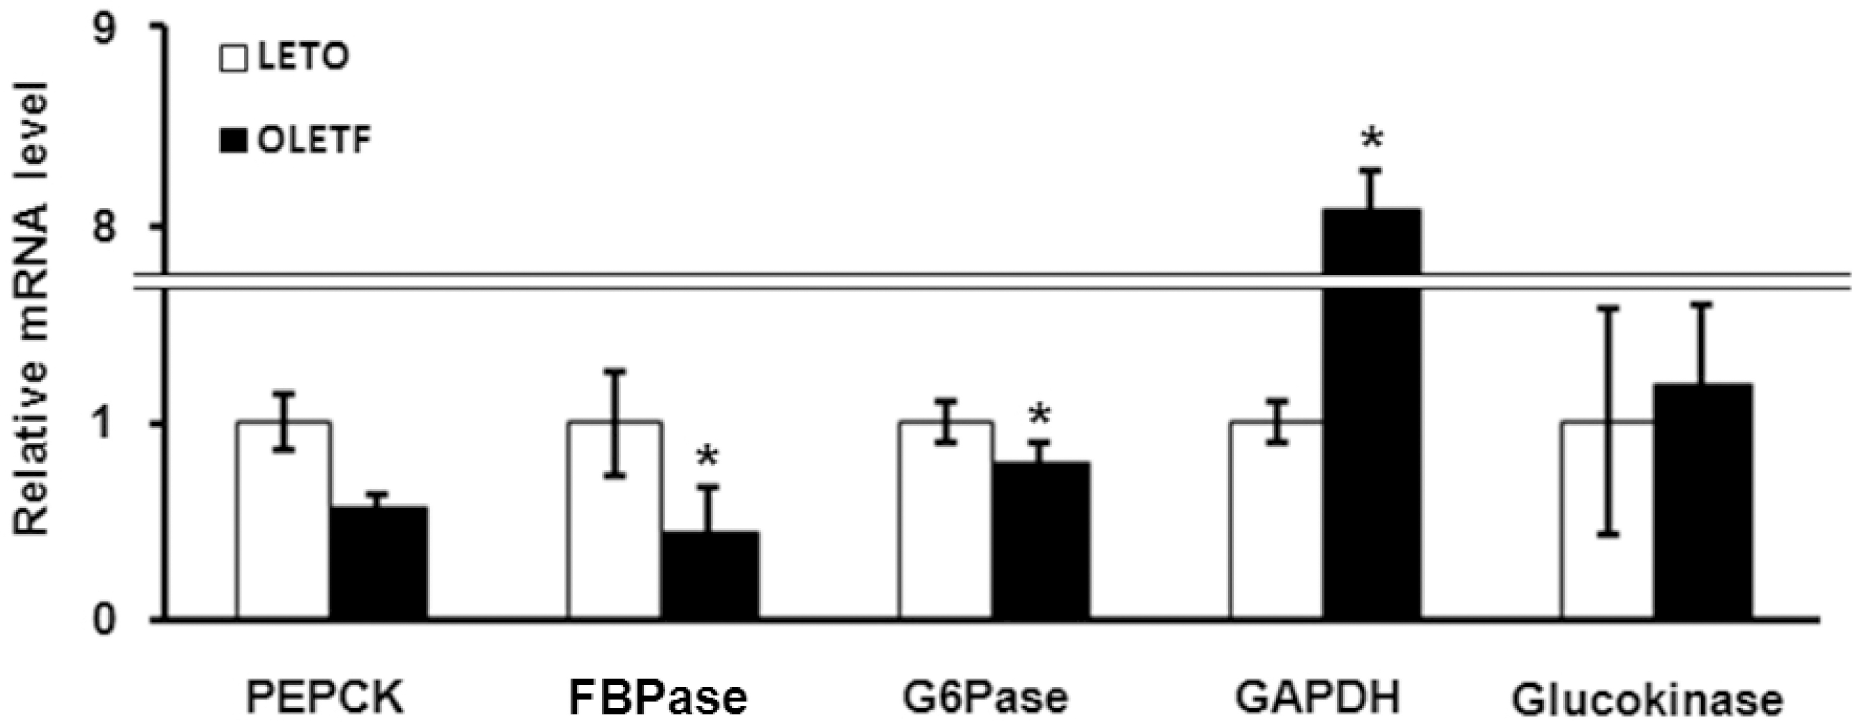
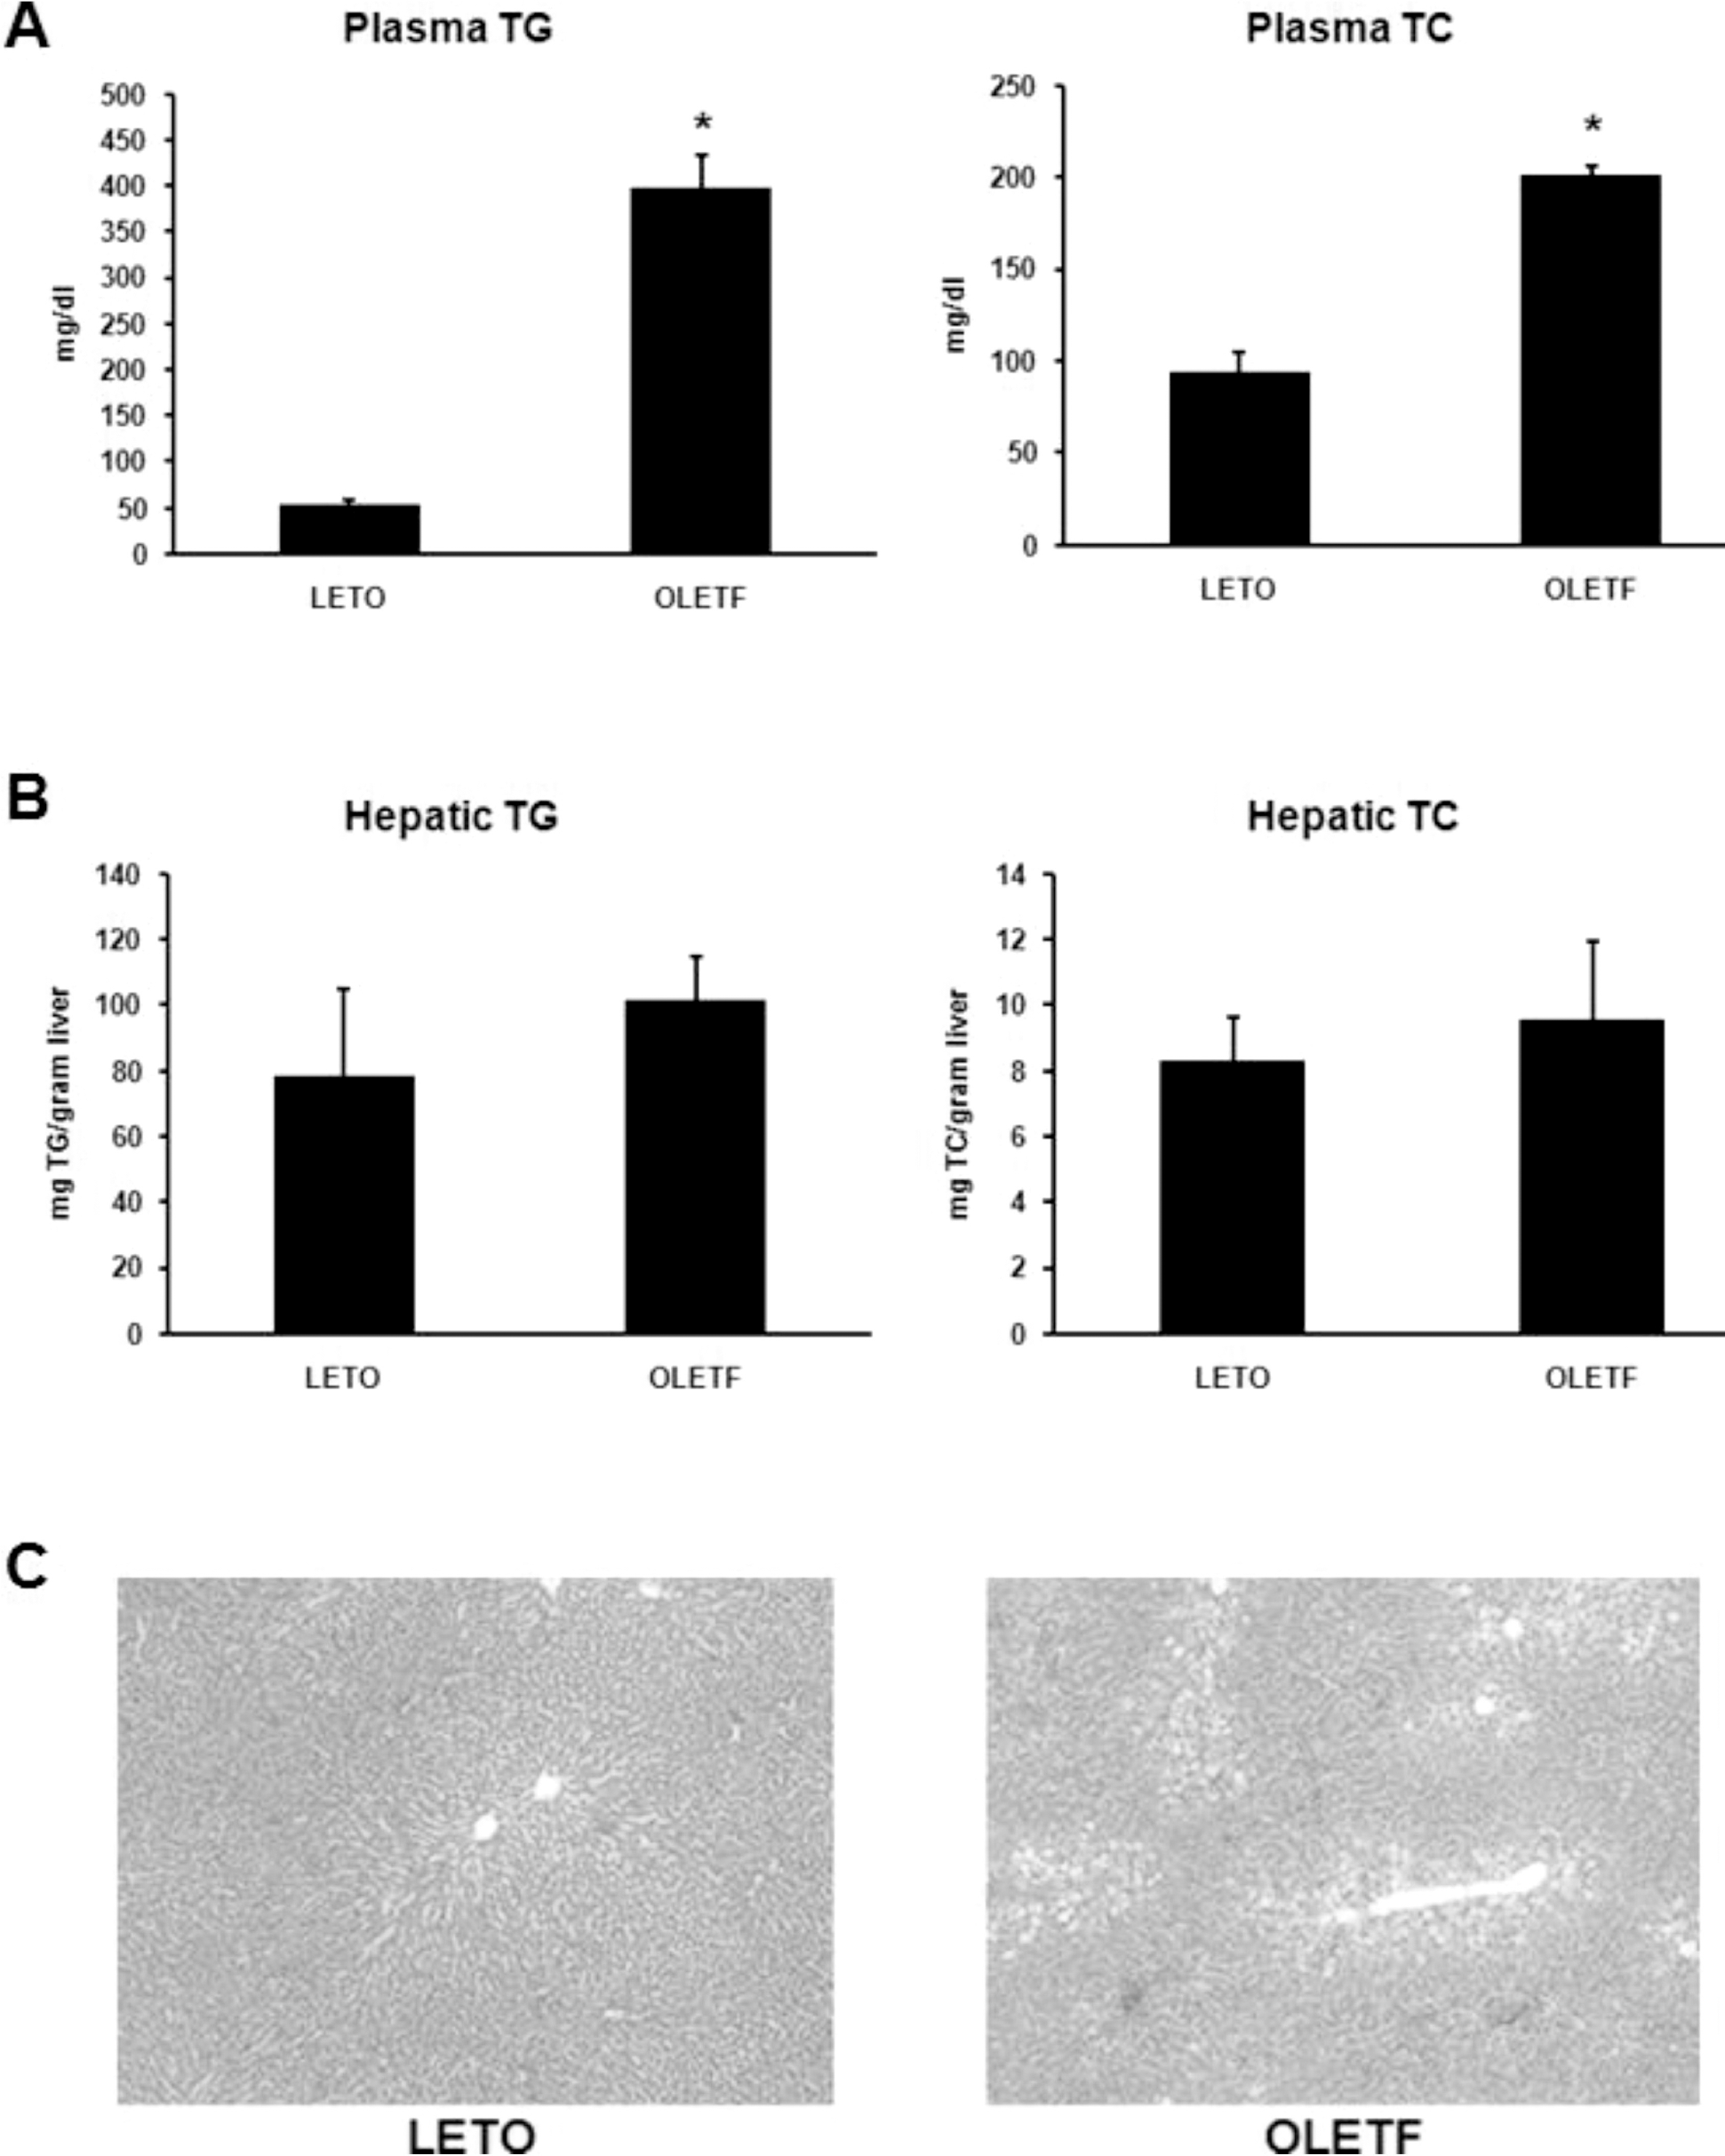
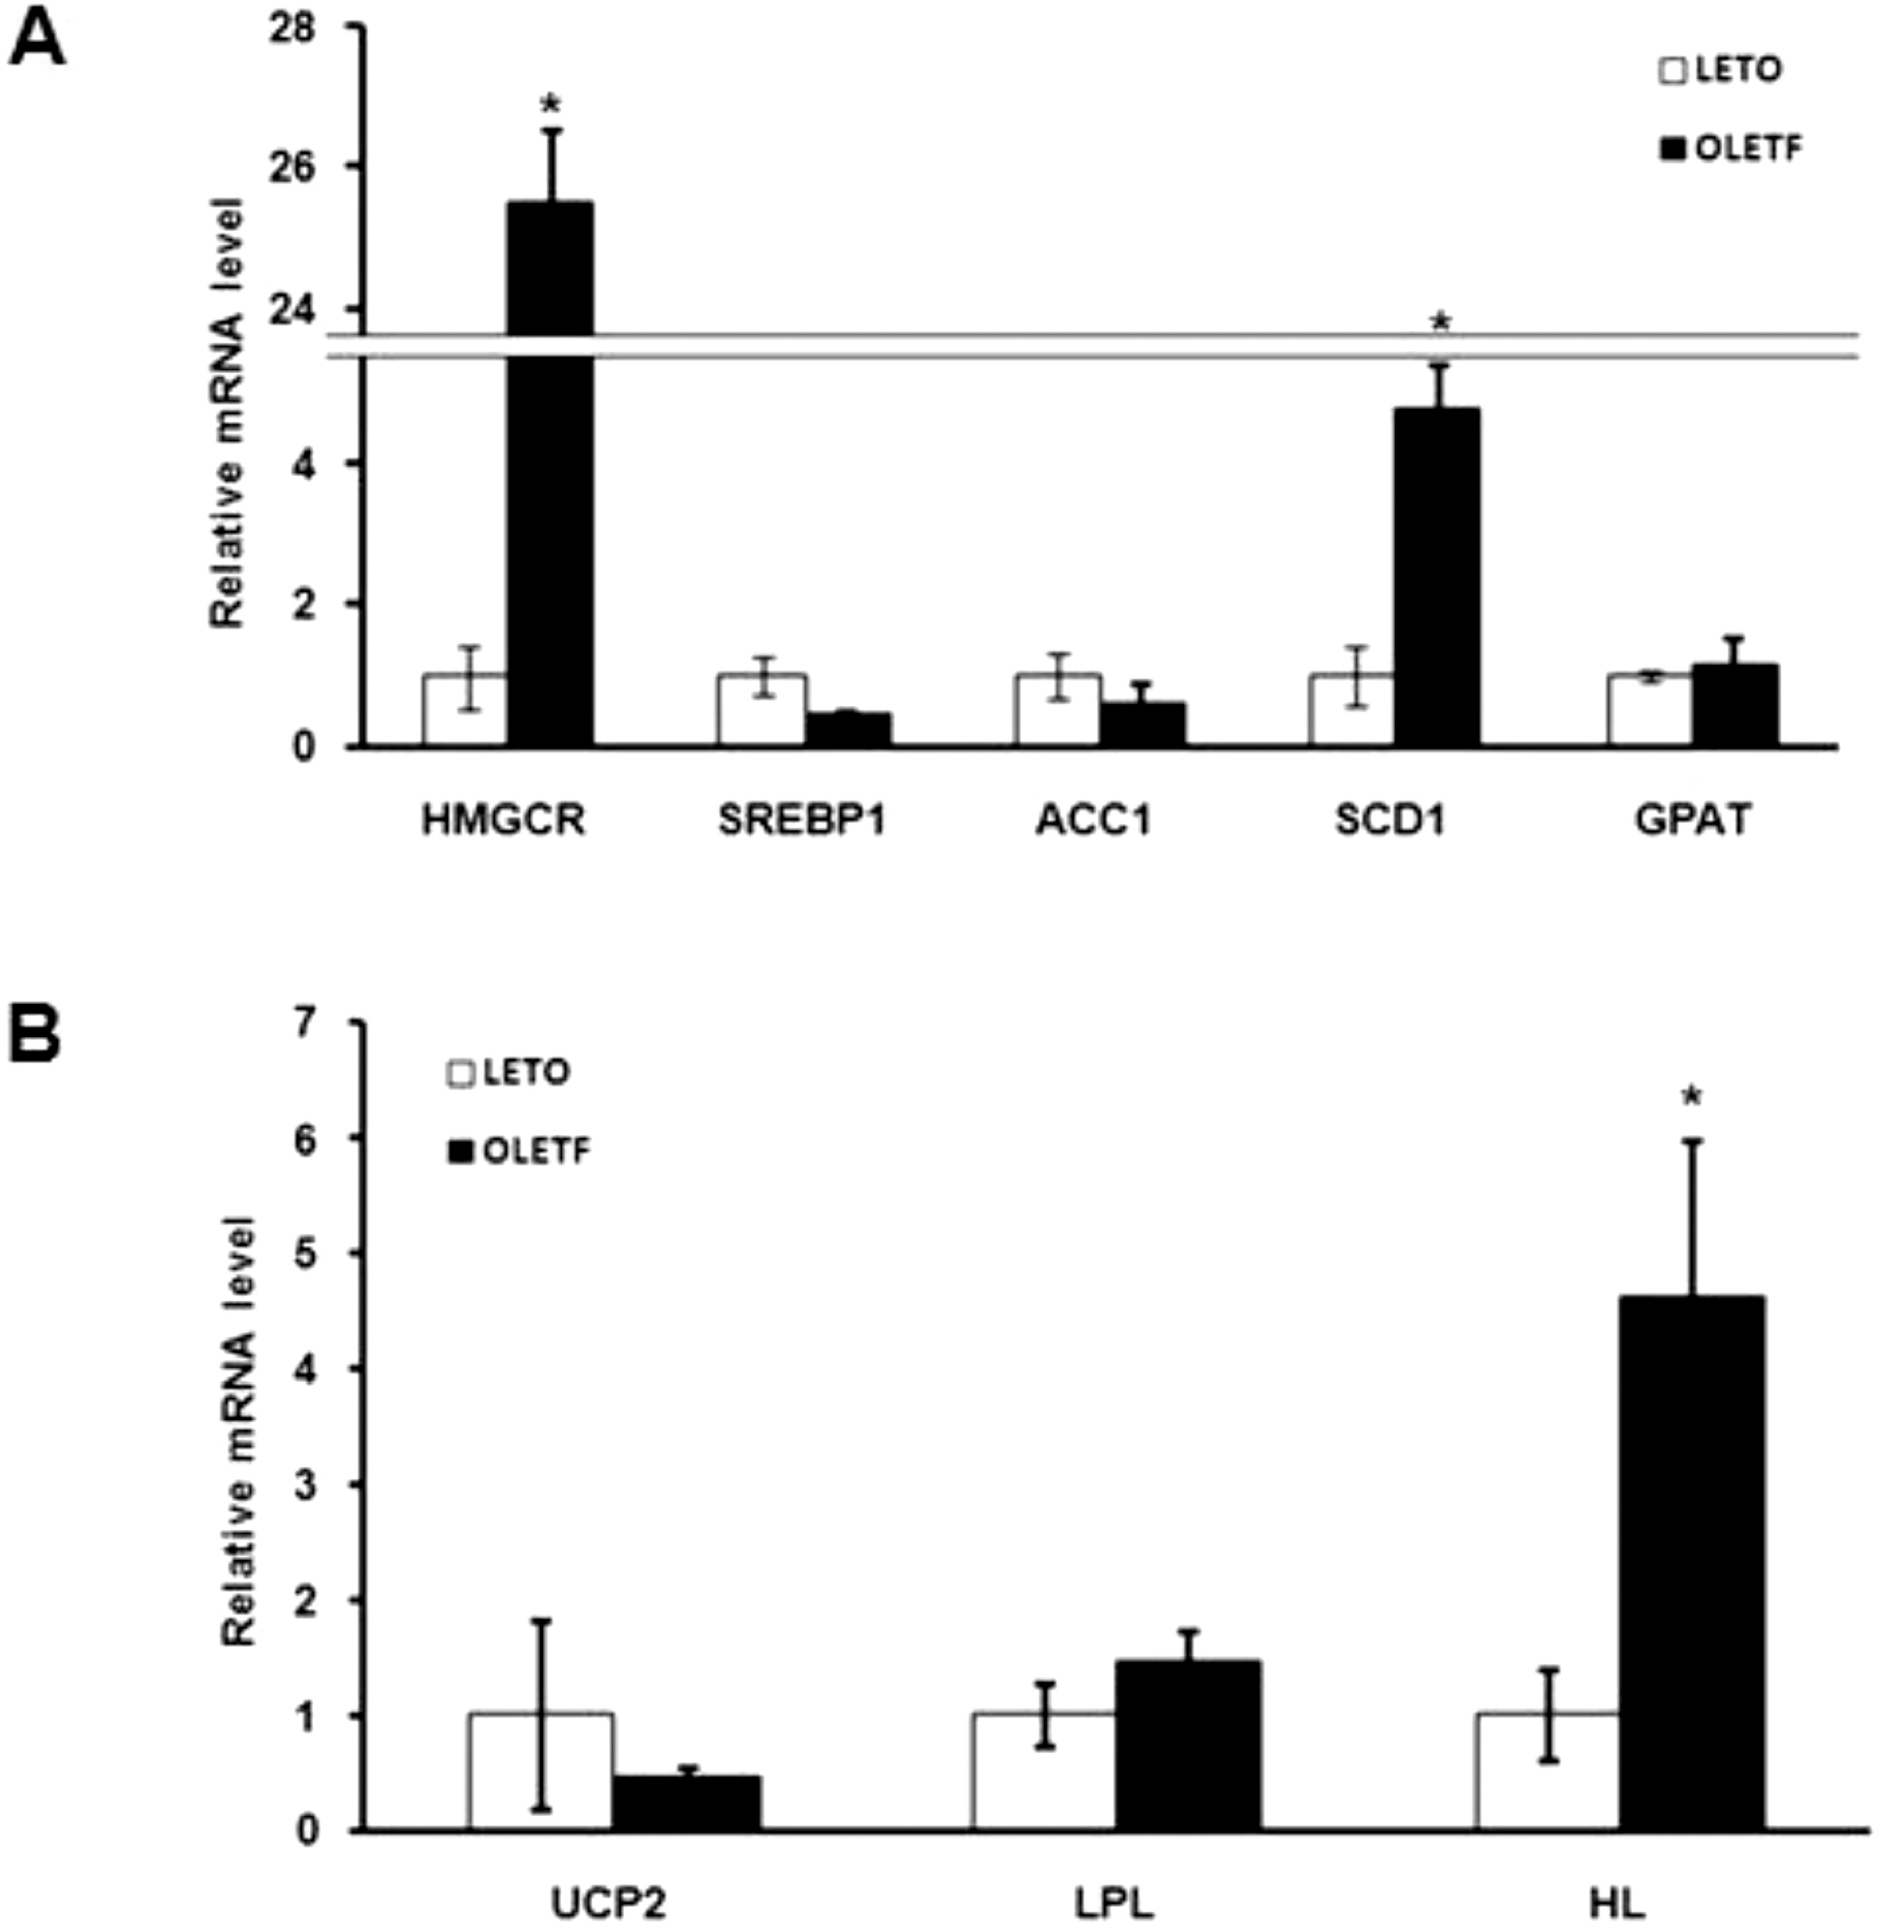
The Otsuka Long-Evans Tokushima Fatty (OLETF) rat, a model of spontaneous type 2 diabetes (T2D), develops hyperglycemic obesity with hyperinsulinemia and insulin resistance after the age of 25 weeks, similar to patients with noninsulin-dependent diabetes mellitus (DM). In the present study, we determined whether there are differences in the pattern of gene expression related to glucose and lipid metabolism between OLETF rats and their control counterparts, Long-Evans Tokushima (LETO) rats. The experiment was done using 35-week-old OLETF and LETO rats. At week 35 male OLETF rats showed overt T2D and increases in blood glucose, plasma insulin, plasma triglycerides (TG) and plasma total cholesterol (TC). Livers of diabetic OLETF and LETO rats also showed differences in expression of mRNA for glucose and lipid metabolism related genes. Among glucose metabolism related genes, GAPDH mRNA was significantly higher and FBPase and G6Pase mRNA were significantly lower in OLETF rats. For lipid metabolism related genes, HMGCR, SCD1 and HL mRNA were substantially higher in OLETF rats. These results indicate that gluconeogenesis in OLETF rats is lower and glycolysis is higher, which means that glucose metabolism might be compensated for by a lowering of the blood glucose level. However, lipid synthesis is increased in OLETF rats so diabetes may be aggravated. These differences between OLETF and LETO rats suggest mechanisms that could be targeted during the development of therapeutic agents for diabetes.
Go to : 
References
1. Tierney LM, McPhee SJ, Papadakis MA. Diabetes mellitus. Forty-first ed. Lange Medical Books/McGraw-Hill; Current medical Diagnosis & Treatment. 2002. 1203–1215.
2. Alberti KG, Zimmet PZ. Definition, diagnosis and classification of diabetes mellitus and its complications. Part 1: diagnosis and classification of diabetes mellitus provisional report of a WHO consultation. Diabet Med. 1998; 15:539–553.

3. Pozzilli P, Di Mario U. Autoimmune diabetes not requiring insulin at diagnosis (latent autoimmune diabetes of the adult): definition, characterization, and potential prevention. Diabetes Care. 2001; 24:1460–1467.
4. Tuomi T. Type 1 and type 2 diabetes: what do they have in common? Diabetes. 2005; 54:S40–S45.
5. Pozzilli P, Buzzetti R. A new expression of diabetes: double diabetes. Trends Endocrinol Metab. 2007; 18:52–57.

7. Frances A, Patrick R. Type 2 diabetes mellitus: not quite exciting enough? Hum Mol Genet. 2005; 13:R21–R31.
8. Olefsky JM, Kolterman OG, Scarlett A. Insulin action and resistance in obesity and noninsulin-dependent type II diabetes mellitus. Am J Physiol Endocrinol Metab. 1982; 243:E14–E30.

9. Reaven GM. Banting lecture 1988. Role of insulin resistance in human disease. Diabetes. 1988; 37:1595–1607.

10. Kawano K, Hirashima S, Mori S, Natori T. OLETF (Otsuka Long-Evans Tokushima Fatty) rat: a new NIDDM rat strain. Diabetes Res Clin Pract. 1994; 24:S317–S320.

11. Jin ES, Burgess SC, Merritt ME, Sherry AD, Malloy CR. Differing mechanisms of hepatic glucose overproduction in triiodothyronine-treated rats vs. Zucker diabetic fatty rats by NMR analysis of plasma glucose. Am J Physiol Endocrinol Metab. 2005; 288:E654–E662.

12. 12. Kawano K, Hirashima T, Mori S, Kurosumi M, Saitoh Y, Natori T. Spontaneous long-term hyperglycemic rat with diabetic complications: Otsuka Long-Evans Tokushima fatty (OLETF) strain. Diabetes. 1992; 41:1422–1428.
13. Gerich JE. Is insulin resistance the principal cause of type 2 diabetes? Diabetes Obes Metab. 1999; 1:257–263.

14. Centers for Disease Control and Prevention. Prevalence of overweight and obesity among adults with diagnosed diabetes? United States, 1988–1994 and 1999–2002. Morb Mortal Wkly Rep. 2004; 53:1066–1068.
15. Ntambi JM, Miyazaki M. Recent insights into stearoyl-CoA desaturase-1. Cur Opin Lipidol. 2003; 14:255–261.

16. Ntambi JM, Miyazaki M. Regulation of stearoyl-CoA desaturases and role in metabolism. Prog Lipid Res. 2004; 43:99–104.

17. Silvia SF, Herminia G, Lita F, Elke W, Zengxuan N. Hepatic Lipase, Lipoprotein Metabolism, and Atherogenesis. Arterioscler Thromb Vasc Biol. 2004; 24:1750–1754.
Go to : 
 | Fig. 1.Analysis of expression of glucose metabolism related genes in OLETF and LETO rats by quantitative real-time PCR. Values represent means±SEM of LETO rats (n=10), and OLETF rats (n=10). ∗p<0.05 vs. LETO rats. |
 | Fig. 2.Analysis of lipid distribution. (A) Plasma TG and TC levels of OLETF and LETO rats. Plasma TG and TC levels were significantly higher in OLETF than LETO rats. (B) Hepatic TG and TC levels of OLETF and LETO rats. There were no significant differences in hepatic TG and TC levels between OLETF and LETO rats. (C) Hepatic histology of LETO and OLETF rats (H&E stain, ×40). Values represent means±SEM of LETO rats (n=10), and OLETF rats (n=10). ∗p<0.05 vs. LETO rats. |
 | Fig. 3.Analysis of the expression of lipid metabolism related genes by quantitative real-time PCR. (A) mRNA levels of lipid synthesis related genes in OLETF and LETO rats. Expression of HMGCR and SCD1 genes were significantly higher in OLETF than in LETO rats. (B) mRNA levels of fatty acid oxidation and lipid transport related genes in OLETF and LETO rats. The expression of HL was significantly higher in OLETF than LETO rats. Values represent means±SEM of LETO rats (n=10), and OLETF rats (n=10). ∗p<0.05 vs. LETO rats. |
Table 1.
Primers used for quantitative real-time PCR


 PDF
PDF ePub
ePub Citation
 Print
Print


 XML Download