Abstract
Plasma cholesterol is increased in normal aging in both rodents and humans. This is associated with reduced elimination of cholesterol and decreased receptor-mediated clearance of plasma low-density lipoprotein (LDL) cholesterol. The aims of this study were: (1) to determine age-related changes in plasma lipid profiles, and (2) to determine the effect of fenofibrate, an activator of peroxisome proliferator activated receptor alpha (PPAR α), on plasma lipid profiles in normal rats on a standard diet. Male Sprague-Dawley (SD) rats (n=15) were fed standard chow and water from 10 to 25 weeks of age. During that period, we measured daily food intake, body weight, fasting and random blood glucose levels, plasma total cholesterol (TC), triglycerides (TG), and free fatty acid (FFA) levels. At 20 weeks of age, all rats were randomly divided into two groups: a fenofibrate group (in which rats were gavaged with 300 mg/kg/day of fenofibrate) and a control group (gavaged with water). Fenofibrate treatment lasted 5 weeks. There were no significant changes in daily food intake, blood glucose, and plasma TG level with age. Body weight, plasma TC, and FFA levels were significantly increased with age. Fenofibrate significantly decreased plasma concentrations of TC and FFA, which had been increased with age. However, fenofibrate did not influence the plasma concentration of TG, which had not increased with age. These results suggest that fenofibrate might have a novel role in preventing age-related hypercholesterolemia in SD rats on a normal diet.
Go to : 
References
1. Ericsson S, Eriksson M, Vitols S, Einarsson K, Berglund L, Angelin B. Influence of age on the metabolism of plasma low density lipoproteins in healthy males. J Clin Invest. 1991; 87:591–596.

2. Ericsson S, Berglund L, Frostegard J, Einarsson K, Angelin B. The influence of age on low density lipoprotein metabolism: effects of cholestyramine treatment in young and old healthy male subjects. J Intern Med. 1997; 242:329–337.

3. Levine GN, Keaney JF Jr, Vita JA. Cholesterol reduction in cardiovascular disease: Clinical benefits and possible mechanisms. N Engl J Med. 1995; 332:512–521.
4. Bays HR, Dujovne CA, Lansing AM. Drug treatment of dyslipidemias: Practical guidelines for the primary care physician. Heart Dis Stroke. 1992; 1:357–365.
5. Grundy SM, Cleeman JI, Rifkind BM, Kuller LH. Cholesterol lowering in the elderly population. Coordinating Committee of the National Cholesterol Education Program. Arch Intern Med. 1999; 159:1670–1678.
6. Trapani L, Violo F, Pallottini V. Hypercholesterolemia and 3-hydroxy-3-methylglutaryl coenzyme A reductase regulation in aged female rats. Exp Gerontol. 2010; 45:119–128.

7. Willson TM, Wahli W. Peroxisome proliferator-activated receptor agonists. Curr Opin Chem Biol. 1997; 1:235–241.

8. Issemann I, Green S. Activation of a member of the steroid hormone receptor superfamily by peroxisome proliferators. Nature. 1990; 347:645–650.

9. Bays H, Mandarino L, DeFronzo RA. Role of the adipocyte, free fatty acids, and ectopic fat in pathogenesis of type 2 diabetes mellitus: peroxisomal proliferator-activated receptor agonists provide a rational therapeutic approach. J Clin Endocrinol Metab. 2004; 89:463–478.

10. Najib J. Fenofibrate in the treatment of dyslipidemia: a review of the data as they relate to the new suprabioavailable tablet formulation. Clin Ther. 2002; 24:2022–2205.

11. Francis GA, Annicotte JS, Auwerx J. PPAR-alpha effects on the heart and other vascular tissues. Am J Physiol Heart Circ Physiol. 2003; 285:1–9.
12. Chaput E, Saladin R, Silvestre M, Edgar AD. Fenofibrate and rosiglitazone lower serum triglycerides with opposing effects on body weight. Biochem Biophys Res Commun. 2000; 271:445–450.

13. Mancini FP, Lanni A, Sabatino L, Moreno M, Giannino A, Contaldo F, Colantuoni V, Goglia F. Fenofibrate prevents and reduces body weight gain and adiposity in diet-induced obese rats. FEBS Lett. 2001; 491:154–158.

14. Lee HJ, Choi SS, Park MK, An YJ, Seo SY, Kim MC, Hong SH, Hwang TH, Kang DY, Garber AJ, Kim DK. Fenofibrate lowers abdominal and skeletal adiposity and improves insulin sensitivity in OLETF rats. Biochem Biophys Res Commun. 2002; 296:293–299.

15. Han Y, Joe Y, Seo E, Lee SR, Park MK, Lee HJ, Kim DK. The hyperleptinemia and ObRb expression in hyperphagic obese rats. Biochem Biophys Res Commun. 2010; 394:70–74.

16. Kłosiewicz-Latoszek L, Szostak WB, Grzybowska B, Białobrzeska-Paluszkiewicz J, Wiśniewska B, Stolarska I. Comparison of combined statin-fibrate treatment to monotherapy in patients with mixed hyperlipidemia. Kardiol Pol. 2004; 60:567–577.
17. Krempf M, Rohmer V, Farnier M, Issa-Sayegh M, Corda C, Sirugue I, Gerlinger C, Masseyeff-Elbaz MF. Efficacy and safety of micronised fenofibrate in a randomised double-blind study comparing four doses from 200 mg to 400 mg daily with placebo in patients with hypercholesterolemia. Diabetes Metab. 2000; 26:184–191.
18. Pallottini V, Martini C, Cavallini G, Donati A, Bergamini E, Notarnicola M, Caruso MG, Trentalance A. Modified HMG-CoA reductase and LDLr regulation is deeply involved in age-related hypercholesterolemia. J Cell Biochem. 2006; 98:1044–1053.

Go to : 
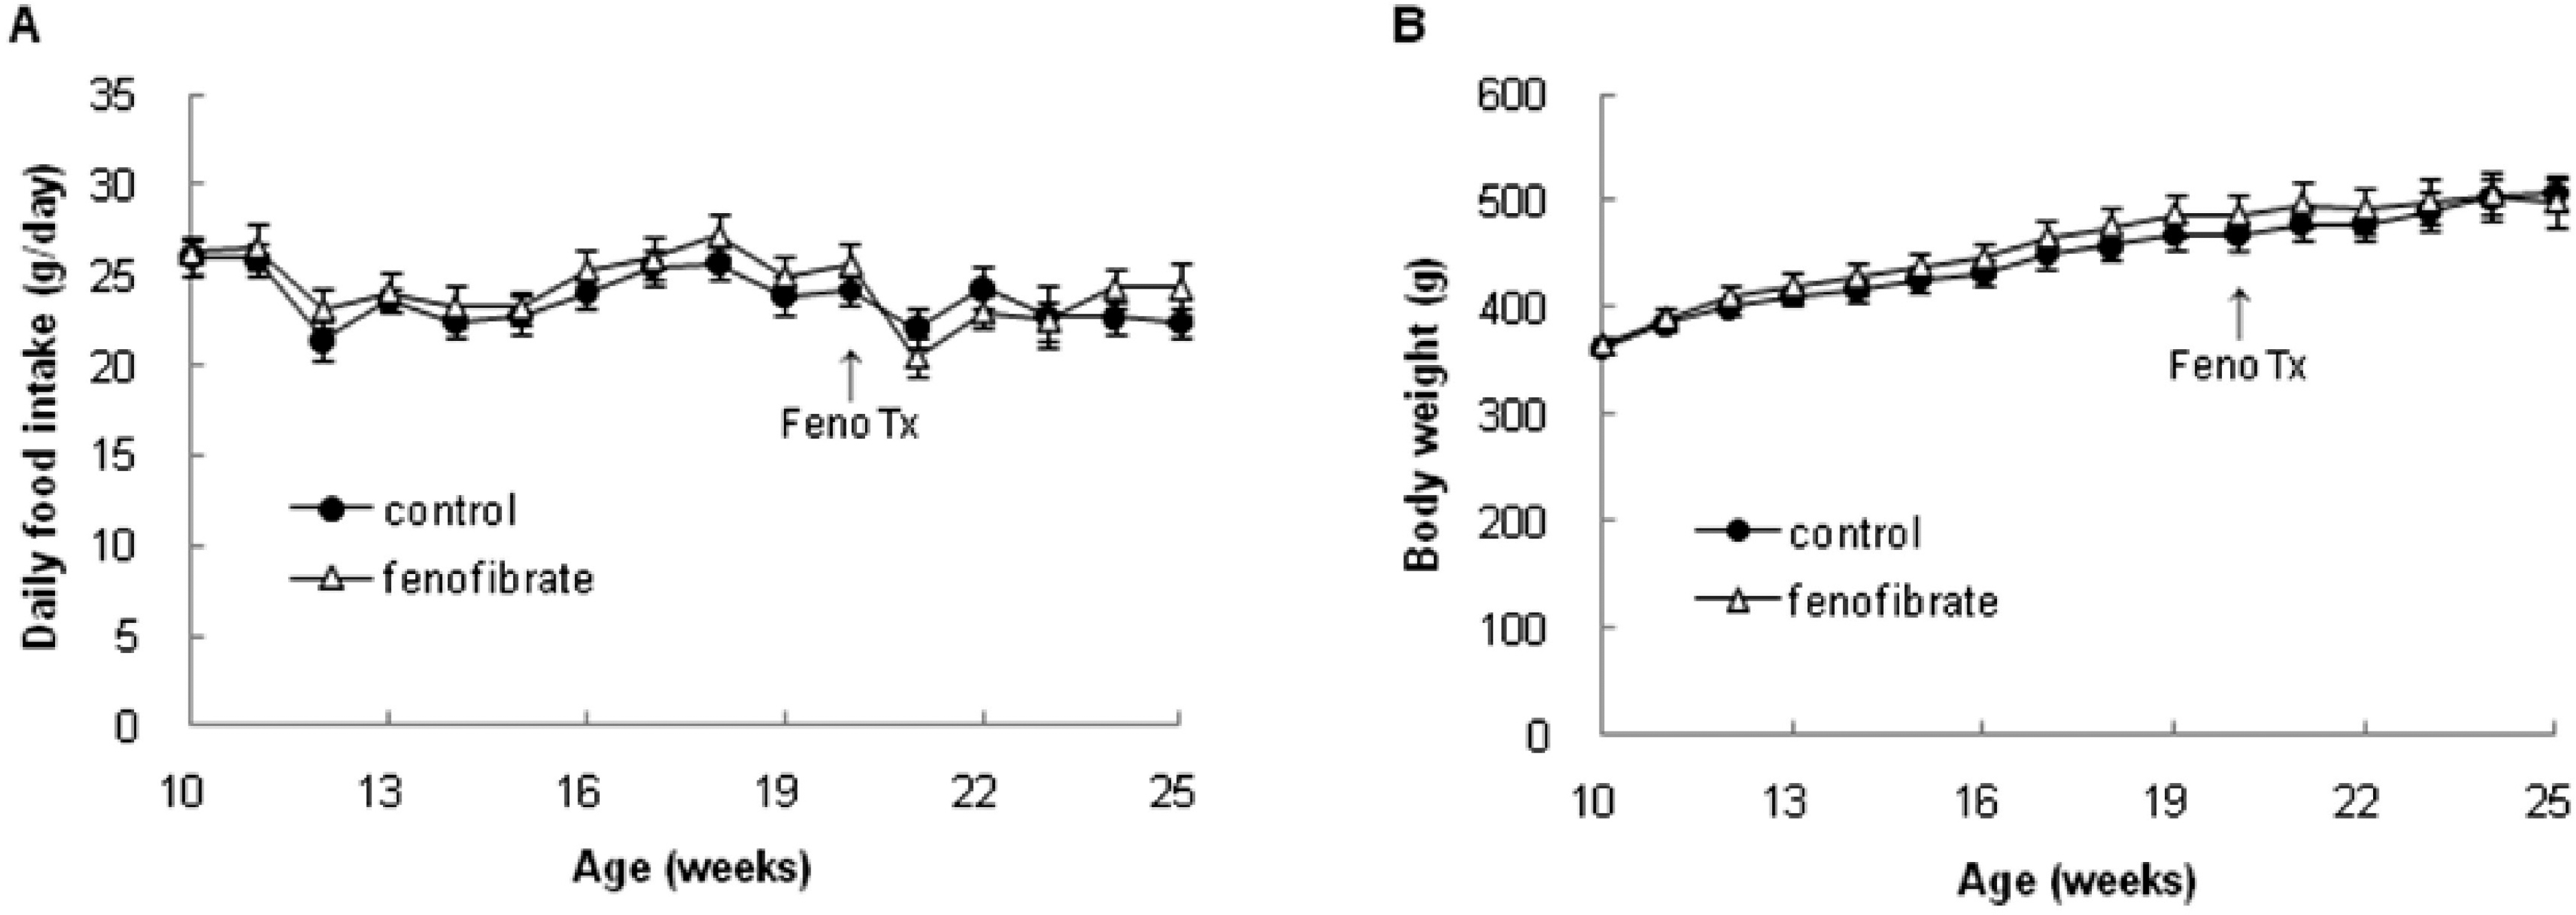
 | Fig. 1.(A) Effect of fenofibrate on daily food intake. There was no significant change in daily food intake from 10 to 25 weeks of age. There was no significant difference in daily food intake between the fenofibrate and control groups at 25 weeks of age. (B) Effect of fenofibrate on body weight. Body weight of SD rats increased with age. There was no significant difference in body weight between fenofibrate and control groups at 25 weeks of age. Values represent means±SEM of the control group (n=7) and the fenofibrate group (n=8). Feno, fenofibrate; Tx, treatment. |
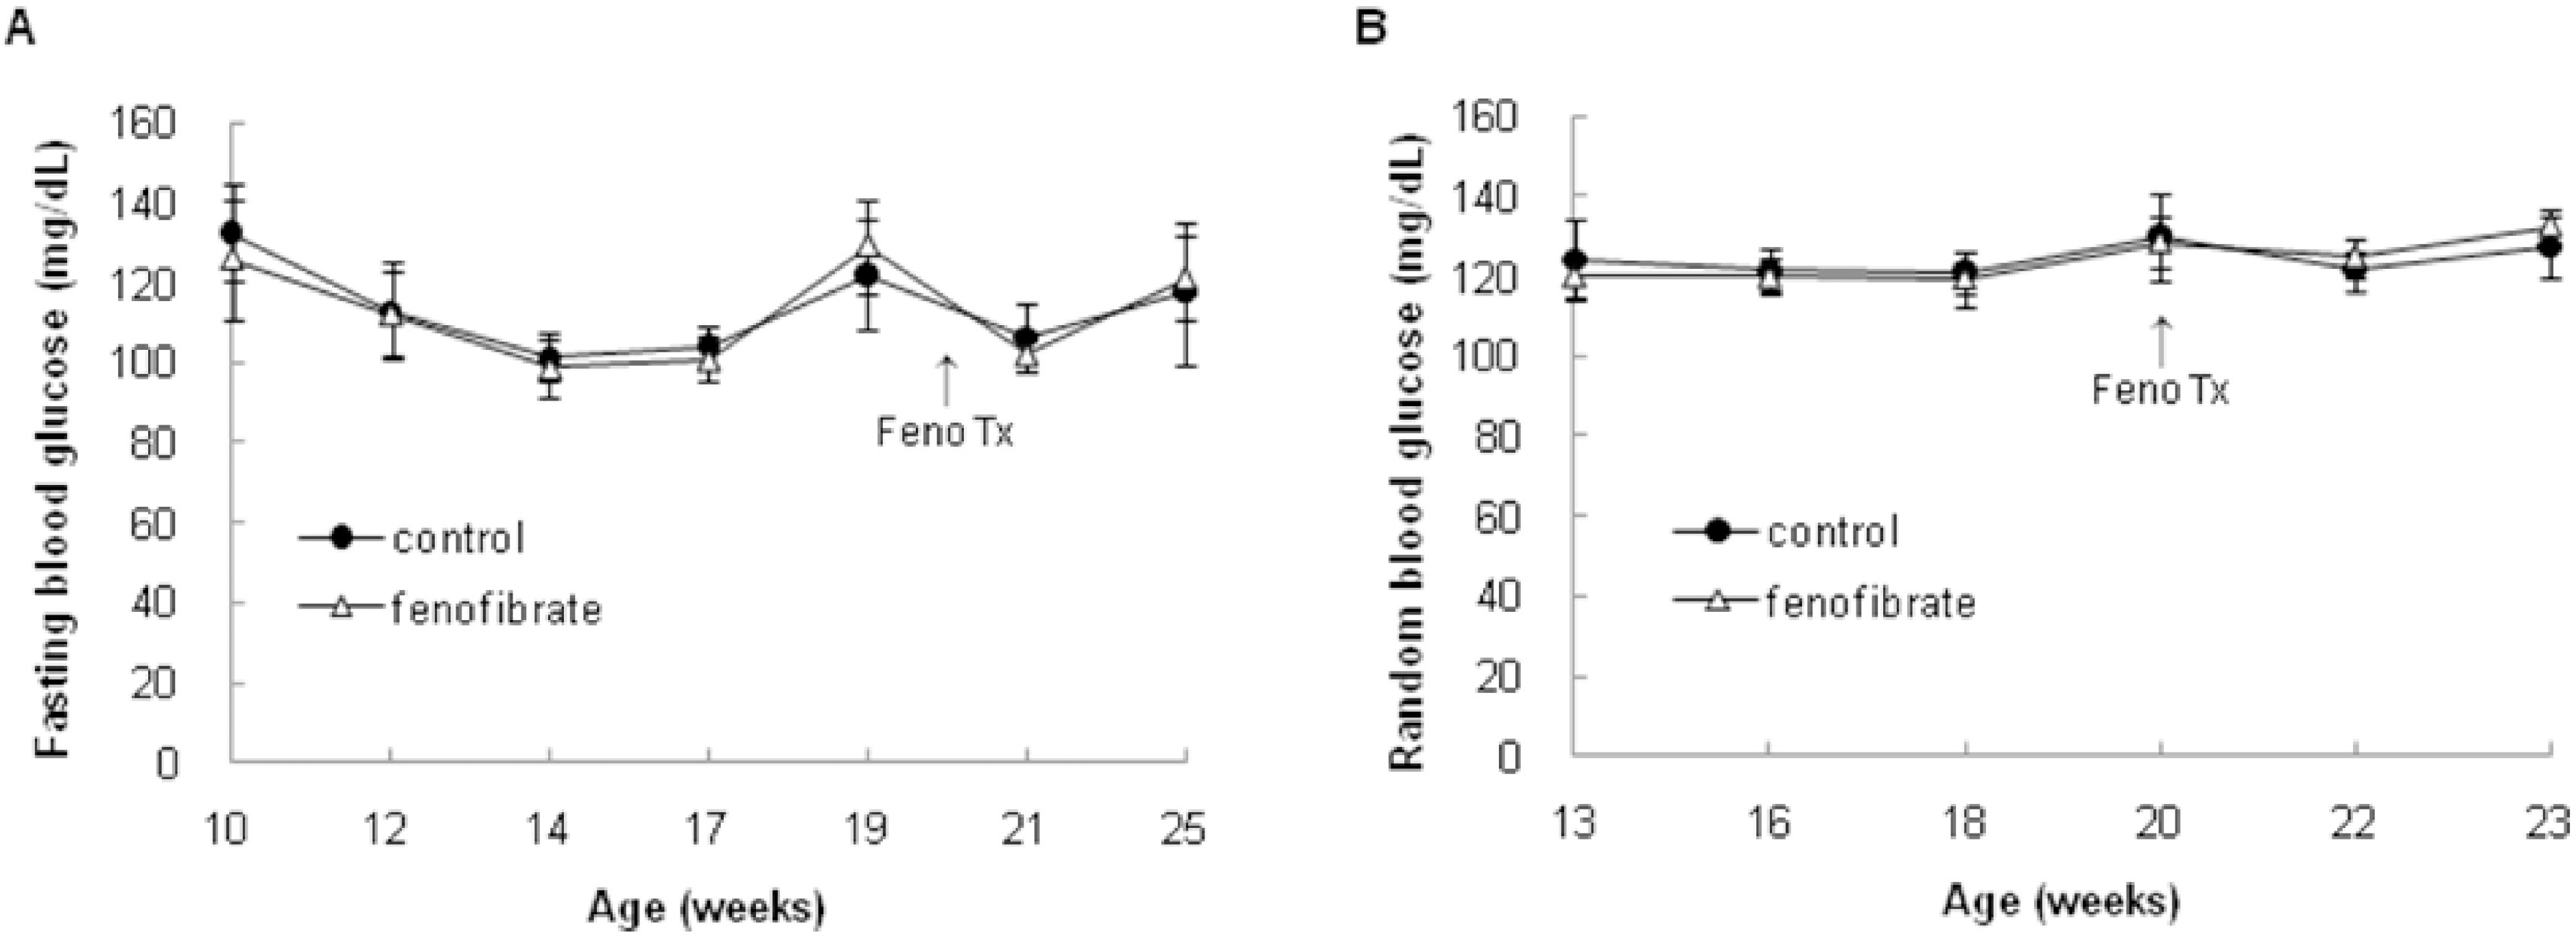
 | Fig. 2.Analysis of blood glucose levels. (A) Effect of fenofibrate on fasting blood glucose. There was no significant change in fasting blood glucose from 10 to 25 weeks of age. There was no significant difference in fasting blood glucose between the fenofibrate and control groups at 25 weeks of age. (B) Effect of fenofibrate on random blood glucose levels. There was no significant change in random blood glucose from 10 to 25 weeks of age. There was no significant difference in random blood glucose between the fenofibrate and control groups at 25 weeks of age. Values represent means±SEM of the control group (n=7) and the fenofibrate group (n=8). Feno, fenofibrate; Tx, treatment. |
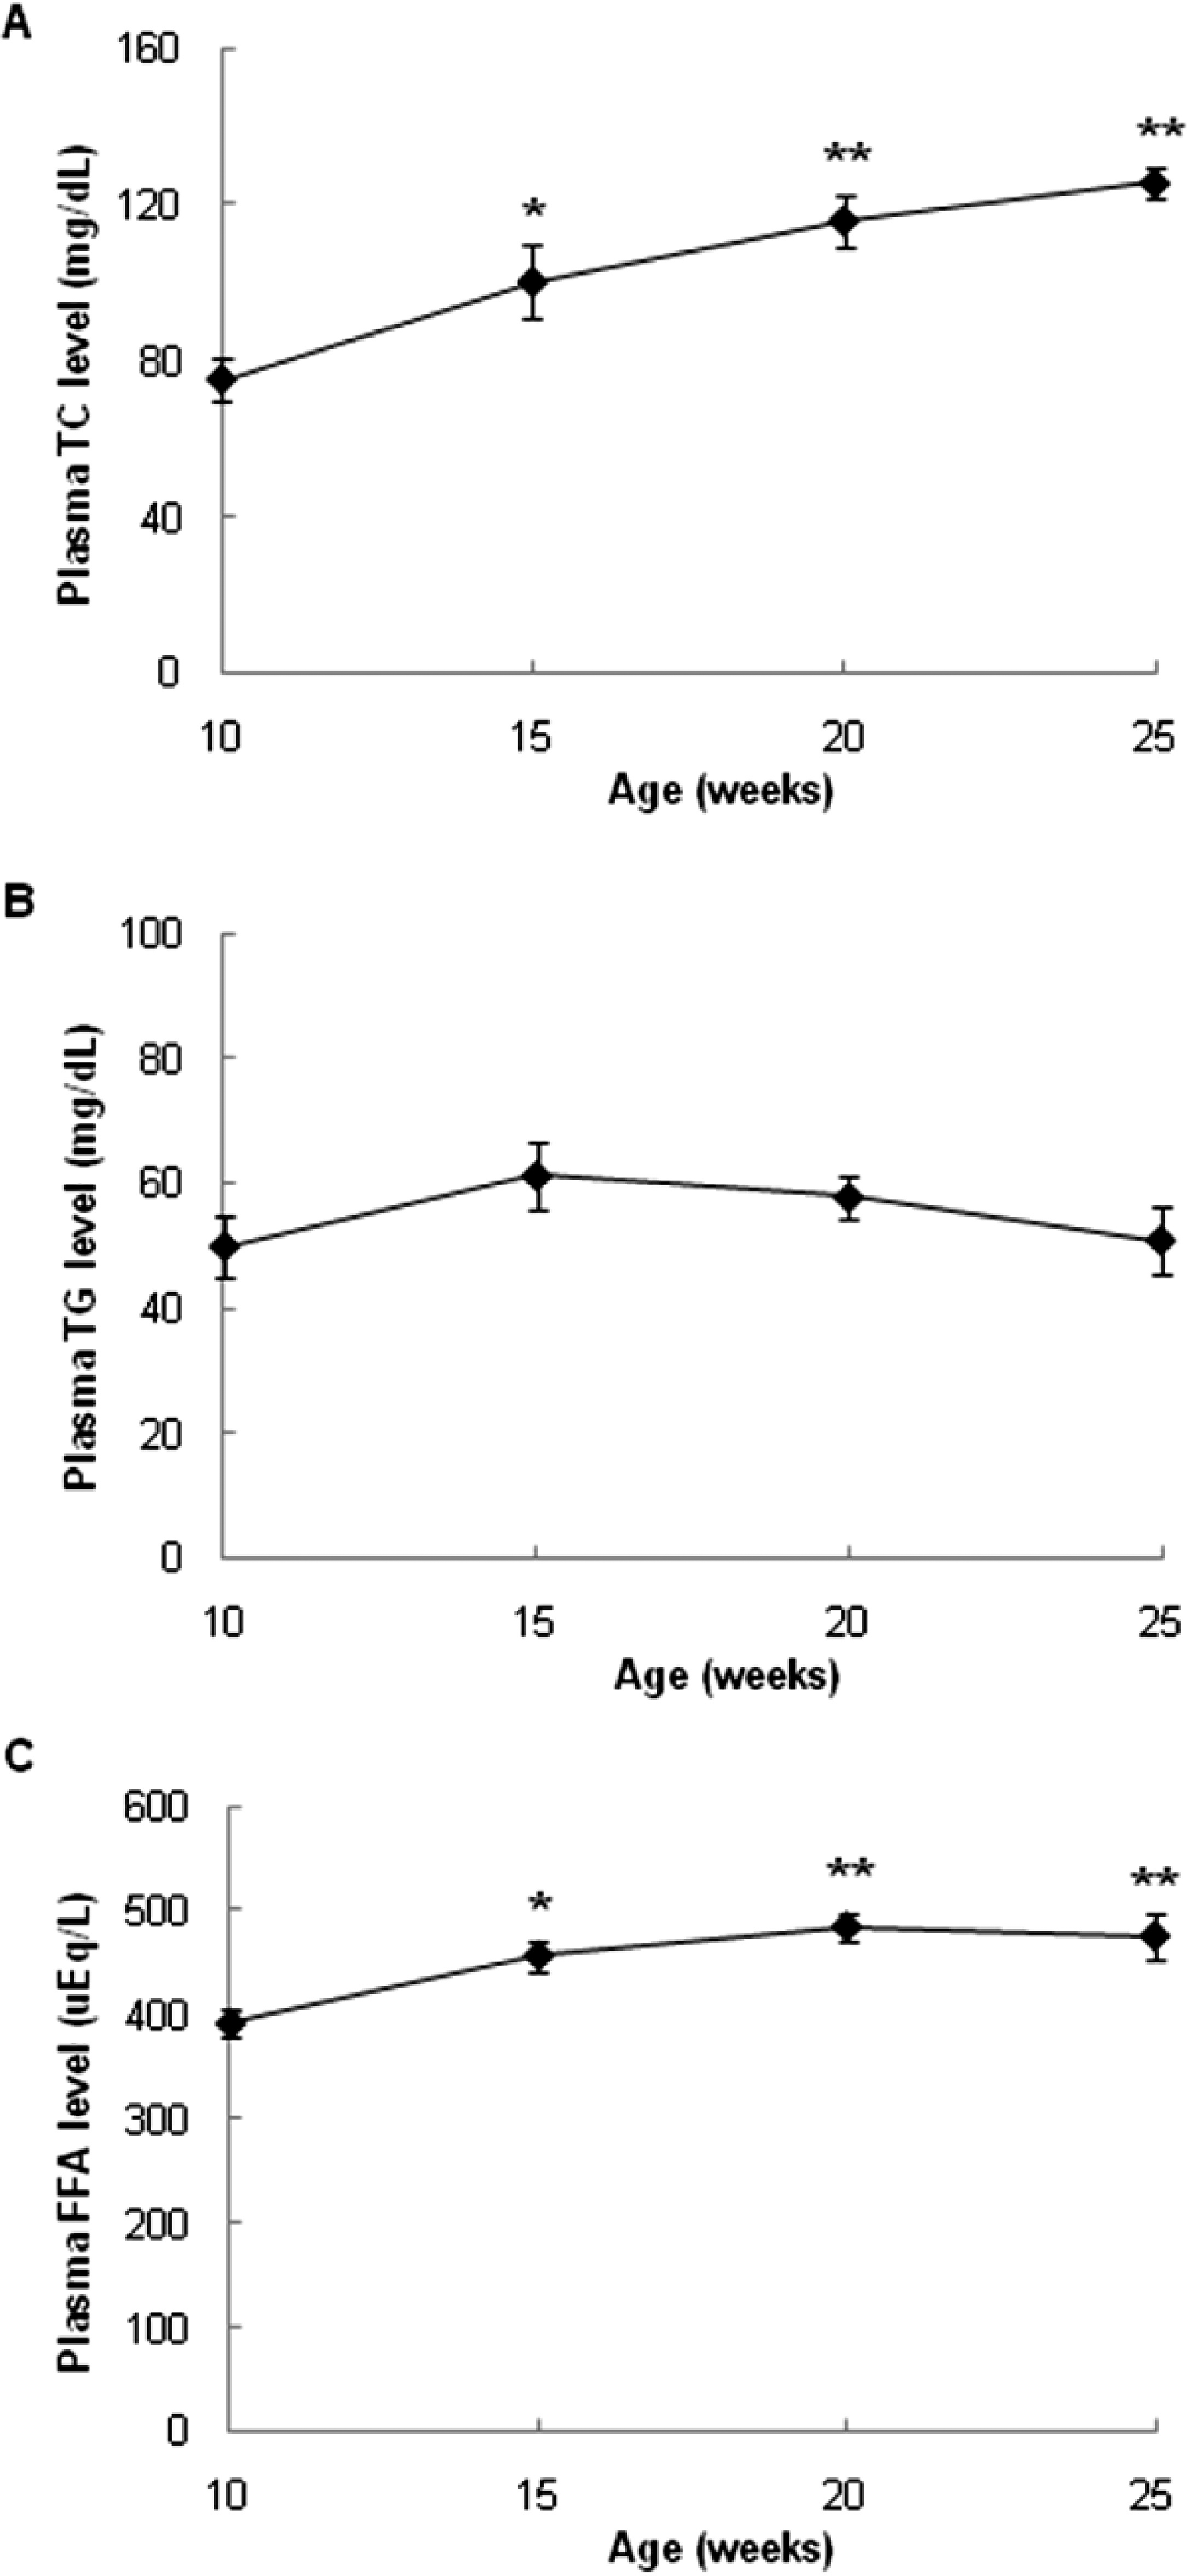
 | Fig. 3.Changes in plasma TC, TG, and FFA levels with age. (A) Plasma TC level was significantly increased from 10 to 25 weeks of age. (B) The plasma TG level was not changed from 10 to 25 weeks of age. (C) Plasma FFA levels were significantly increased from 10 to 25 weeks of age. Values represent means±SEM of the SD rats (n=15). ∗p<0.05 vs. 10 weeks of age; ∗∗p<0.01 vs. 10 weeks of age. |
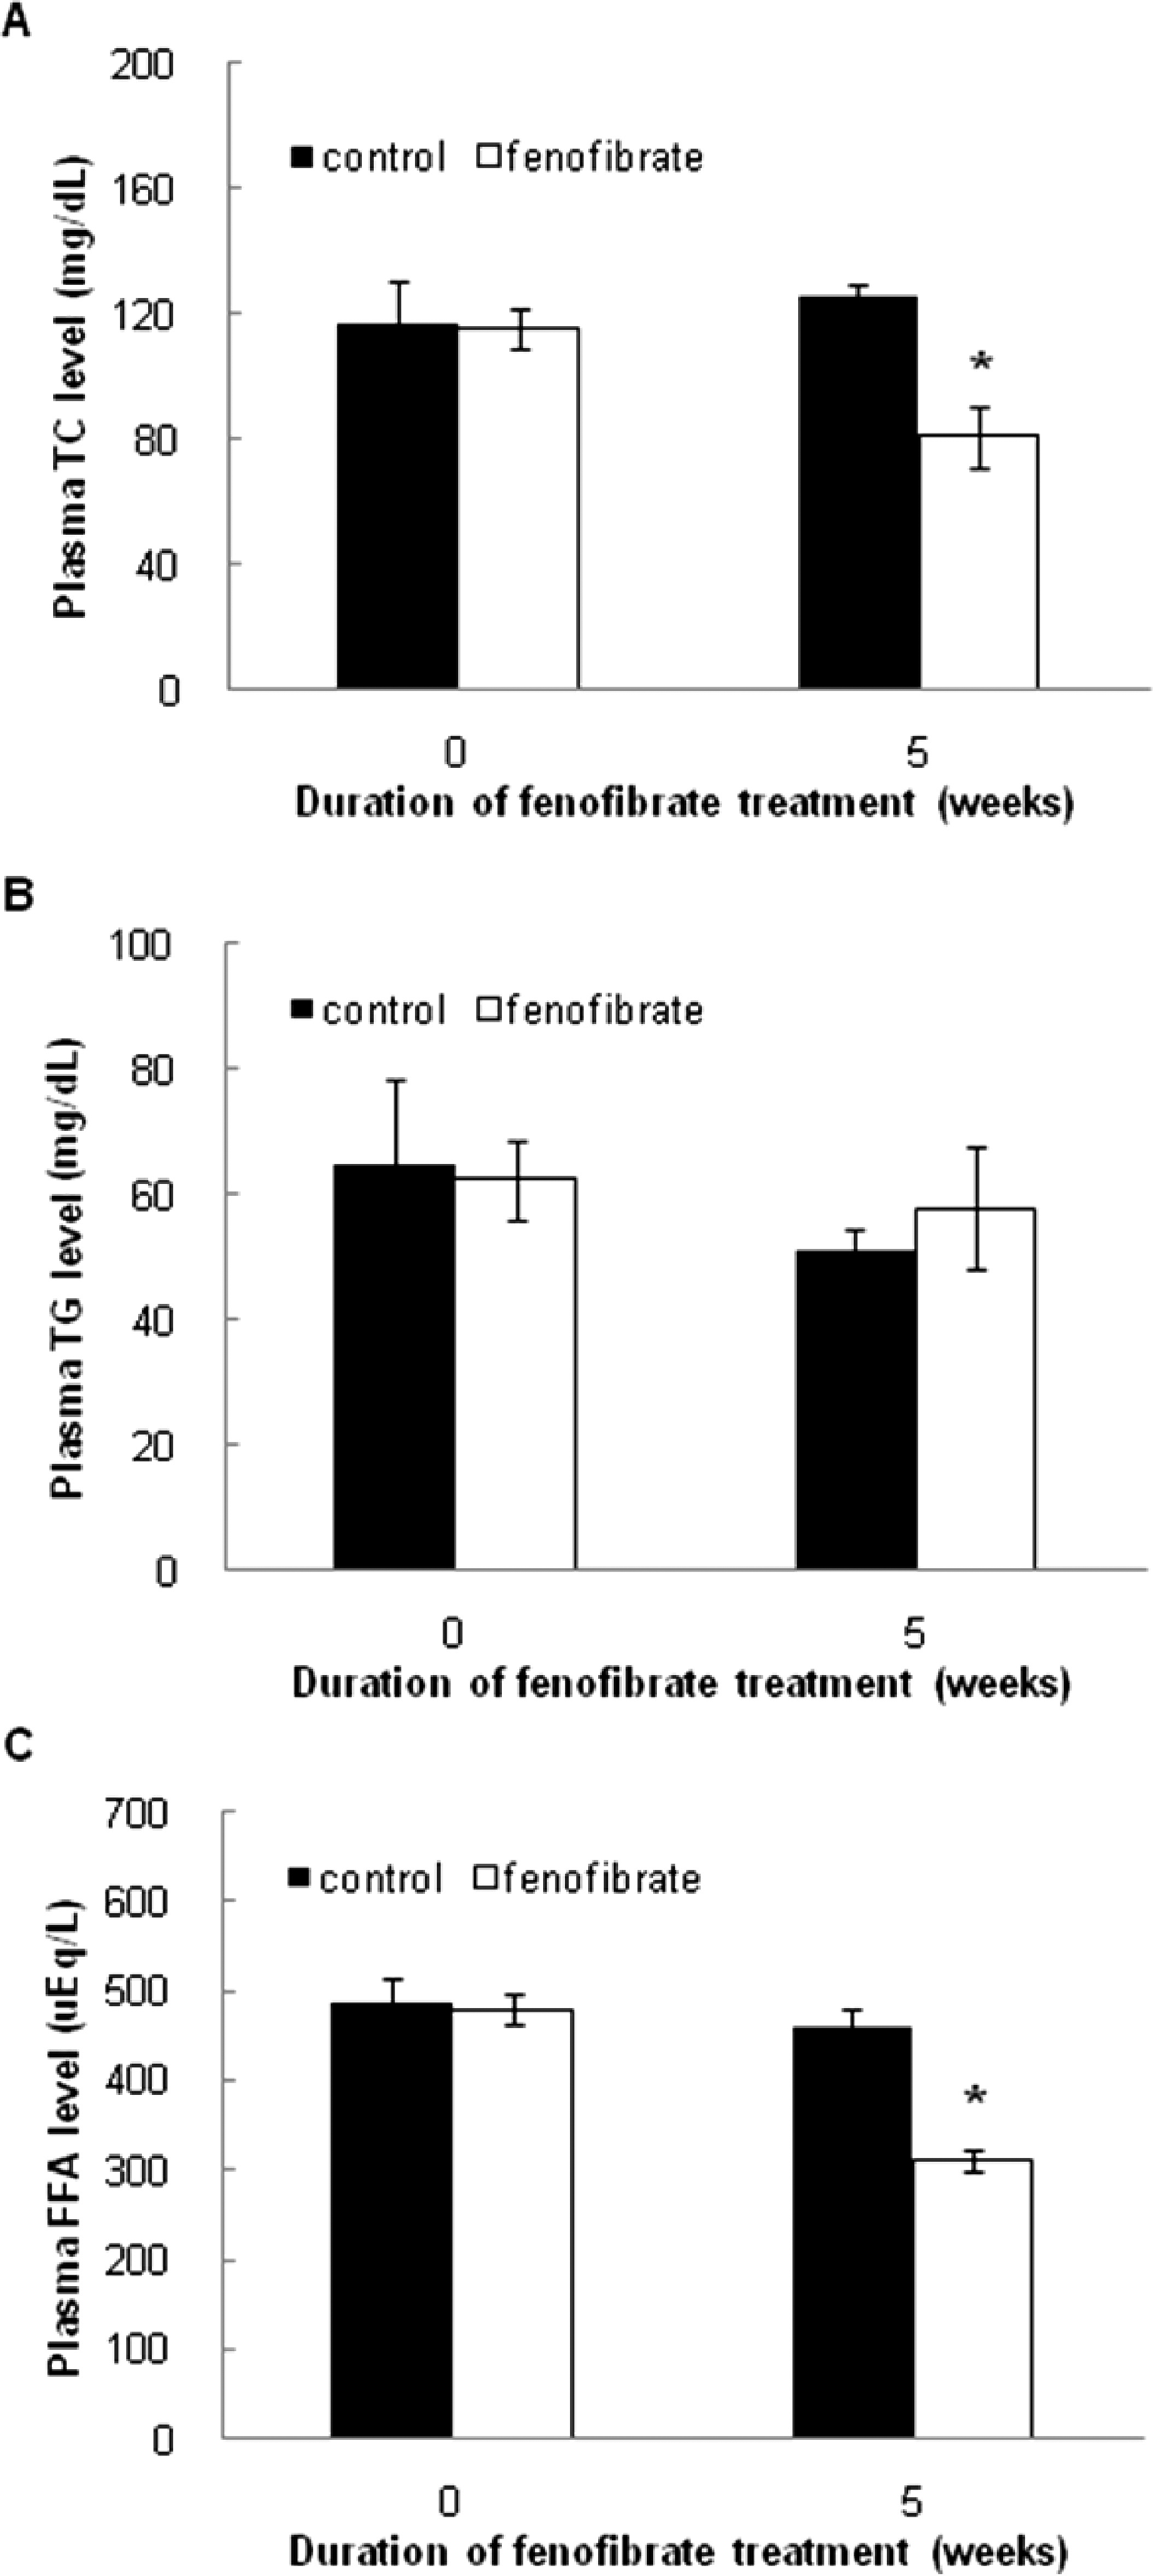
 | Fig. 4.Effects of fenofibrate on plasma TC, TG, and FFA levels. There was no difference in plasma TC, TG, and FFA levels between the fenofibate and control groups before fenofibrate treatment. (A) After 5 weeks of fenofibrate treatment, the plasma TC level of the fenofibrate group was significantly lower than that of the control group. (B) After 5 weeks of fenofibrate treatment, there was no significant difference in plasma TG level between the fenofibrate and control groups. (C) After 5 weeks of fenofibrate treatment, the plasma FFA level of the fenofibrate group was significantly lower than that of the control group. Values represent means±SEM of the control (n=7) and fenofibrate (n=8) groups. ∗p<0.05 vs. control group. |


 PDF
PDF ePub
ePub Citation
 Print
Print


 XML Download