Abstract
Gamma-aminobutyric acid (GABA)-ergic inhibition is important in the function of the visual cortex. In a previous study, we reported a developmental increase in GABAA receptor-mediated inhibition in the rat visual cortex from 3 to 5 weeks of age. Because this developmental increase is crucial to the regulation of the induction of long-term synaptic plasticity, in the present study we investigated in detail the postnatal development of phasic and tonic inhibition. The amplitude of phasic inhibition evoked by electrical stimulation increased during development from 3 to 8 weeks of age, and the peak time and decay kinetics of inhibitory postsynaptic potential (IPSP) and current (IPSC) slowed progressively. Since the membrane time constant decreased during this period, passive membrane properties might not be involved in the kinetic changes of IPSP and IPSC. Tonic inhibition, another mode of GABAA receptor-mediated inhibition, also increased developmentally and reached a plateau at 5 weeks of age. These results indicate that the time course of the postnatal development of GABAergic inhibition matched well that of the functional maturation of the visual cortex. Thus, the present study provides significant insight into the roles of inhibitory development in the functional maturation of the visual cortical circuits.
Go to : 
References
1. Pouille F, Scanziani M. Enforcement of temporal fidelity in pyramidal cells by somatic feed-forward inhibition. Science. 2001; 293:1159–1163.

2. Whittington MA, Traub RD. Interneuron diversity series: inhibitory interneurons and network oscillations in vitro. Trends Neurosci. 2003; 26:676–682.

3. Cobb SR, Buhl EH, Halasy K, Paulsen O, Somogyi P. Synchronization of neuronal activity in hippocampus by individual GABAergic interneurons. Nature. 1995; 378:75–78.

4. Hensch TK, Stryker MP. Columnar architecture sculpted by GABA circuits in developing cat visual cortex. Science. 2004; 303:1678–1681.

5. Gray CM. The temporal correlation hypothesis of visual feature integration: still alive and well. Neuron. 1999; 24:31–47.
6. Jang HJ, Cho KH, Kim HS, Hahn SJ, Kim MS, Rhie DJ. Age-dependent decline in supragranular long-term synaptic plasticity by increased inhibition during the critical period in the rat primary visual cortex. J Neurophysiol. 2009; 101:269–275.

7. Hensch TK, Fagiolini M, Mataga N, Stryker MP, Baekkeskov S, Kash SF. Local GABA circuit control of experience-dependent plasticity in developing visual cortex. Science. 1998; 282:1504–1508.

8. Komatsu Y. Development of cortical inhibition in kitten striate cortex investigated by a slice preparation. Brain Res Dev Brain Res. 1983; 8:136–139.

9. Morales B, Choi SY, Kirkwood A. Dark rearing alters the development of GABAergic transmission in visual cortex. J Neurosci. 2002; 22:8084–8090.

10. Fagiolini M, Hensch TK. Inhibitory threshold for critical-period activation in primary visual cortex. Nature. 2000; 404:183–186.

11. Jang HJ, Cho KH, Park SW, Kim MJ, Yoon SH, Rhie DJ. Effects of serotonin on the induction of long-term depression in the rat visual cortex. Korean J Physiol Pharmacol. 2010; 14:337–343.

12. Bosman LW, Rosahl TW, Brussaard AB. Neonatal development of the rat visual cortex: synaptic function of GABAA receptor alpha subunits. J Physiol. 2002; 545:169–181.
13. Kapur A, Lytton WW, Ketchum KL, Haberly LB. Regulation of the NMDA component of EPSPs by different components of postsynaptic GABAergic inhibition: computer simulation analysis in piriform cortex. J Neurophysiol. 1997; 78:2546–2559.

14. Perkel DJ, Petrozzino JJ, Nicoll RA, Connor JA. The role of Ca2+ entry via synaptically activated NMDA receptors in the induction of long-term potentiation. Neuron. 1993; 11:817–823.
15. Bear MF, Kleinschmidt A, Gu QA, Singer W. Disruption of experience-dependent synaptic modifications in striate cortex by infusion of an NMDA receptor antagonist. J Neurosci. 1990; 10:909–925.

16. Mulkey RM, Malenka RC. Mechanisms underlying induction of homosynaptic long-term depression in area CA1 of the hippocampus. Neuron. 1992; 9:967–975.

17. Kirkwood A, Lee HK, Bear MF. Co-regulation of long-term potentiation and experience-dependent synaptic plasticity in visual cortex by age and experience. Nature. 1995; 375:328–331.

18. Farrant M, Nusser Z. Variations on an inhibitory theme: phasic and tonic activation of GABAA receptors. Nat Rev Neurosci. 2005; 6:215–229.
19. Semyanov A, Walker MC, Kullmann DM. GABA uptake regulates cortical excitability via cell type-specific tonic inhibition. Nat Neurosci. 2003; 6:484–490.

20. Glykys J, Mody I. The main source of ambient GABA responsible for tonic inhibition in the mouse hippocampus. J Physiol. 2007; 582:1163–1178.

21. Birnir B, Everitt AB, Lim MS, Gage PW. Spontaneously opening GABAA channels in CA1 pyramidal neurones of rat hippocampus. J Membr Biol. 2000; 174:21–29.
22. McCartney MR, Deeb TZ, Henderson TN, Hales TG. Tonically active GABAA receptors in hippocampal pyramidal neurons exhibit constitutive GABA-independent gating. Mol Pharmacol. 2007; 71:539–548.
23. Semyanov A, Walker MC, Kullmann DM, Silver RA. Tonically active GABAA receptors: modulating gain and maintaining the tone. Trends Neurosci. 2004; 27:262–269.
24. Yamada J, Furukawa T, Ueno S, Yamamoto S, Fukuda A. Molecular basis for the GABAA receptor-mediated tonic inhibition in rat somatosensory cortex. Cereb Cortex. 2007; 17:1782–1787.
25. Spruston N, Jaffe DB, Johnston D. Dendritic attenuation of synaptic potentials and currents: the role of passive membrane properties. Trends Neurosci. 1994; 17:161–166.

26. Grashow R, Brookings T, Marder E. Compensation for variable intrinsic neuronal excitability by circuit-synaptic interactions. J Neurosci. 2010; 30:9145–9156.

27. Vicini S, Ferguson C, Prybylowski K, Kralic J, Morrow AL, Homanics GE. GABAA receptor alpha1 subunit deletion prevents developmental changes of inhibitory synaptic currents in cerebellar neurons. J Neurosci. 2001; 21:3009–3016.
28. Moreau AW, Amar M, Le Roux N, Morel N, Fossier P. Serotoninergic fine-tuning of the excitation-inhibition balance in rat visual cortical networks. Cereb Cortex. 2010; 20:456–467.
29. Fagiolini M, Pizzorusso T, Berardi N, Domenici L, Maffei L. Functional postnatal development of the rat primary visual cortex and the role of visual experience: dark rearing and monocular deprivation. Vision Res. 1994; 34:709–720.

30. Guire ES, Lickey ME, Gordon B. Critical period for the monocular deprivation effect in rats: assessment with sweep visually evoked potentials. J Neurophysiol. 1999; 81:121–128.

31. Alitto HJ, Dan Y. Function of inhibition in visual cortical processing. Curr Opin Neurobiol. 2010; 20:340–346.

32. Mohler H. GABAA receptor diversity and pharmacology. Cell Tissue Res. 2006; 326:505–516.
33. Tia S, Wang JF, Kotchabhakdi N, Vicini S. Developmental changes of inhibitory synaptic currents in cerebellar granule neurons: role of GABAA receptor alpha 6 subunit. J Neurosci. 1996; 16:3630–3640.
34. Xiang Z, Huguenard JR, Prince DA. Synaptic inhibition of pyramidal cells evoked by different interneuronal subtypes in layer v of rat visual cortex. J Neurophysiol. 2002; 88:740–750.

35. Karayannis T, Elfant D, Huerta-Ocampo I, Teki S, Scott RS, Rusakov DA, Jones MV, Capogna M. Slow GABA transient and receptor desensitization shape synaptic responses evoked by hippocampal neurogliaform cells. J Neurosci. 2010; 30:9898–9909.

36. Hefti BJ, Smith PH. Distribution and kinetic properties of GABAergic inputs to layer V pyramidal cells in rat auditory cortex. J Assoc Res Otolaryngol. 2003; 4:106–121.

37. Sceniak MP, Maciver MB. Slow GABAA mediated synaptic transmission in rat visual cortex. BMC Neurosci. 2008; 9:8.
38. Klostermann O, Wahle P. Patterns of spontaneous activity and morphology of interneuron types in organotypic cortex and thalamus-cortex cultures. Neuroscience. 1999; 92:1243–1259.

39. Chattopadhyaya B, Di Cristo G, Higashiyama H, Knott GW, Kuhlman SJ, Welker E, Huang ZJ. Experience and activity-dependent maturation of perisomatic GABAergic innervation in primary visual cortex during a postnatal critical period. J Neurosci. 2004; 24:9598–9611.

40. Okaty BW, Miller MN, Sugino K, Hempel CM, Nelson SB. Transcriptional and electrophysiological maturation of neocortical fast-spiking GABAergic interneurons. J Neurosci. 2009; 29:7040–7052.

41. Huang ZJ, Kirkwood A, Pizzorusso T, Porciatti V, Morales B, Bear MF, Maffei L, Tonegawa S. BDNF regulates the maturation of inhibition and the critical period of plasticity in mouse visual cortex. Cell. 1999; 98:739–755.

42. Jiang B, Huang S, de Pasquale R, Millman D, Song L, Lee HK, Tsumoto T, Kirkwood A. The maturation of GABAergic transmission in visual cortex requires endocannabinoid-mediated LTD of inhibitory inputs during a critical period. Neuron. 2010; 66:248–259.

43. Jiang B, Sohya K, Sarihi A, Yanagawa Y, Tsumoto T. Laminar-specific maturation of GABAergic transmission and susceptibility to visual deprivation are related to endocannabinoid sensitivity in mouse visual cortex. J Neurosci. 2010; 30:14261–14272.

44. Carmignoto G, Vicini S. Activity-dependent decrease in NMDA receptor responses during development of the visual cortex. Science. 1992; 258:1007–1011.

45. Nase G, Weishaupt J, Stern P, Singer W, Monyer H. Genetic and epigenetic regulation of NMDA receptor expression in the rat visual cortex. Eur J Neurosci. 1999; 11:4320–4326.

46. Flint AC, Maisch US, Weishaupt JH, Kriegstein AR, Monyer H. NR2A subunit expression shortens NMDA receptor synaptic currents in developing neocortex. J Neurosci. 1997; 17:2469–2476.

47. Mitchell SJ, Silver RA. Shunting inhibition modulates neuronal gain during synaptic excitation. Neuron. 2003; 38:433–445.

48. Pavlov I, Savtchenko LP, Kullmann DM, Semyanov A, Walker MC. Outwardly rectifying tonically active GABAA receptors in pyramidal cells modulate neuronal offset, not gain. J Neurosci. 2009; 29:15341–15350.
49. Hausser M, Clark BA. Tonic synaptic inhibition modulates neuronal output pattern and spatiotemporal synaptic integration. Neuron. 1997; 19:665–678.
Go to : 
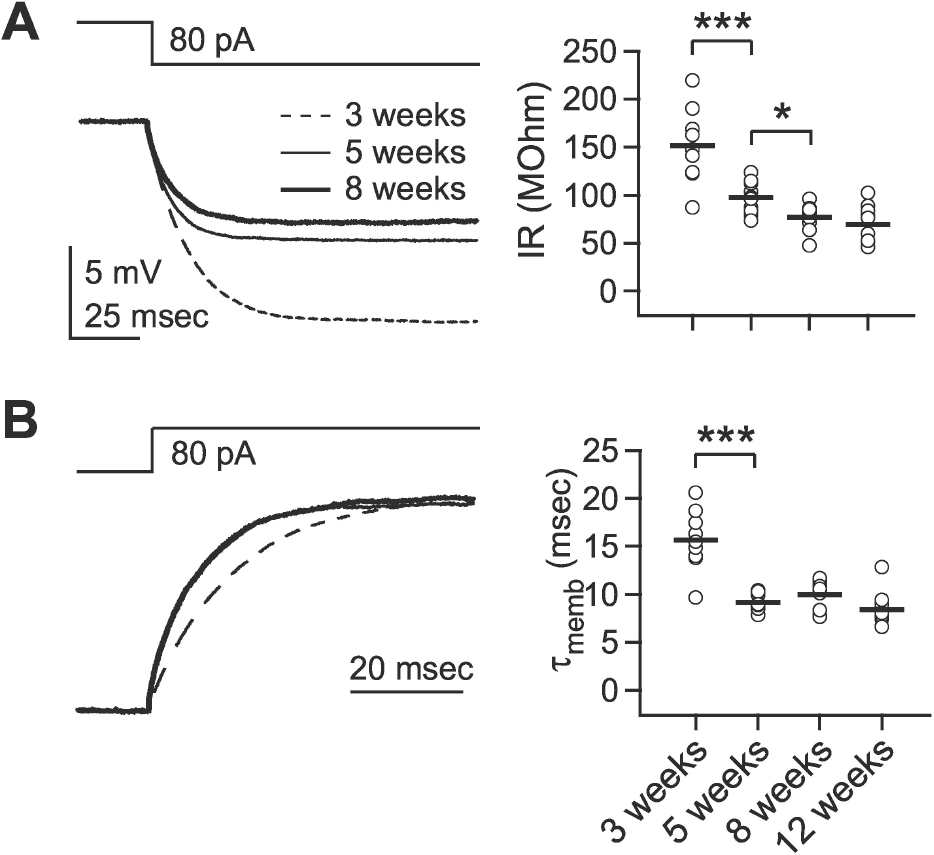 | Fig. 1.Developmental changes in the passive membrane properties. Passive membrane properties were measured by injection of a small negative current (–80 pA). (A) Developmental changes in input resistance. Left panel: upper trace shows the command current and lower traces show the averaged responses of membrane potential in layer 2/3 pyramidal cells at 3- (‘3 weeks,’ dashed line), 5- (‘5 weeks,’ thin solid line), and 8-week-old rats (‘8 weeks,’ thick solid line). The right panel plots individual data (symbols) and averages (thick solid lines). IR: input resistance. (B) Developmental changes in membrane time constant. Left panel: upper trace shows the command current and lower traces show normalized responses of membrane potential in layer 2/3 pyramidal cells. The right panel plots individual data (symbols) and averages (thick solid lines). τmemb: membrane time constant. ∗p<0.05, and ∗∗∗p<0.001 between groups linked by lines. |
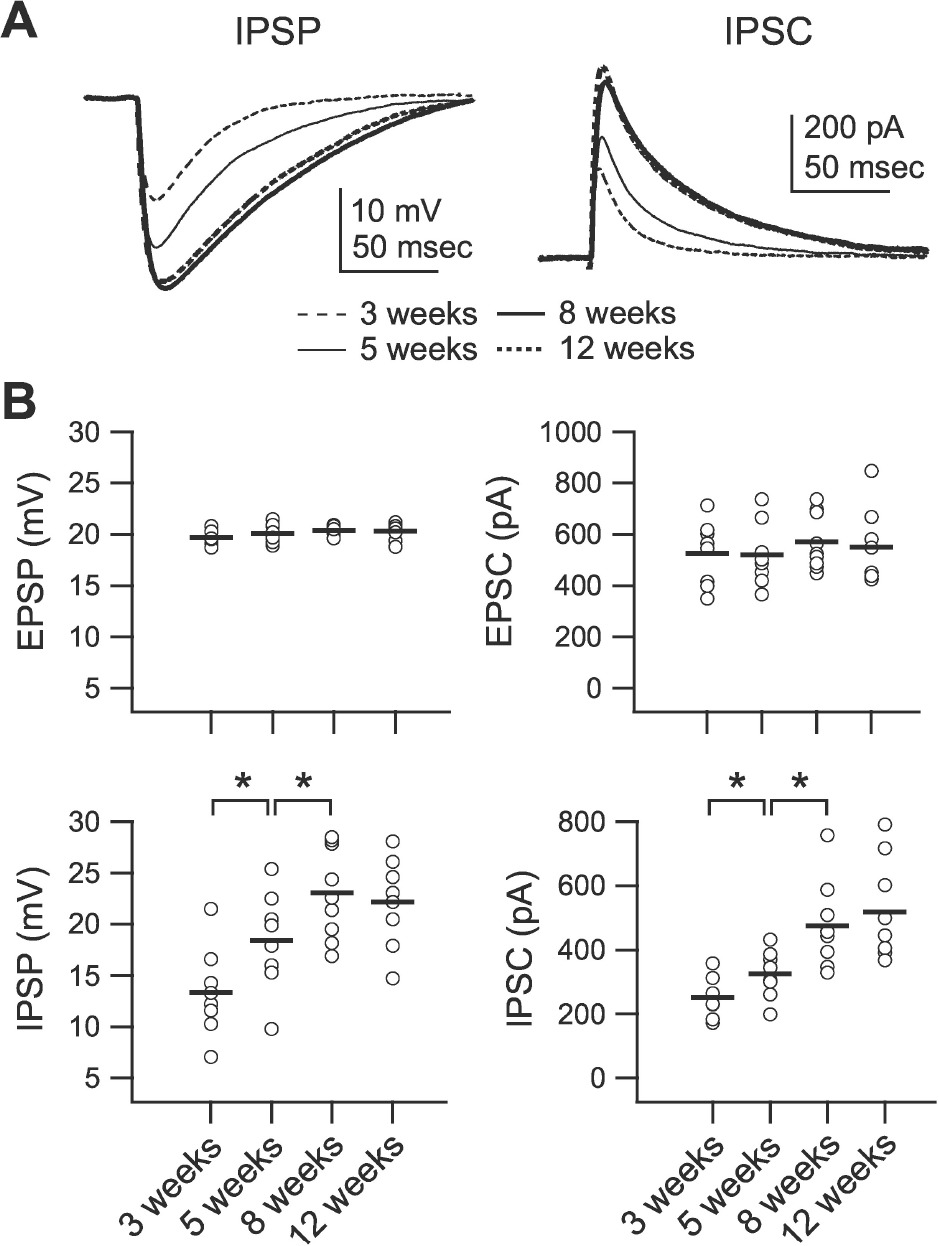 | Fig. 2.Development of phasic inhibition. Inhibitory postsynaptic potential (IPSP) and inhibitory postsynaptic current (IPSC) were recorded at 0 mV of membrane potential in the presence of DNQX (20 μM) and D-AP5 (50 μM) at stimulation intensities that evoked 20 mV depolarization at –75 mV membrane potential. (A) Averaged IPSPs (left traces) and IPSCs (right traces) showing differences between groups. IPSPs and IPSCs were recorded from slices of 3-(‘3 weeks,’ thin dashed lines), 5- (‘5 weeks,’ thin solid lines), 8- (‘8 weeks,’ thick solid lines), and 12-week-old rats (‘12 weeks,’ thick dashed lines). (B) Individual data (symbols) and averages (thick lines) for excitatory postsynaptic potential (EPSP), excitatory post-synaptic current (EPSC), IPSP, and IPSC for each of the groups indicated in the lower panels. ∗p<0.05 between groups linked by lines. |
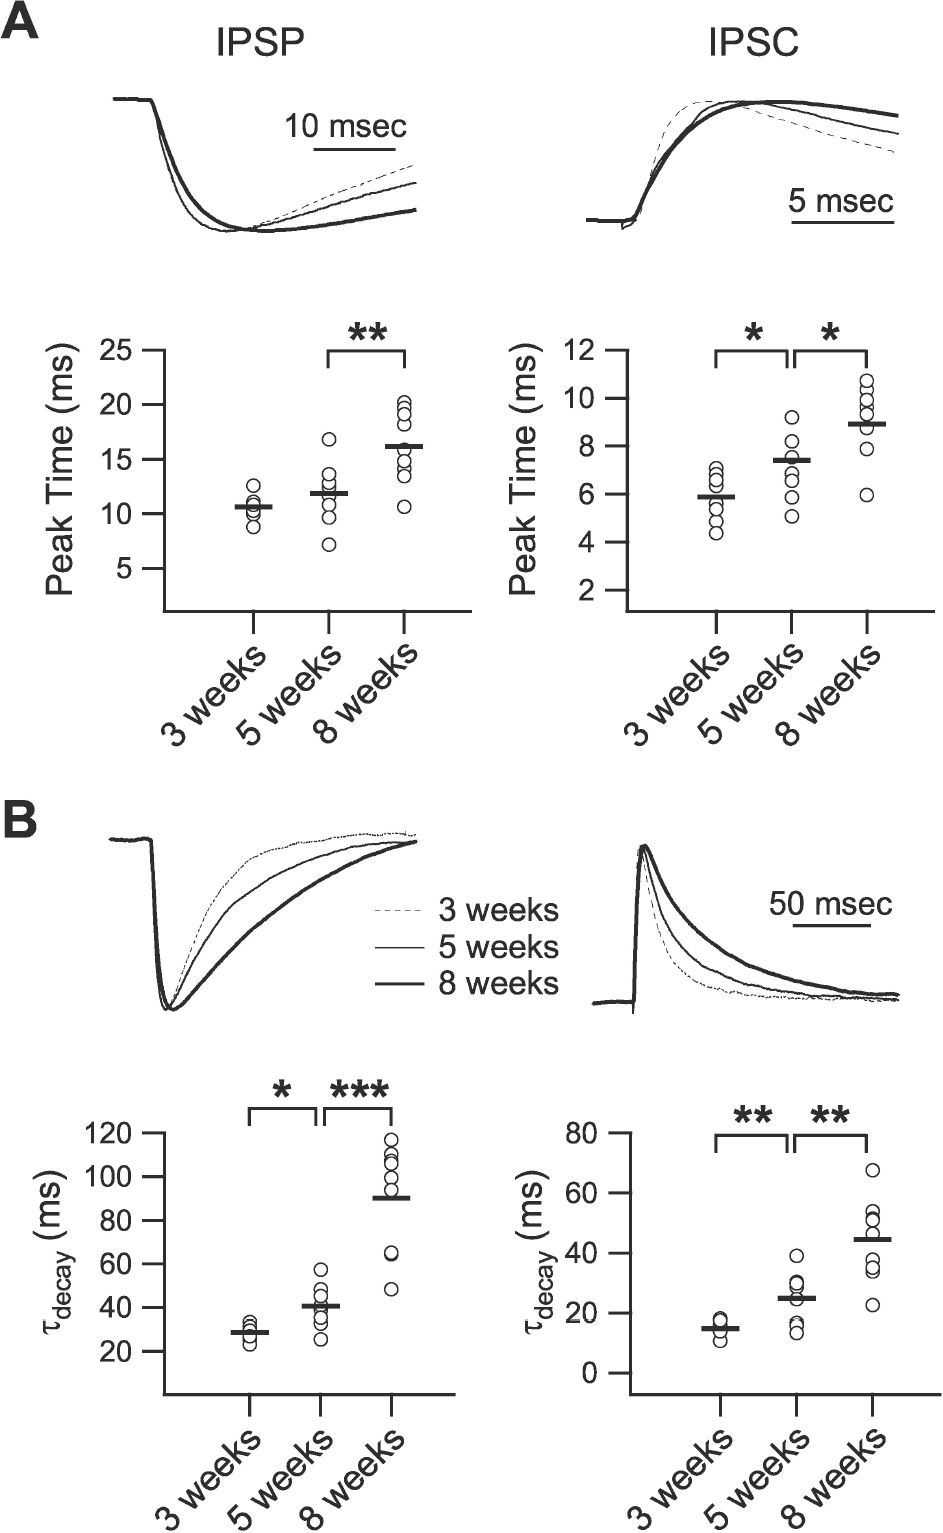 | Fig. 3.Developmental changes in the kinetics of phasic inhibition. (A) Peak time of IPSP (left panel) and IPSC (right panel). Upper traces show normalized IPSPs and IPSCs of 3- (‘3 weeks,’ dashed line), 5- (‘5 weeks,’ thin solid line), and 8-week-old rats (‘8 weeks,’ thick solid line) with an extended time scale. Lower panels plot individual data (symbols) and averages (thick lines) for the peak time of IPSPs and IPSCs. (B) Decay time constant of IPSP (left panel) and IPSC (right panel). Upper traces show normalized IPSPs and IPSCs of 3- (dashed line), 5- (thin solid line), and 8-week-old rats (thick solid line). Lower panels plot individual data (symbols) and averages (thick lines) for the decay time constant of IPSPs and IPSCs. τdecay: decay time constant. ∗p<0.05, ∗∗p<0.01, and ∗∗∗p<0.001 between groups linked by lines. |
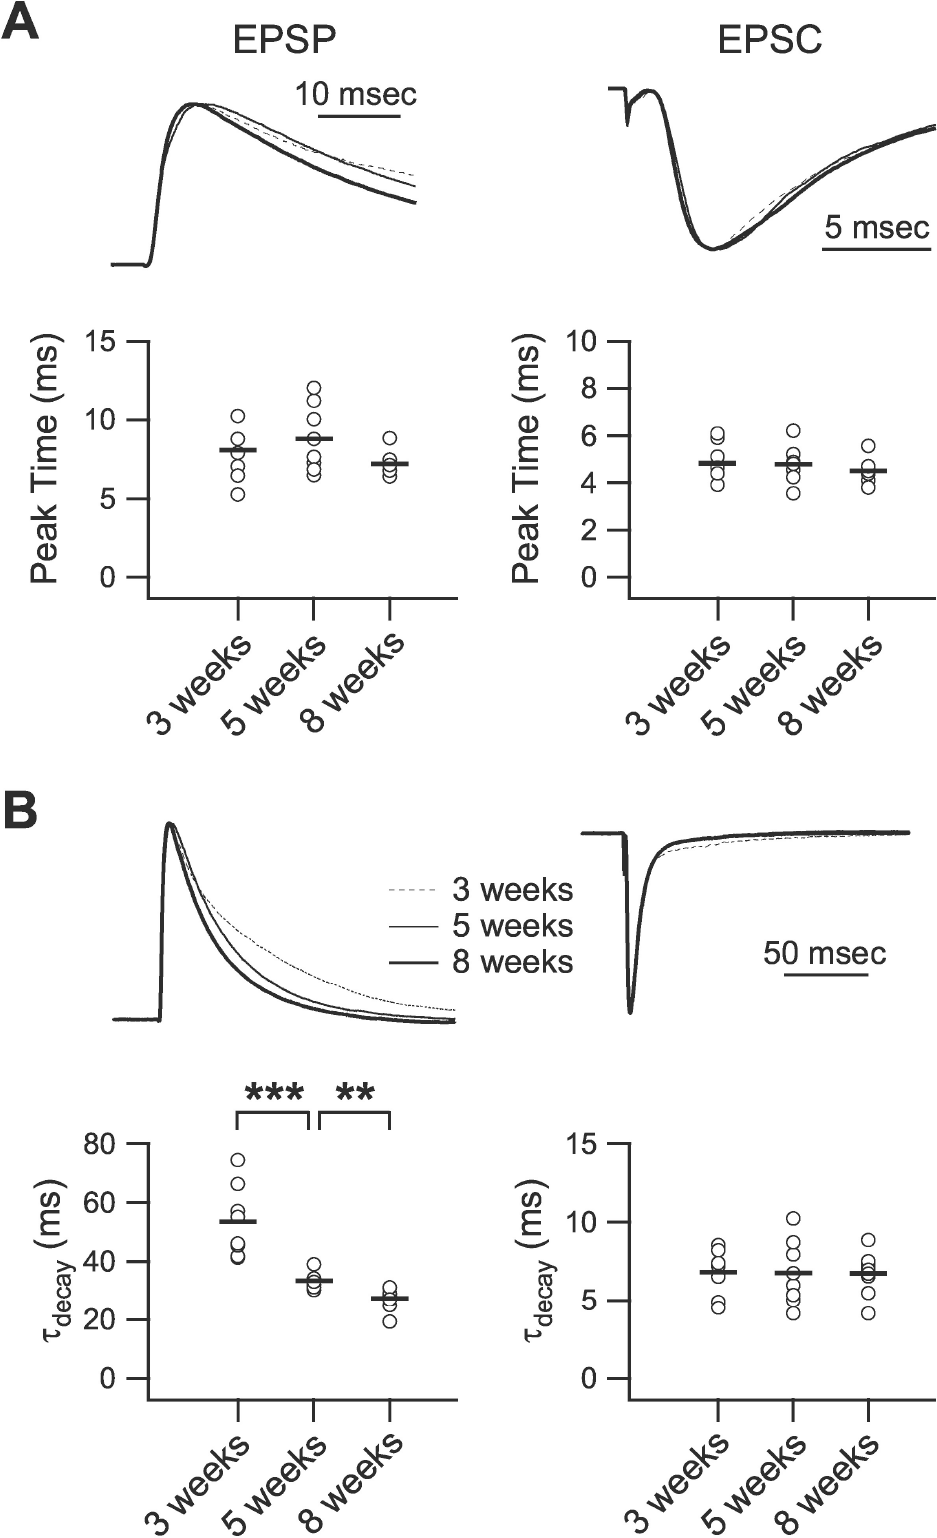 | Fig. 4.Developmental changes in the kinetics of excitation. (A) Peak time of EPSP (left panel) and EPSC (right panel). Upper traces show normalized EPSPs and EPSCs of 3- (‘3 weeks,’ dashed line), 5- (‘5 weeks,’ thin solid line), and 8-week-old rats (‘8 weeks,’ thick solid line) with extended time scale. Lower panels plot individual data (symbols) and averages (thick lines) for the peak time of EPSPs and EPSCs. (B) Decay time constant of EPSP (left panel) and EPSC (right panel). Upper traces show normalized EPSPs and EPSCs of 3- (dashed line), 5- (thin solid line), and 8-week-old rats (thick solid line). Lower panels plot individual data (symbols) and averages (thick lines) for the decay time constant of EPSPs and EPSCs. τdecay: decay time constant. ∗∗p<0.01, and ∗∗∗p<0.001 between groups linked by lines. |
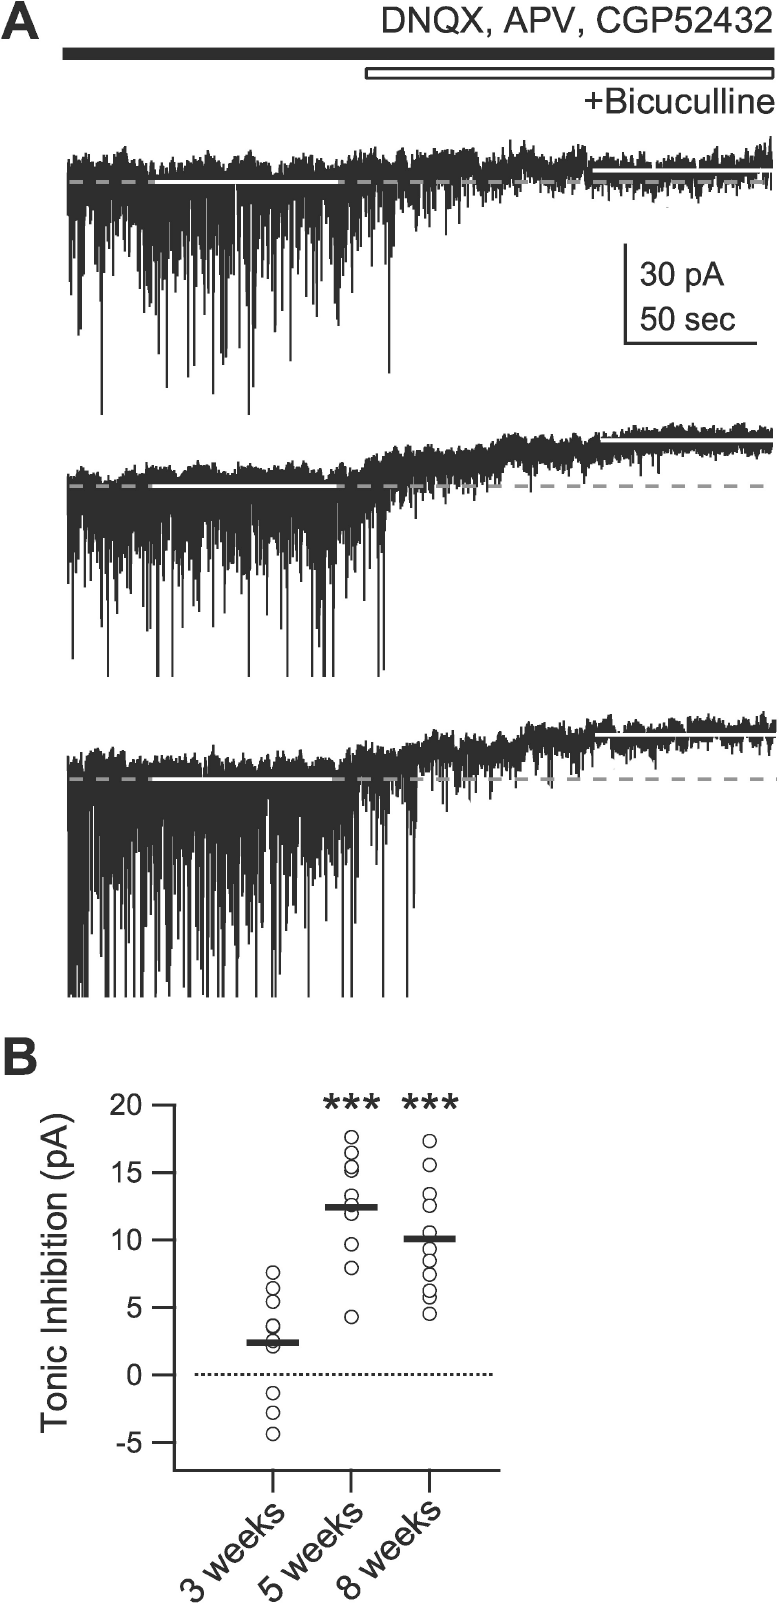 | Fig. 5.Developmental changes in tonic inhibition. Tonic inhibition was measured as the difference between the holding current before and after the application of the GABAA receptor antagonist bicuculline (10 μM) while membrane potential was clamped at –75 mV. (A) Current traces at the holding potential of –75 mV before and after the application of bicuculline for 3- (top trace), 5- (middle trace), and 8-week-old rats (bottom trace). White solid lines indicate periods at which holding currents were measured. Grey dashed lines indicate holding currents measured before the application of bicuculline. (B) Individual data (symbols) and averages (thick lines) of the changes in holding currents for 3- (‘3 weeks’), 5- (‘5 weeks’), and 8-week-old rats (‘8 weeks’). ∗∗∗p<0.001 vs. ‘3 weeks’. |


 PDF
PDF ePub
ePub Citation
 Print
Print


 XML Download