Abstract
The sleep homeostatic response significantly affects the state of anesthesia. In addition, sleep recovery may occur during anesthesia, either via a natural sleep-like process to occur or via a direct restorative effect. Little is known about the effects of isoflurane anesthesia on sleep homeostasis. We investigated whether 1) isoflurane anesthesia could provide a sleep-like process, and 2) the depth of anesthesia could differently affect the post-anesthesia sleep response. Nine rats were treated for 2 hours with ad libitum sleep (Control), sleep deprivation (SD), and isoflurane anesthesia with delta-wave-predominant state (ISO-1) or burst suppression pattern-predominant state (ISO-2) with at least a 1-week interval. Electroencephalogram and electromyogram were recorded and sleep-wake architecture was evaluated for 4 hours after each treatment. In the post-treatment period, the duration of transition to slow-wave-sleep decreased but slow wave sleep (SWS) increased in the SD group, but no sleep stages were significantly changed in ISO-1 and ISO-2 groups compared to Control. Different levels of anesthesia did not significantly affect the post-anesthesia sleep responses, but the deep level of anesthesia significantly delayed the latency to sleep compared to Control. The present results indicate that a natural sleep-like process likely occurs during isoflurane anesthesia and that the post-anesthesia sleep response occurs irrespective to the level of anesthesia.
Go to : 
References
2. Tung A, Bergmann BM, Herrera S, Cao D, Mendelson WB. Recovery from sleep deprivation occurs during propofol anesthesia. Anesthesiology. 2004; 100:1419–1426.

3. Tung A, Lynch JP, Mendelson WB. Prolonged sedation with propofol in the rat does not result in sleep deprivation. Anesth Analg. 2001; 92:1232–1236.

4. Tung A, Szafran MJ, Bluhm B, Mendelson WB. Sleep deprivation potentiates the onset and duration of loss of righting reflex induced by propofol and isoflurane. Anesthesiology. 2002; 97:906–911.

5. Lu J, Nelson LE, Franks N, Maze M, Chamberlin NL, Saper CB. Role of endogenous sleep-wake and analgesic systems in anesthesia. J Comp Neurol. 2008; 508:648–662.

6. Nelson LE, Lu J, Guo T, Saper CB, Franks NP, Maze M. The alpha2-adrenoceptor agonist dexmedetomidine converges on an endogenous sleep-promoting pathway to exert its sedative effects. Anesthesiology. 2003; 98:428–436.
7. Kelz MB, Sun Y, Chen J, Cheng Meng Q, Moore JT, Veasey SC, Dixon S, Thornton M, Funato H, Yanagisawa M. An essential role for orexins in emergence from general anesthesia. Proc Natl Acad Sci U S A. 2008; 105:1309–1314.

8. Cooper AB, Thornley KS, Young GB, Slutsky AS, Stewart TE, Hanly PJ. Sleep in critically ill patients requiring mechanical ventilation. Chest. 2000; 117:809–818.

9. Chen HI, Tang YR. Sleep loss impairs inspiratory muscle endurance. Am Rev Respir Dis. 1989; 140:907–909.

10. Irwin M. Effects of sleep and sleep loss on immunity and cytokines. Brain Behav Immun. 2002; 16:503–512.

11. Spiegel K, Leproult R, Van Cauter E. Impact of sleep debt on metabolic and endocrine function. Lancet. 1999; 354:1435–1439.

12. Sleigh JW, Andrzejowski J, Steyn-Ross A, Steyn-Ross M. The bispectral index: a measure of depth of sleep? Anesth Analg. 1999; 88:659–661.
13. Tung A, Lynch JP, Roizen MF. Use of the BIS monitor to detect onset of naturally occurring sleep. J Clin Monit Comput. 2002; 17:37–42.
14. Maloney KJ, Mainville L, Jones BE. c-Fos expression in dopaminergic and GABAergic neurons of the ventral mesencephalic tegmentum after paradoxical sleep deprivation and recovery. Eur J Neurosci. 2002; 15:774–778.

15. Sapin E, Lapray D, Berod A, Goutagny R, Leger L, Ravassard P, Clement O, Hanriot L, Fort P, Luppi PH. Localization of the brainstem GABAergic neurons controlling paradoxical (REM) sleep. PLoS ONE. 2009; 4:e4272.

16. Jang HS, Kim JY, Kim SH, Lee MG. Role of dopamine receptors on electroencephalographic changes produced by repetitive apomorphine treatments in rats. Korean J Physiol Pharmacol. 2009; 13:147–151.

17. Wisor JP, Edgar DM, Yesavage J, Ryan HS, McCormick CM, Lapustea N, Murphy GM Jr. Sleep and circadian abnormalities in a transgenic mouse model of Alzheimer's disease: a role for cholinergic transmission. Neuroscience. 2005; 131:375–385.

18. Borbely AA, Tobler I, Hanagasioglu M. Effect of sleep deprivation on sleep and EEG power spectra in the rat. Behav Brain Res. 1984; 14:171–182.
19. Knill RL, Moote CA, Skinner MI, Rose EA. Anesthesia with abdominal surgery leads to intense REM sleep during the first postoperative week. Anesthesiology. 1990; 73:52–61.

Go to : 
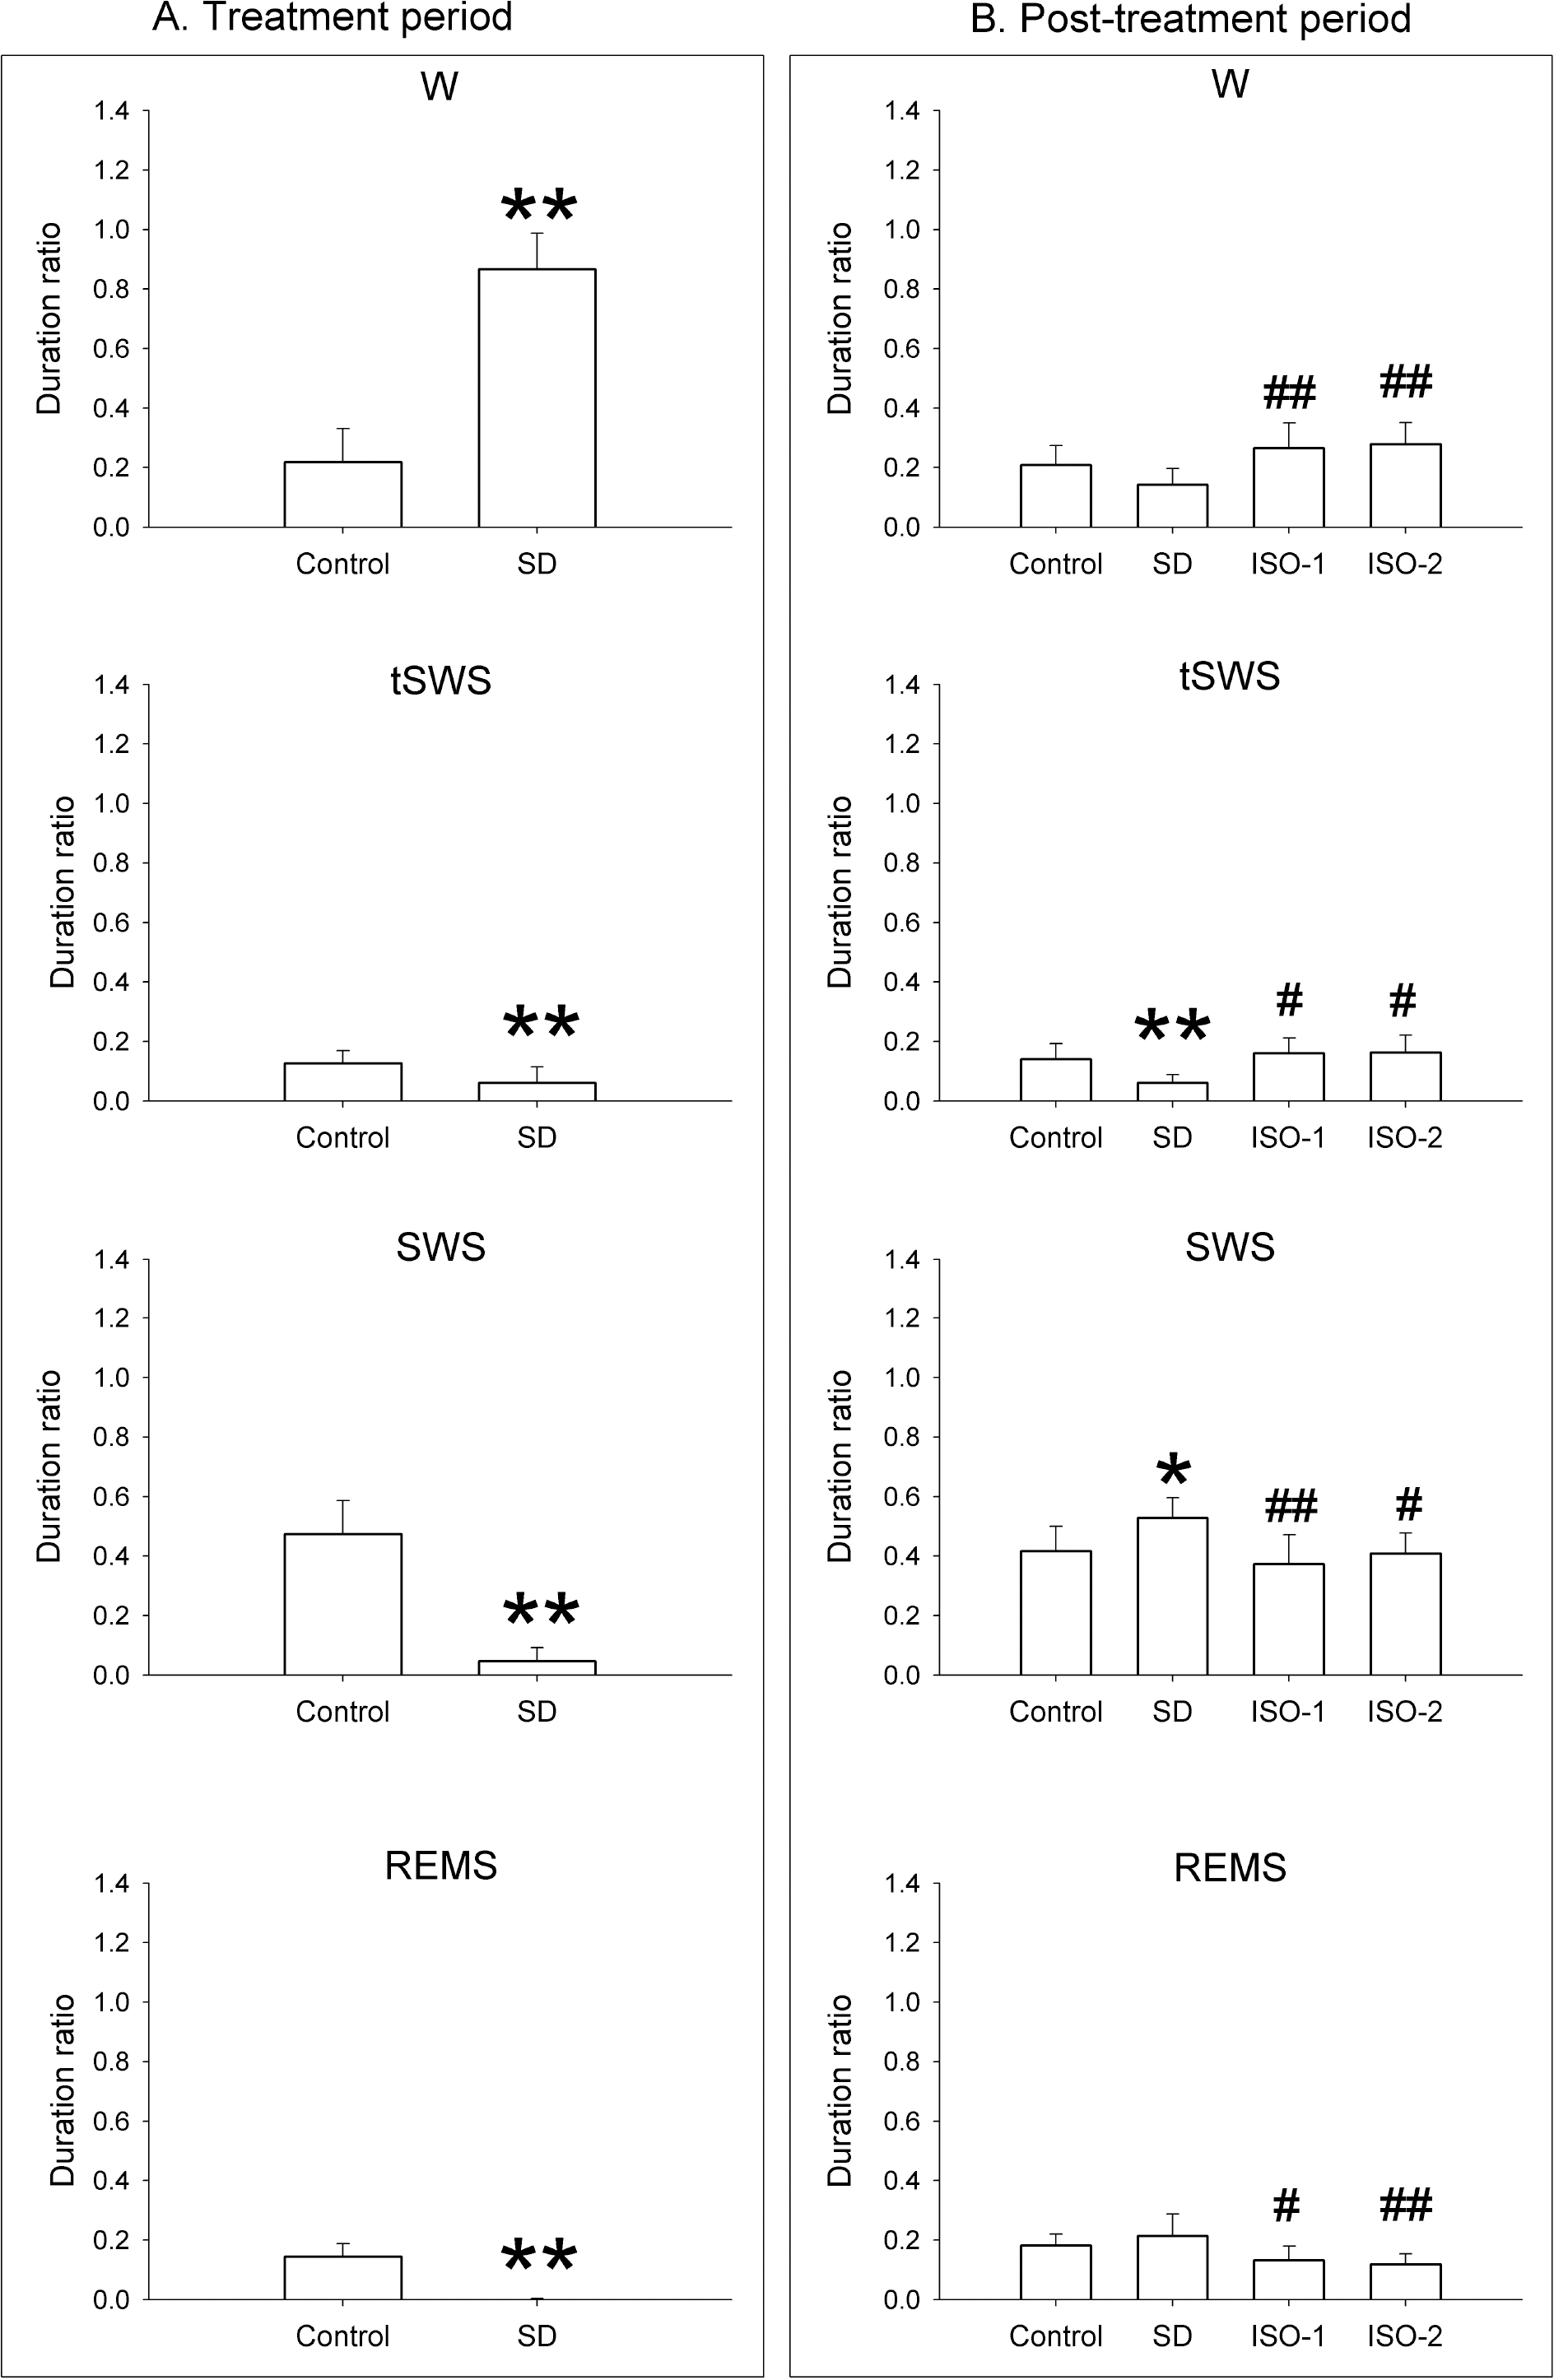 | Fig. 1.Duration ratio of each episode to total recording time in rats during the treatment period and the post-treatment period. In the treatment period, the rats were given ad libitum sleep, sleep deprivation, and delta wave-predominant state or burst suppression pattern-predominant state of isoflurane anesthesia (‘Control’, ‘SD’, ‘ISO-1’ and ‘ISO-2’ groups, respectively) during the treatment period. In the treatment period, ISO-1 and ISO-2 groups received 1.5-hour anesthesia followed by 30-minute washout, and the duration ratio of the delta-predominant state was 0.91 (0.1) and burst suppression-predominant state was 0.95 (0.1). Vigilance stages during 4-hour post-treatment period following 2-hour treatments were scored as 4 episodes using electroencephalogram and electromyogram: wakefulness (W), transition to slow-wave-sleep (tSWS), slow-wave-sleep (SWS) and rapid-eye-movement sleep (REMS). Data were expressed as mean (SD), n=9 per group. Data were analyzed by one-way ANOVA followed by a Bonferroni test. ∗p< 0.05 and ∗∗p<0.01 vs. Control group, and #p<0.05 and ##p<0.01 vs. SD group. |
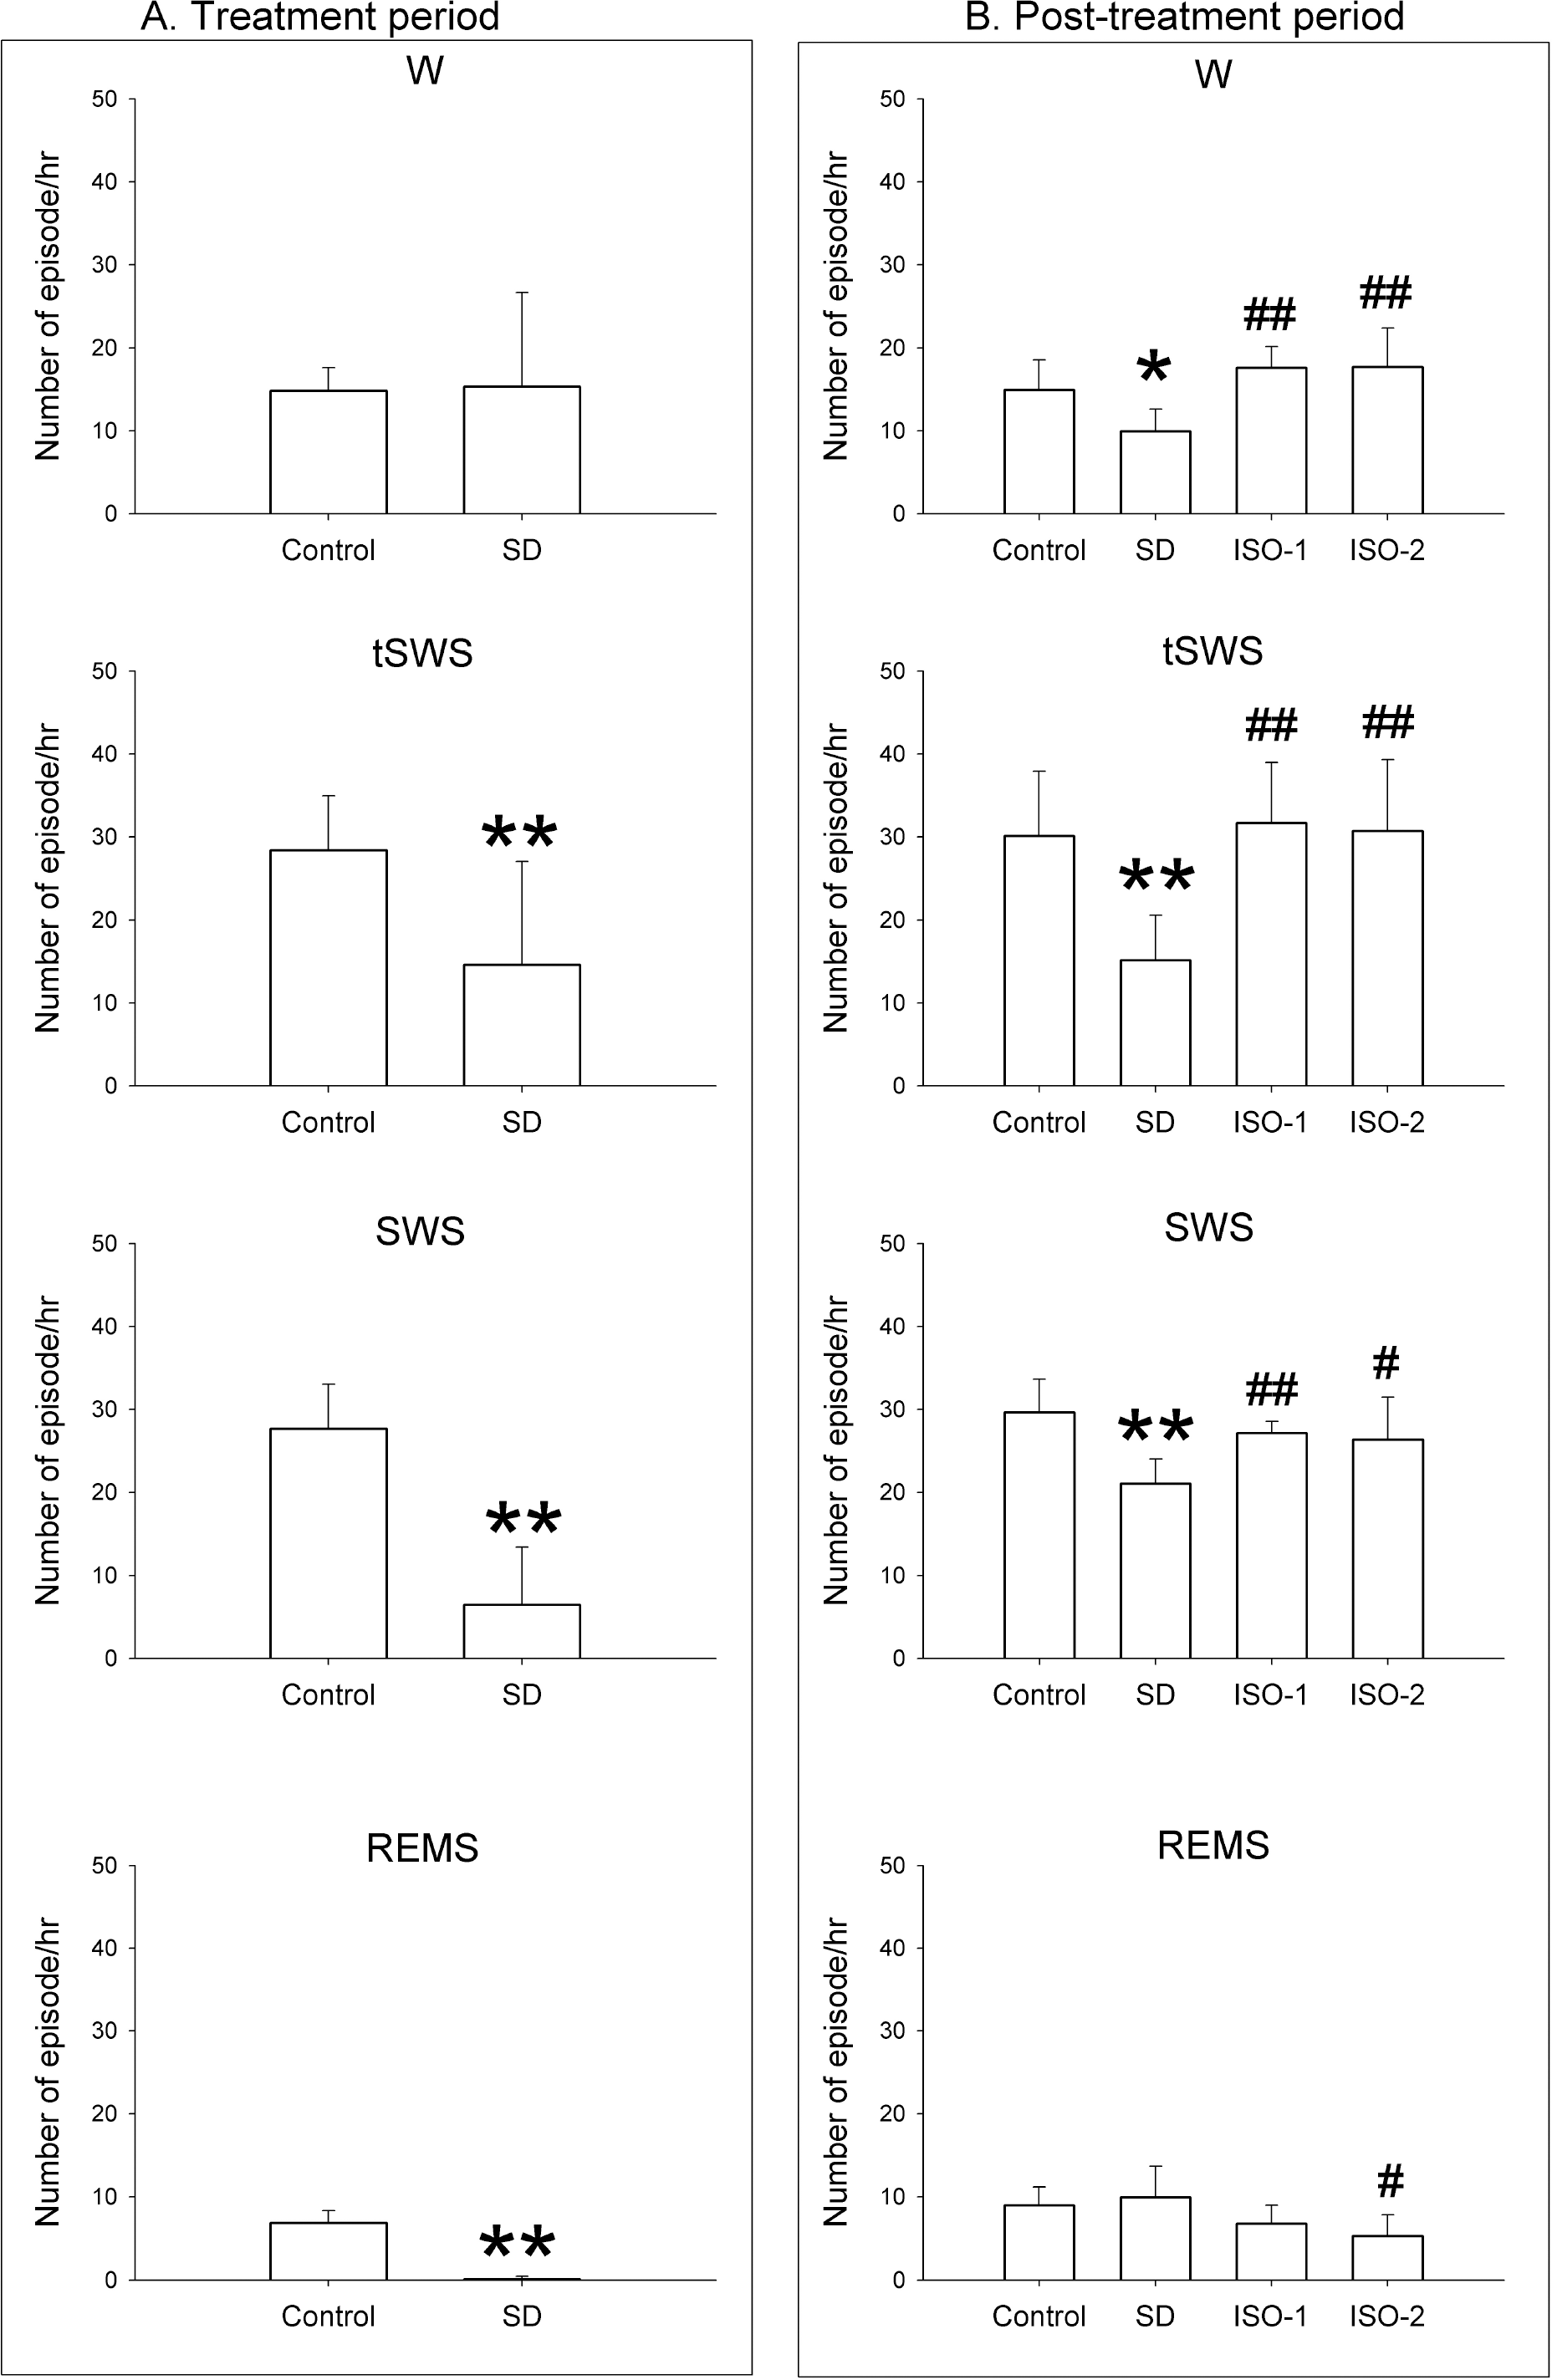 | Fig. 2.Number of episodes per hour in rats during the treatment period and the post-treatment period. The rats were given ad libitum sleep, sleep deprivation, and delta wave-predominant state or burst suppression pattern-predominant state of isoflurane anesthesia (‘Control’, ‘SD’, ‘ISO-1’ and ‘ISO-2’ groups, respectively) during the treatment period. In the treatment period, delta predominant state occurred at 2.72 (2.7) and burst suppression predominant state occurred at 0.85 (0.5). Vigilance stages during 4-hour post-treatment period following 2-hour treatments were scored as 4 episodes using electroencephalogram and electromyogram: wakefulness (W), transition to slow-wave-sleep (tSWS), slow-wave-sleep (SWS) and rapid-eye-movement sleep (REMS). Data were expressed as mean (SD), n=9 per group. Data were analyzed by one-way ANOVA followed by a Bonferroni test. ∗p< 0.05 and ∗∗p<0.01 vs. Control group, and #p<0.05 and ##p<0.01 vs. SD group. |
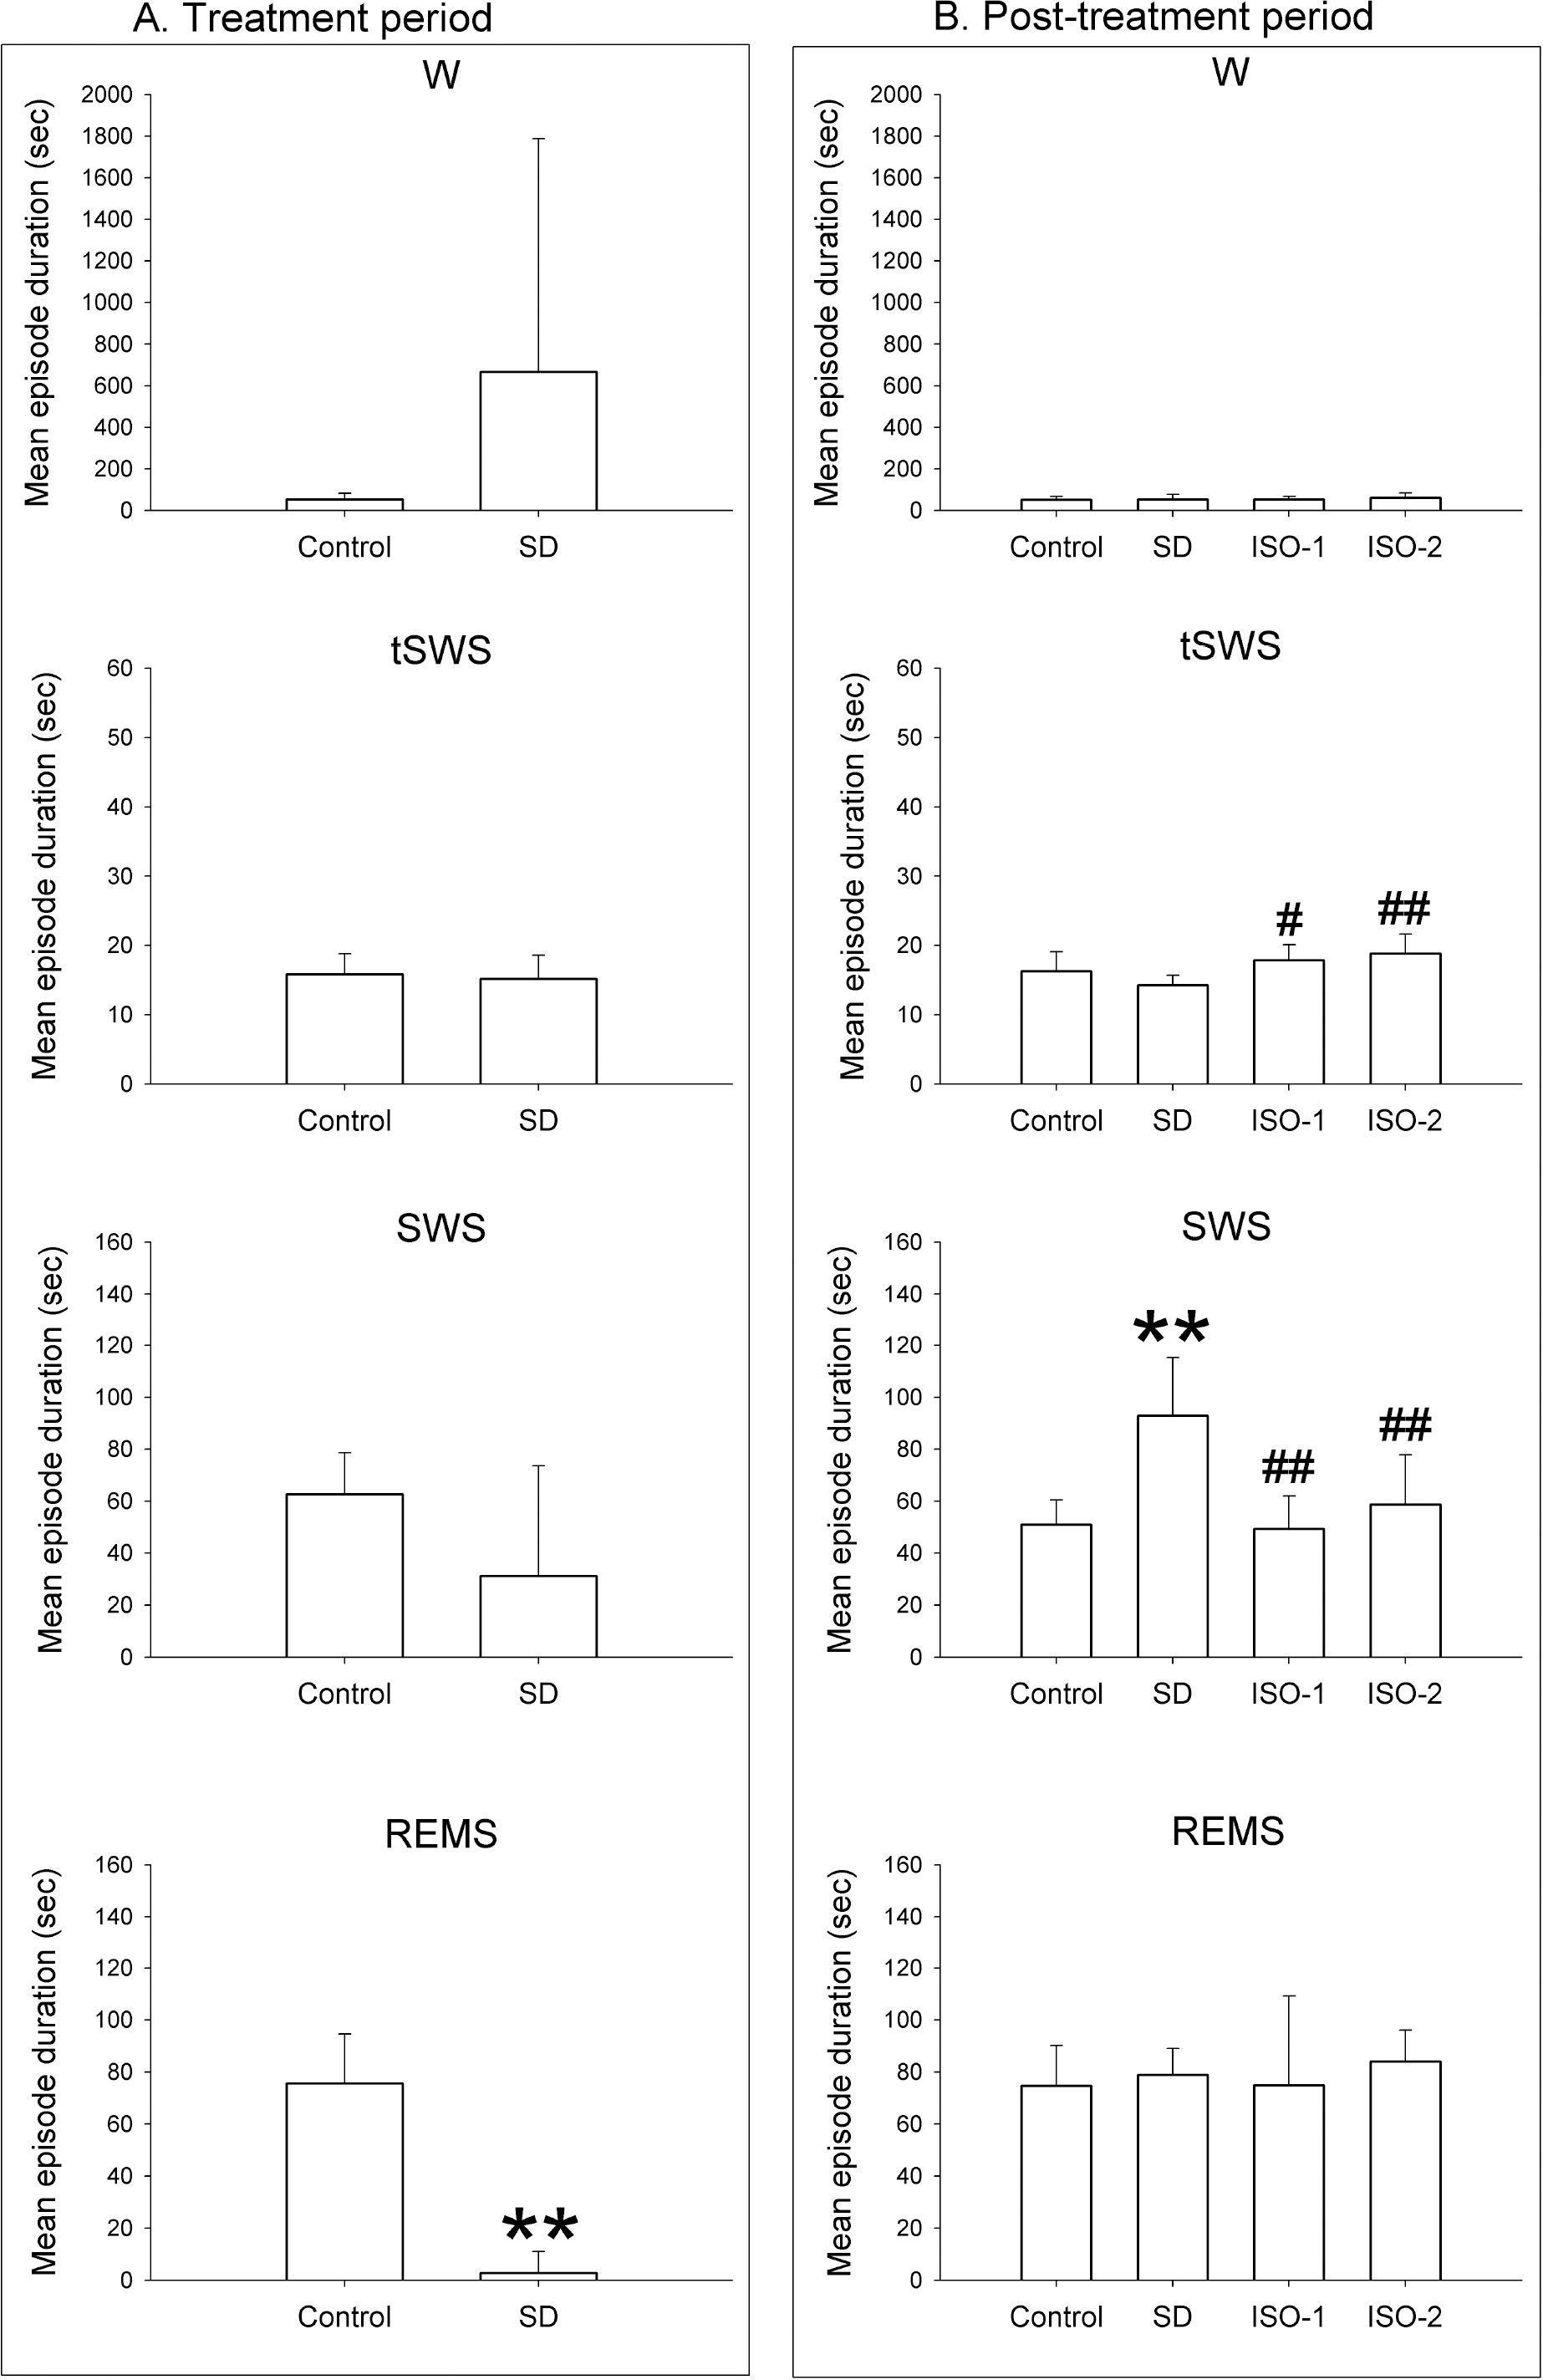 | Fig. 3.Mean episode duration during total recording time in rats during the treatment period and the post-treatment period. In the treatment period, the rats were given ad libitum sleep, sleep deprivation, and delta wave-predominant state or burst suppression pattern-predominant state of isoflurane anesthesia (‘Control’, ‘SD’, ‘ISO-1’ and ‘ISO-2’ groups, respectively). In the treatment period, the values of the delta-predominant state was 3006 (2448.1) and that of the burst suppression-predominant state was 4701.43 (1365.4). Vigilance stages during the 4-hour post-treatment period following 2-hour treatments were scored as 4 episodes using electroencephalogram and electromyogram: wakefulness (W), transition to slow-wave-sleep (tSWS), slow-wave-sleep (SWS) and rapid-eye-movement sleep (REMS). Data were expressed as mean (SD), n=9 per group. Data were analyzed by one-way ANOVA followed by a Bonferroni test. ∗∗p<0.01 vs. Control group, and #p<0.05 and ##p<0.01 vs. SD group. |
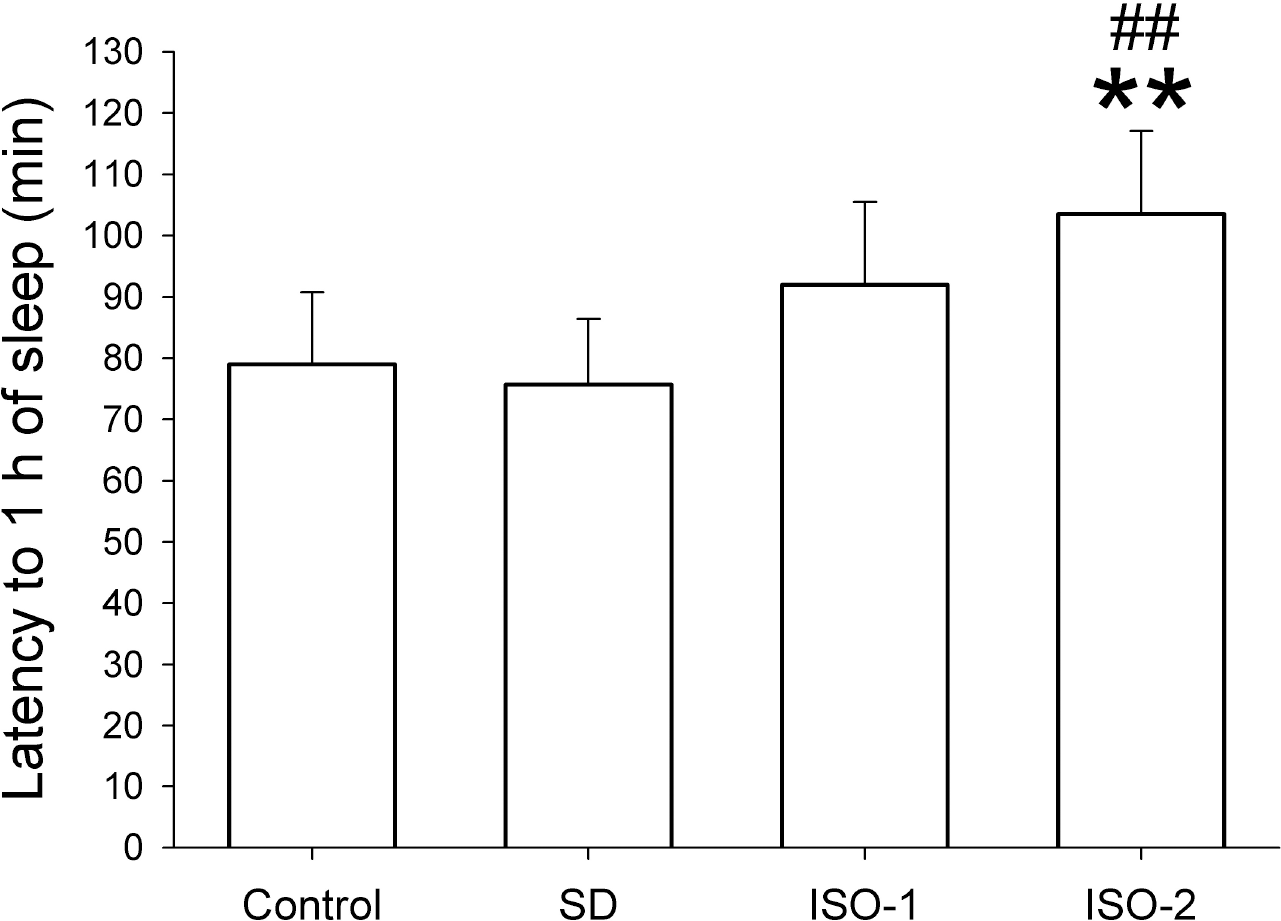 | Fig. 4.The latency to 1 hour of sleep in rats after ad libitum sleep, sleep deprivation and isoflurane anesthesia according to groups. The rats were given ad libitum sleep, sleep deprivation, and delta wave-predominant state or burst suppression pattern-predominant state of isoflurane anesthesia (group ‘Control’, ‘SD’, ‘ISO-1’ and ‘ISO-2’, respectively) during the treatment period. Vigilance stages during the 4-hour post-treatment period following 2-hour treatments were scored as 4 episodes using electroencephalogram and electromyogram: wakefulness (W), transition to slow-wave-sleep (tSWS), slow-wave-sleep (SWS) and rapid-eye-movement sleep (REMS). In order to quantify the sleep pressure, the latency to 1-hour of sleep was calculated: the amount of time from 14:00 to the accumulation of total of 360 epochs (i.e., 1 hour) scored as sleep (without regard to the tSWS, SWS, REMS). Data were expressed as mean (SD bar), n=9 per group. Data were analyzed by one-way ANOVA followed by a Bonferroni test. ∗∗p<0.01 vs. Control group, and ##p<0.01 vs. SD group. |
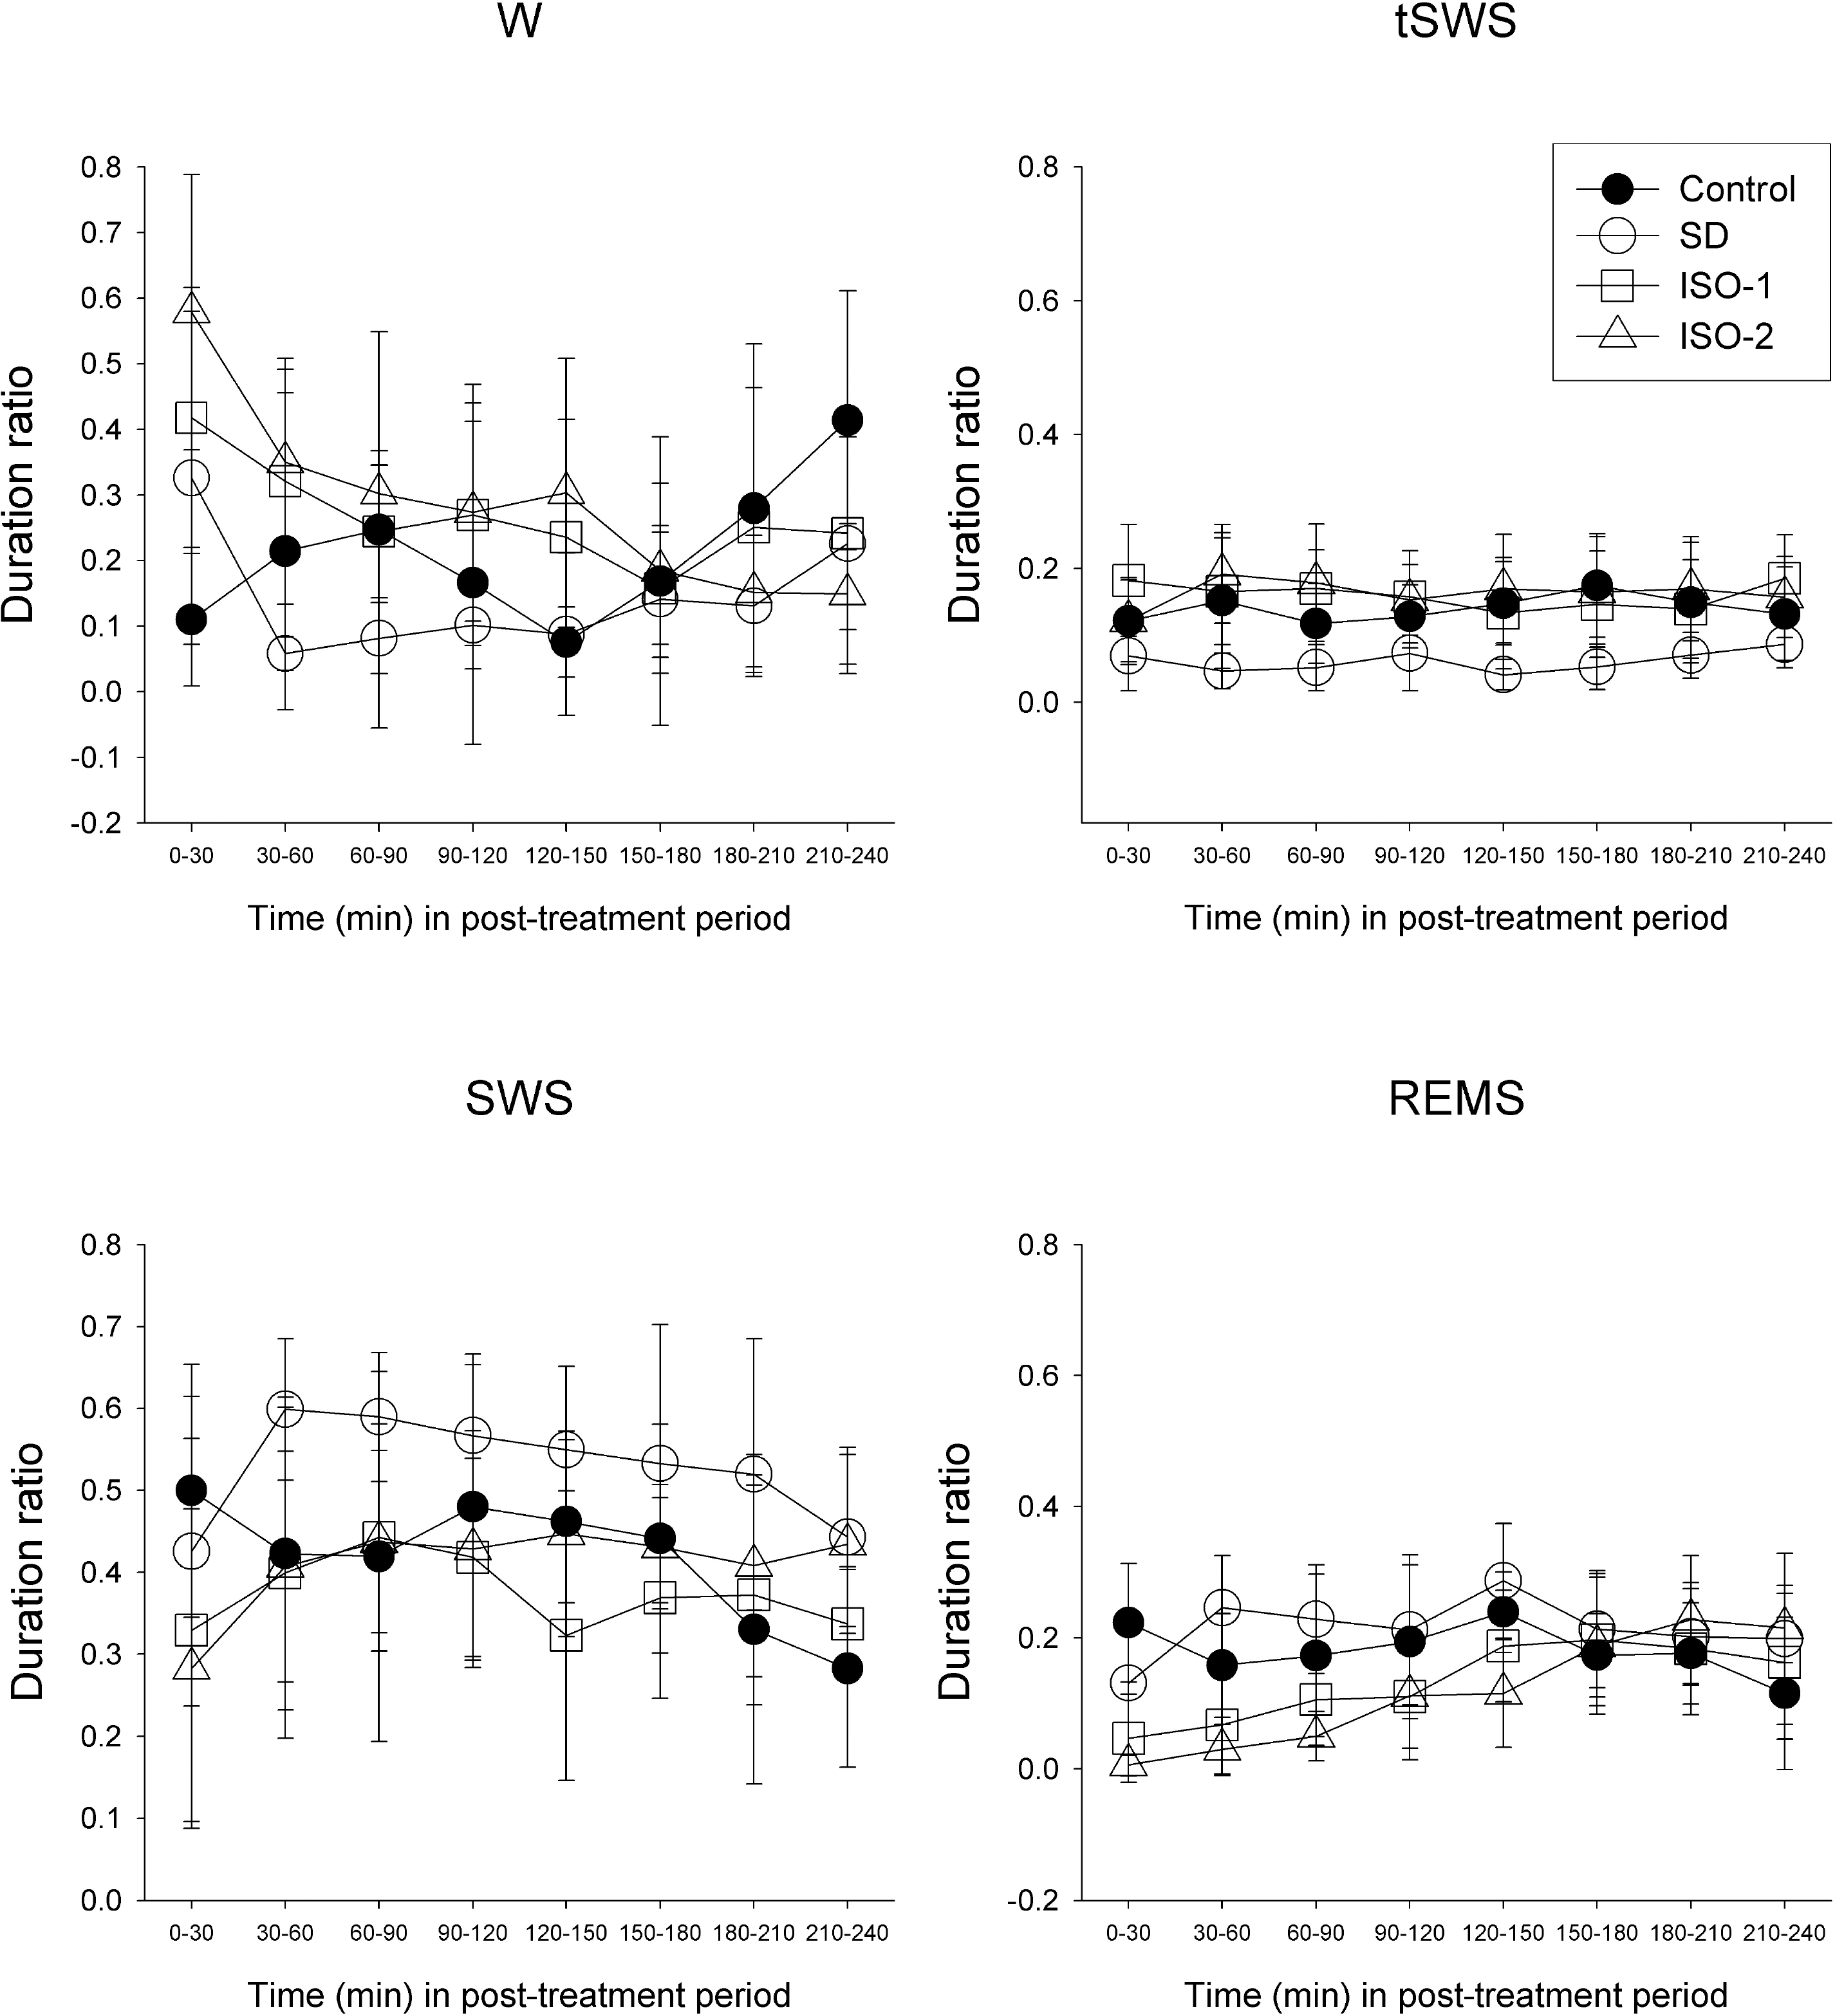 | Fig. 5.Time course of the duration ratio at each episode in rats during the treatment period and the post-treatment period. The rats were given ad libitum sleep, sleep deprivation, and delta wave-predominant state or burst suppression pattern-predominant state of isoflurane anesthesia (‘Control’, ‘SD’, ‘ISO-1’ and ‘ISO-2’ groups, respectively) during the treatment period. Vigilance stages during the 4-hour post-treatment period following 2-hour treatments were scored as 4 episodes using electroencephalogram and electromyogram: wakefulness (W), transition to slow-wave-sleep (tSWS), slow-wave-sleep (SWS) and rapid-eye-movement sleep (REMS). Data were expressed as mean (SD), n=9 per group. Data were analyzed by two-factor repeated measures ANOVA followed by a Bonferroni test. Statistical results are not marked in the figure but are described in the text. |


 PDF
PDF ePub
ePub Citation
 Print
Print


 XML Download